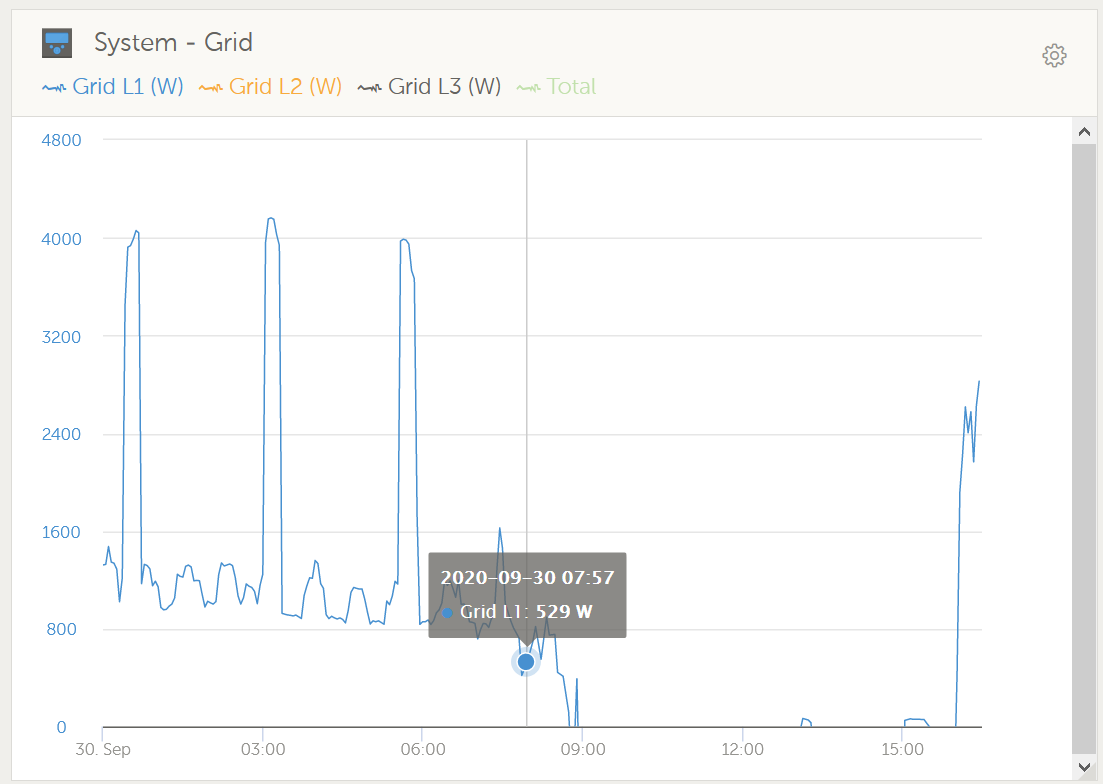
All of a sudden today the VRM graphs for my install stopped showing negative values... e.g. grid power (but not limited to):

Why is this?
The data is definitely there. It was showing during the late morning, but now it's gone.
Logging out/in doesn't change the behavior.
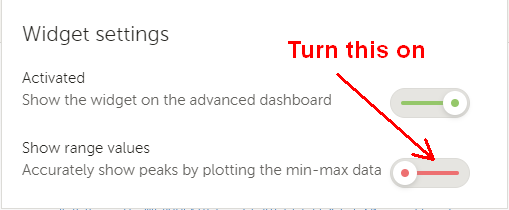
I cant seem to find a setting that would be relevant to this. Am I missing something?
Seems coincidental that I recently upgraded to Venus 2.60 the day before
My big thanks to the team for the grid feed-in function, I've been waiting patiently for that.
It does seem to hunt around a bit, but feed-in average is all I was looking for over a 30 minute period (i.e. the grid provider's measurement window).
The realtime display is a great additional also...
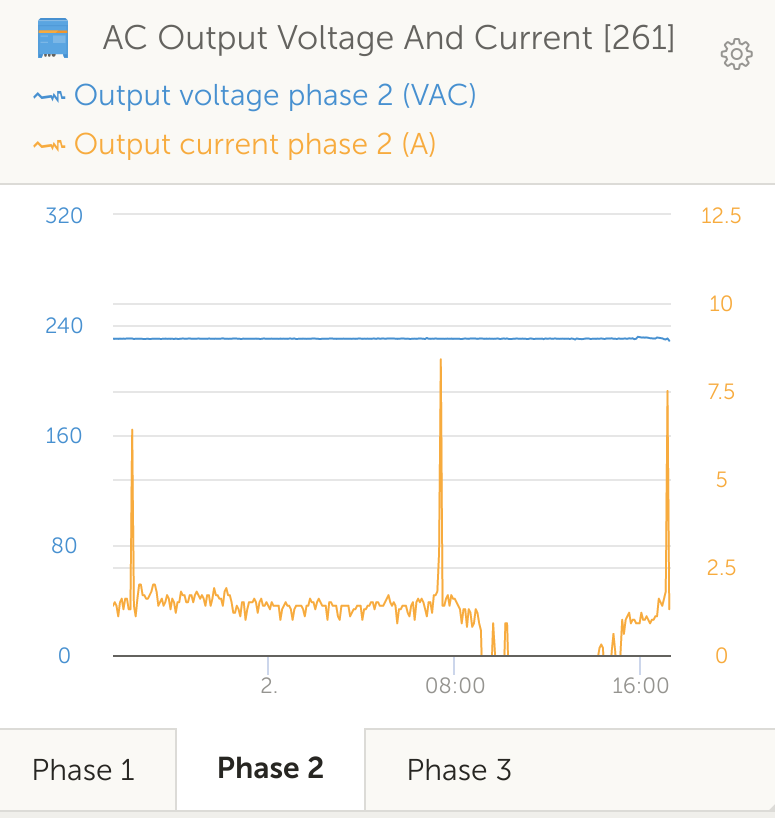
It looks great, even on the mobile app, although I notice there's no room for most of the detail graphs...


