question

michael-hilton avatar image
michael-hilton asked

VRM graphs all of a sudden stopped showing negative values

All of a sudden today the VRM graphs for my install stopped showing negative values... e.g. grid power (but not limited to):
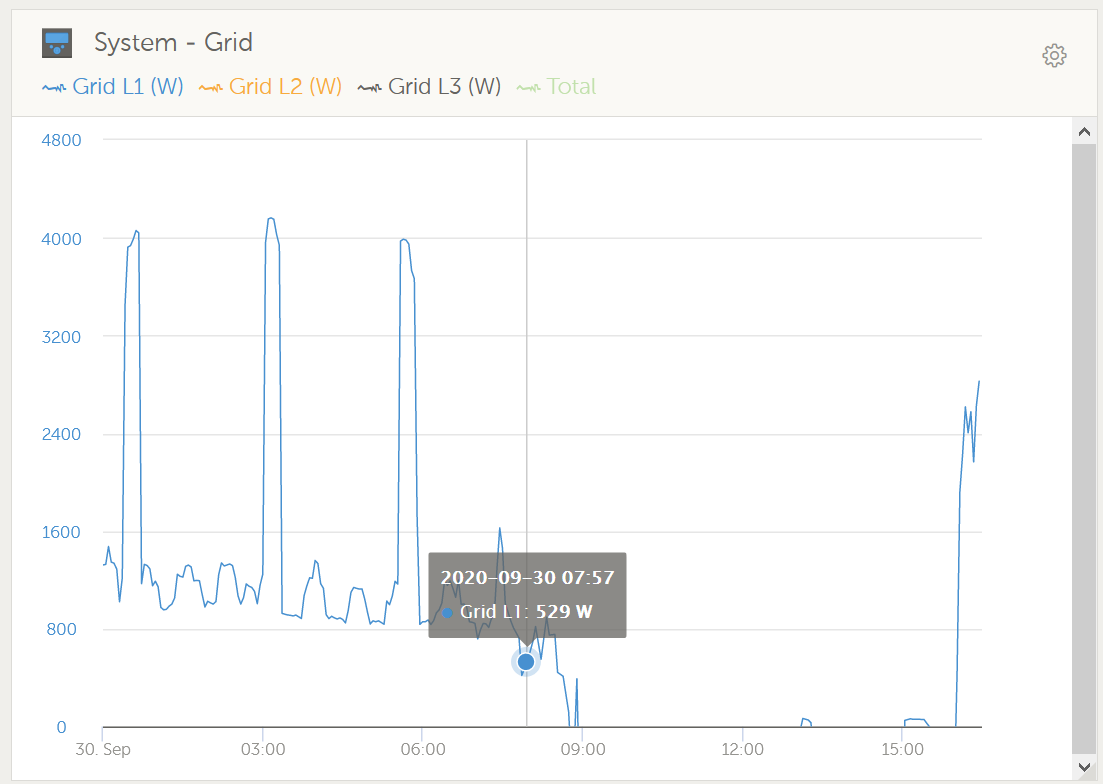
Why is this?

The data is definitely there. It was showing during the late morning, but now it's gone.

Logging out/in doesn't change the behavior.

I cant seem to find a setting that would be relevant to this. Am I missing something?

Seems coincidental that I recently upgraded to Venus 2.60 the day before

My big thanks to the team for the grid feed-in function, I've been waiting patiently for that.
It does seem to hunt around a bit, but feed-in average is all I was looking for over a 30 minute period (i.e. the grid provider's measurement window).

The realtime display is a great additional also...
It looks great, even on the mobile app, although I notice there's no room for most of the detail graphs...

VRM
1601535631453.png (40.1 KiB)
2 comments
2 |3000

Up to 8 attachments (including images) can be used with a maximum of 190.8 MiB each and 286.6 MiB total.

petajoule avatar image petajoule commented ·

#metoo - pretty sure this glitch will be resolved quickly

0 Likes 0 ·
Show more comments
4 Answers
Meine_Energiewende avatar image
Meine_Energiewende answered ·

same here ....

2 |3000

Up to 8 attachments (including images) can be used with a maximum of 190.8 MiB each and 286.6 MiB total.

nigelfxs avatar image
nigelfxs answered ·

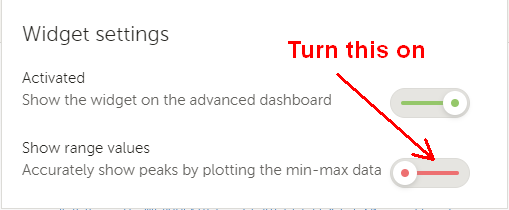
You can fix this by clicking on the Widget settings (cog icon) - then enable the "Show range values".


1601543874937.png (14.2 KiB)
1601543930076.png (15.6 KiB)
4 comments
2 |3000

Up to 8 attachments (including images) can be used with a maximum of 190.8 MiB each and 286.6 MiB total.

marekp avatar image marekp commented ·

Is there a way to make this selection permanent?

0 Likes 0 ·
nigelfxs avatar image nigelfxs commented ·

I think this must be "work in progress" - it does not remember this setting if I log out and then log back in...

0 Likes 0 ·
marekp avatar image marekp nigelfxs commented ·

You do not have to log out to loose this setting.

It is enough just to move to dashboard and back and they are gone.

We have to be patient. :)

0 Likes 0 ·
bathnm avatar image bathnm commented ·

However without this the range is working OK for Voltage.

0 Likes 0 ·
Teun Lassche avatar image
Teun Lassche answered ·

@Michael Hilton thanks! Fix is on it's way, expect it to land in production soon

3 comments
2 |3000

Up to 8 attachments (including images) can be used with a maximum of 190.8 MiB each and 286.6 MiB total.

bathnm avatar image bathnm commented ·

Mine is now working as it did last night. Thanks for fixing.

0 Likes 0 ·
petajoule avatar image petajoule commented ·

@Teun Lassche (Victron Energy Staff) Seems there is a regression. See my answer in this thread today (chart is from today).

0 Likes 0 ·
Teun Lassche avatar image Teun Lassche ♦ petajoule commented ·

@PetaJoule this should be fixed

0 Likes 0 ·
petajoule avatar image
petajoule answered ·

Groundhog Day:


1604333889701.png


And no, "show ranged values" doesn't resolve the issue.


1604333889701.png (57.3 KiB)
2 |3000

Up to 8 attachments (including images) can be used with a maximum of 190.8 MiB each and 286.6 MiB total.

Related Resources

Additional resources still need to be added for this topic