question

jason-lane avatar image
jason-lane asked

SOC Stopped Showing on VRM Dashboard Chart

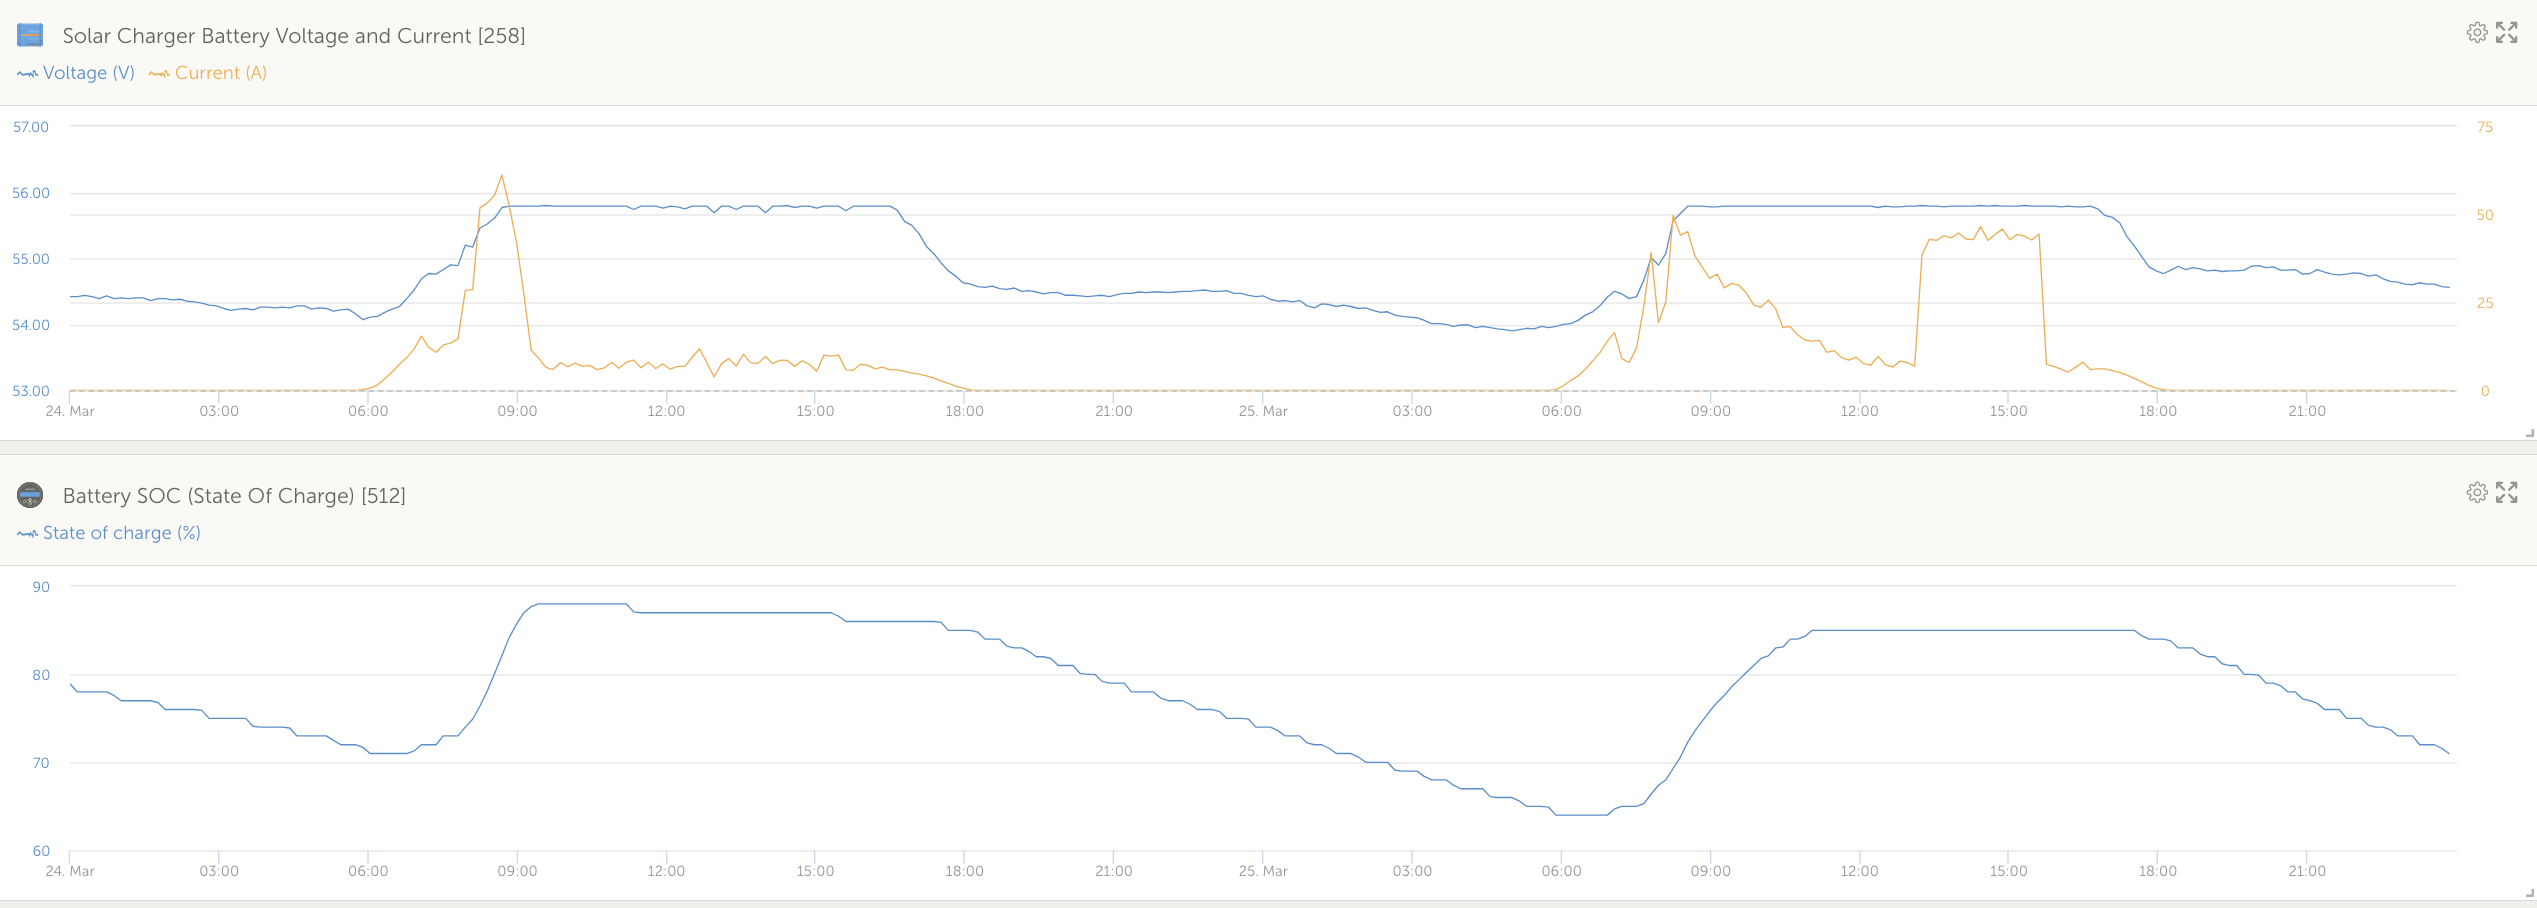
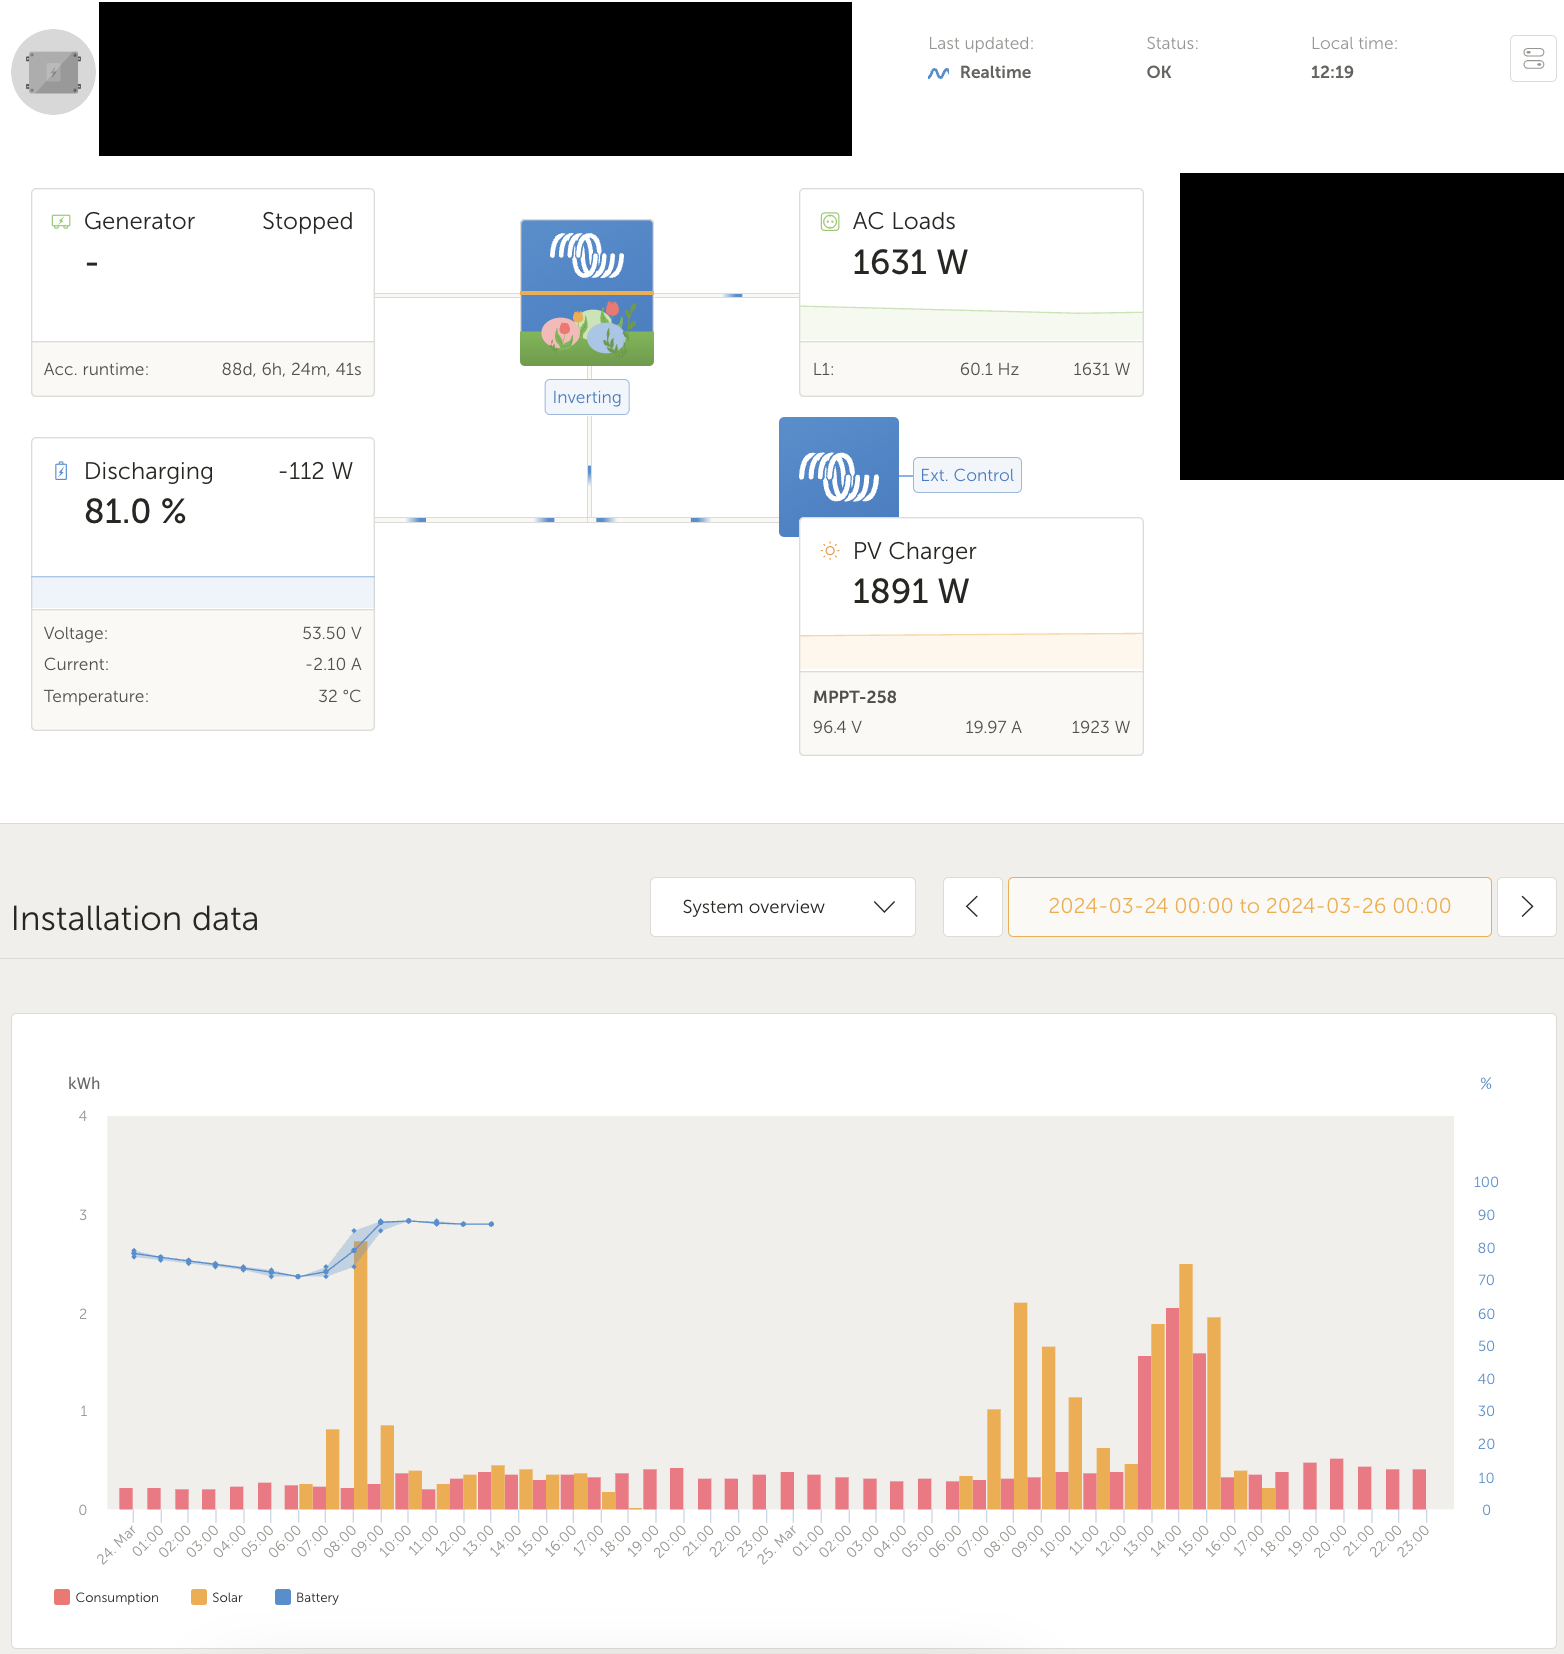
A couple of day ago, the SOC data stopped showing on my System Overview chart of my VRM dashboard. However, the SOC is still correctly displayed in all other places, including in my Advanced charts.

You can see in my screenshot the exact point where the SOC line on my System Overview stopped logging. I believe this coincided with a reboot of my CCGX device, but I hadn't changed any settings on the CCGX or in the VRM portal.

I've tried looking for any possible way to get the logging to resume on the chart, but I've had no luck so far. I've tried rebooting the CCGX again to see if that helped, but it did not.

Any ideas?
screenshot-2024-03-26-at-121940pm.png


screenshot-2024-03-26-at-122208pm.png

vrm logging
2 |3000

Up to 8 attachments (including images) can be used with a maximum of 190.8 MiB each and 286.6 MiB total.

5 Answers
nickdb avatar image
nickdb answered ·
When all else fails, pull the plug on the cerbo. Leave it off for a minute and then plug it in again.
1 comment
2 |3000

Up to 8 attachments (including images) can be used with a maximum of 190.8 MiB each and 286.6 MiB total.

jason-lane avatar image jason-lane commented ·
@nickdb I finally got physical access to the inverter (at my folks' holiday home) and I decided to try powering off the CCGX for a little while. After booting back up, the VRM data seems to be logging properly again. Thanks very much to you and @Guy Stewart (Victron Community Manager) for all your help :-)
0 Likes 0 ·
kevgermany avatar image
kevgermany answered ·
2 |3000

Up to 8 attachments (including images) can be used with a maximum of 190.8 MiB each and 286.6 MiB total.

jason-lane avatar image
jason-lane answered ·

@Guy Stewart (Victron Community Manager) Are you able to suggest anything else for me to try?

2 |3000

Up to 8 attachments (including images) can be used with a maximum of 190.8 MiB each and 286.6 MiB total.

Guy Stewart (Victron Community Manager) avatar image
Guy Stewart (Victron Community Manager) answered ·

Curly one, I'll ask the VRM team to have a look.

2 comments
2 |3000

Up to 8 attachments (including images) can be used with a maximum of 190.8 MiB each and 286.6 MiB total.

jason-lane avatar image jason-lane commented ·

Thank you! And I actually just noticed two things that I hadn't noticed before.

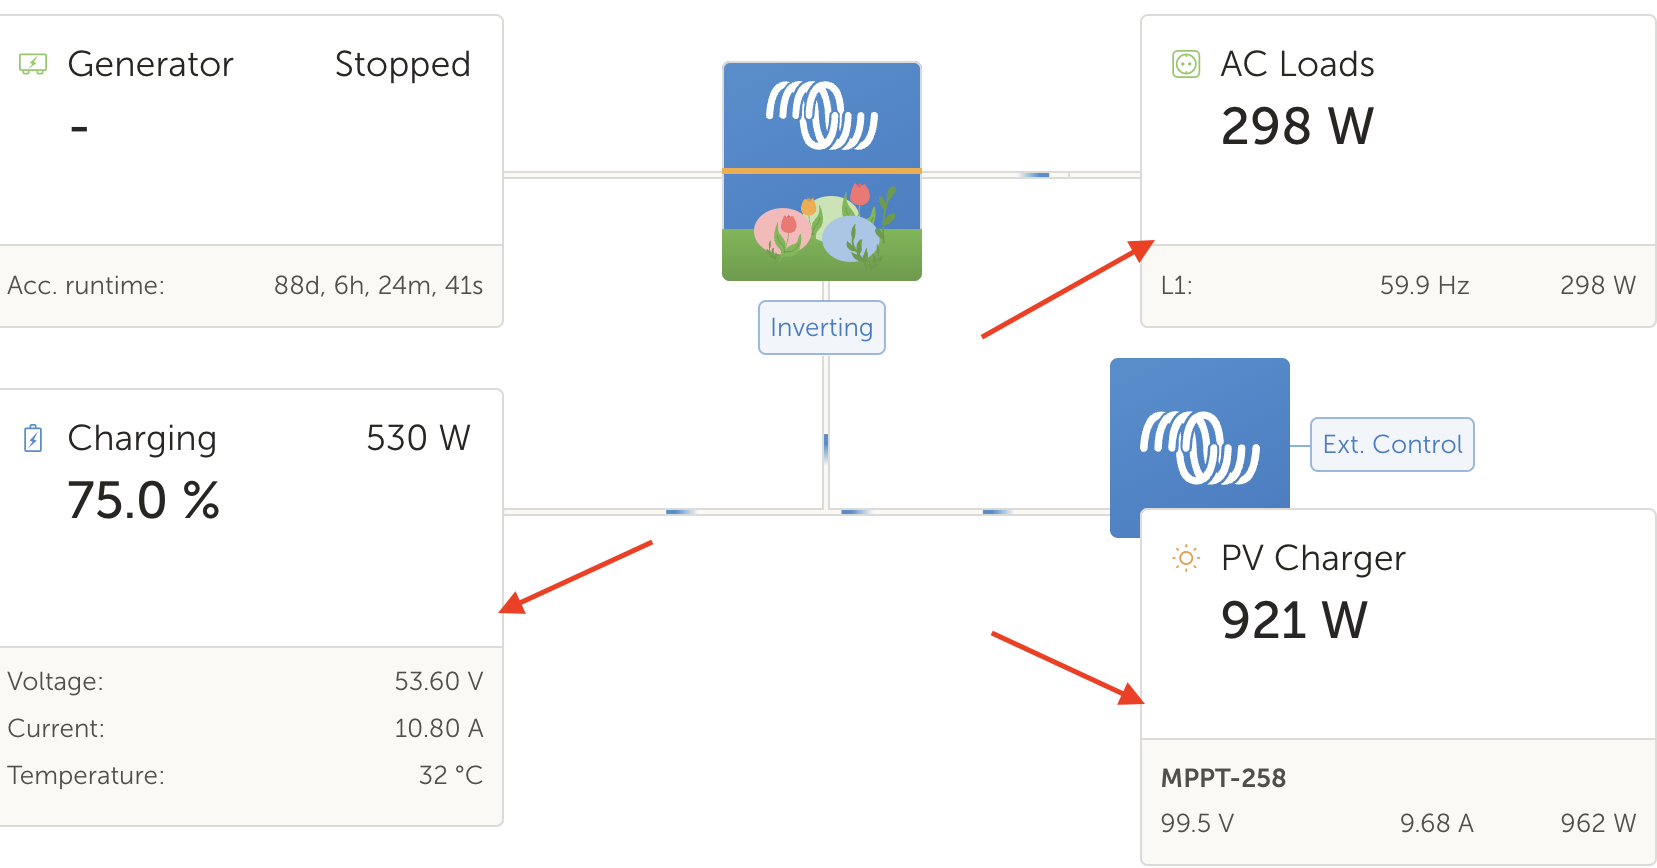
1. The little mini graphs that are normally shown at the bottom of the tiles are no longer showing.

screenshot-2024-03-28-at-101635am.png

2. If I back out to the "All Installations" page, the values shown here are no longer accurate, and they seem to correspond to the last values at the time the battery SOC line ends on my chart.

screenshot-2024-03-28-at-101939am.png

0 Likes 0 ·
nickdb avatar image nickdb ♦♦ jason-lane commented ·
Worth checking if the devices appear in the GX remote console device list and are updating. If not, there is a comms issue or a GX issue.

If they do appear, reboots don't help, then try disable VRM connectivity under settings VRM portal, then enable it again.

0 Likes 0 ·
Guy Stewart (Victron Community Manager) avatar image
Guy Stewart (Victron Community Manager) answered ·

Hi @Jason Lane and @nickdb,

The VRM team is looking into right now, including the little spark graphs.

Please make no changes to the system or attempt to troubleshoot yourself until further instructions from me so they have a clear picture.

6 comments
2 |3000

Up to 8 attachments (including images) can be used with a maximum of 190.8 MiB each and 286.6 MiB total.

jason-lane avatar image jason-lane commented ·

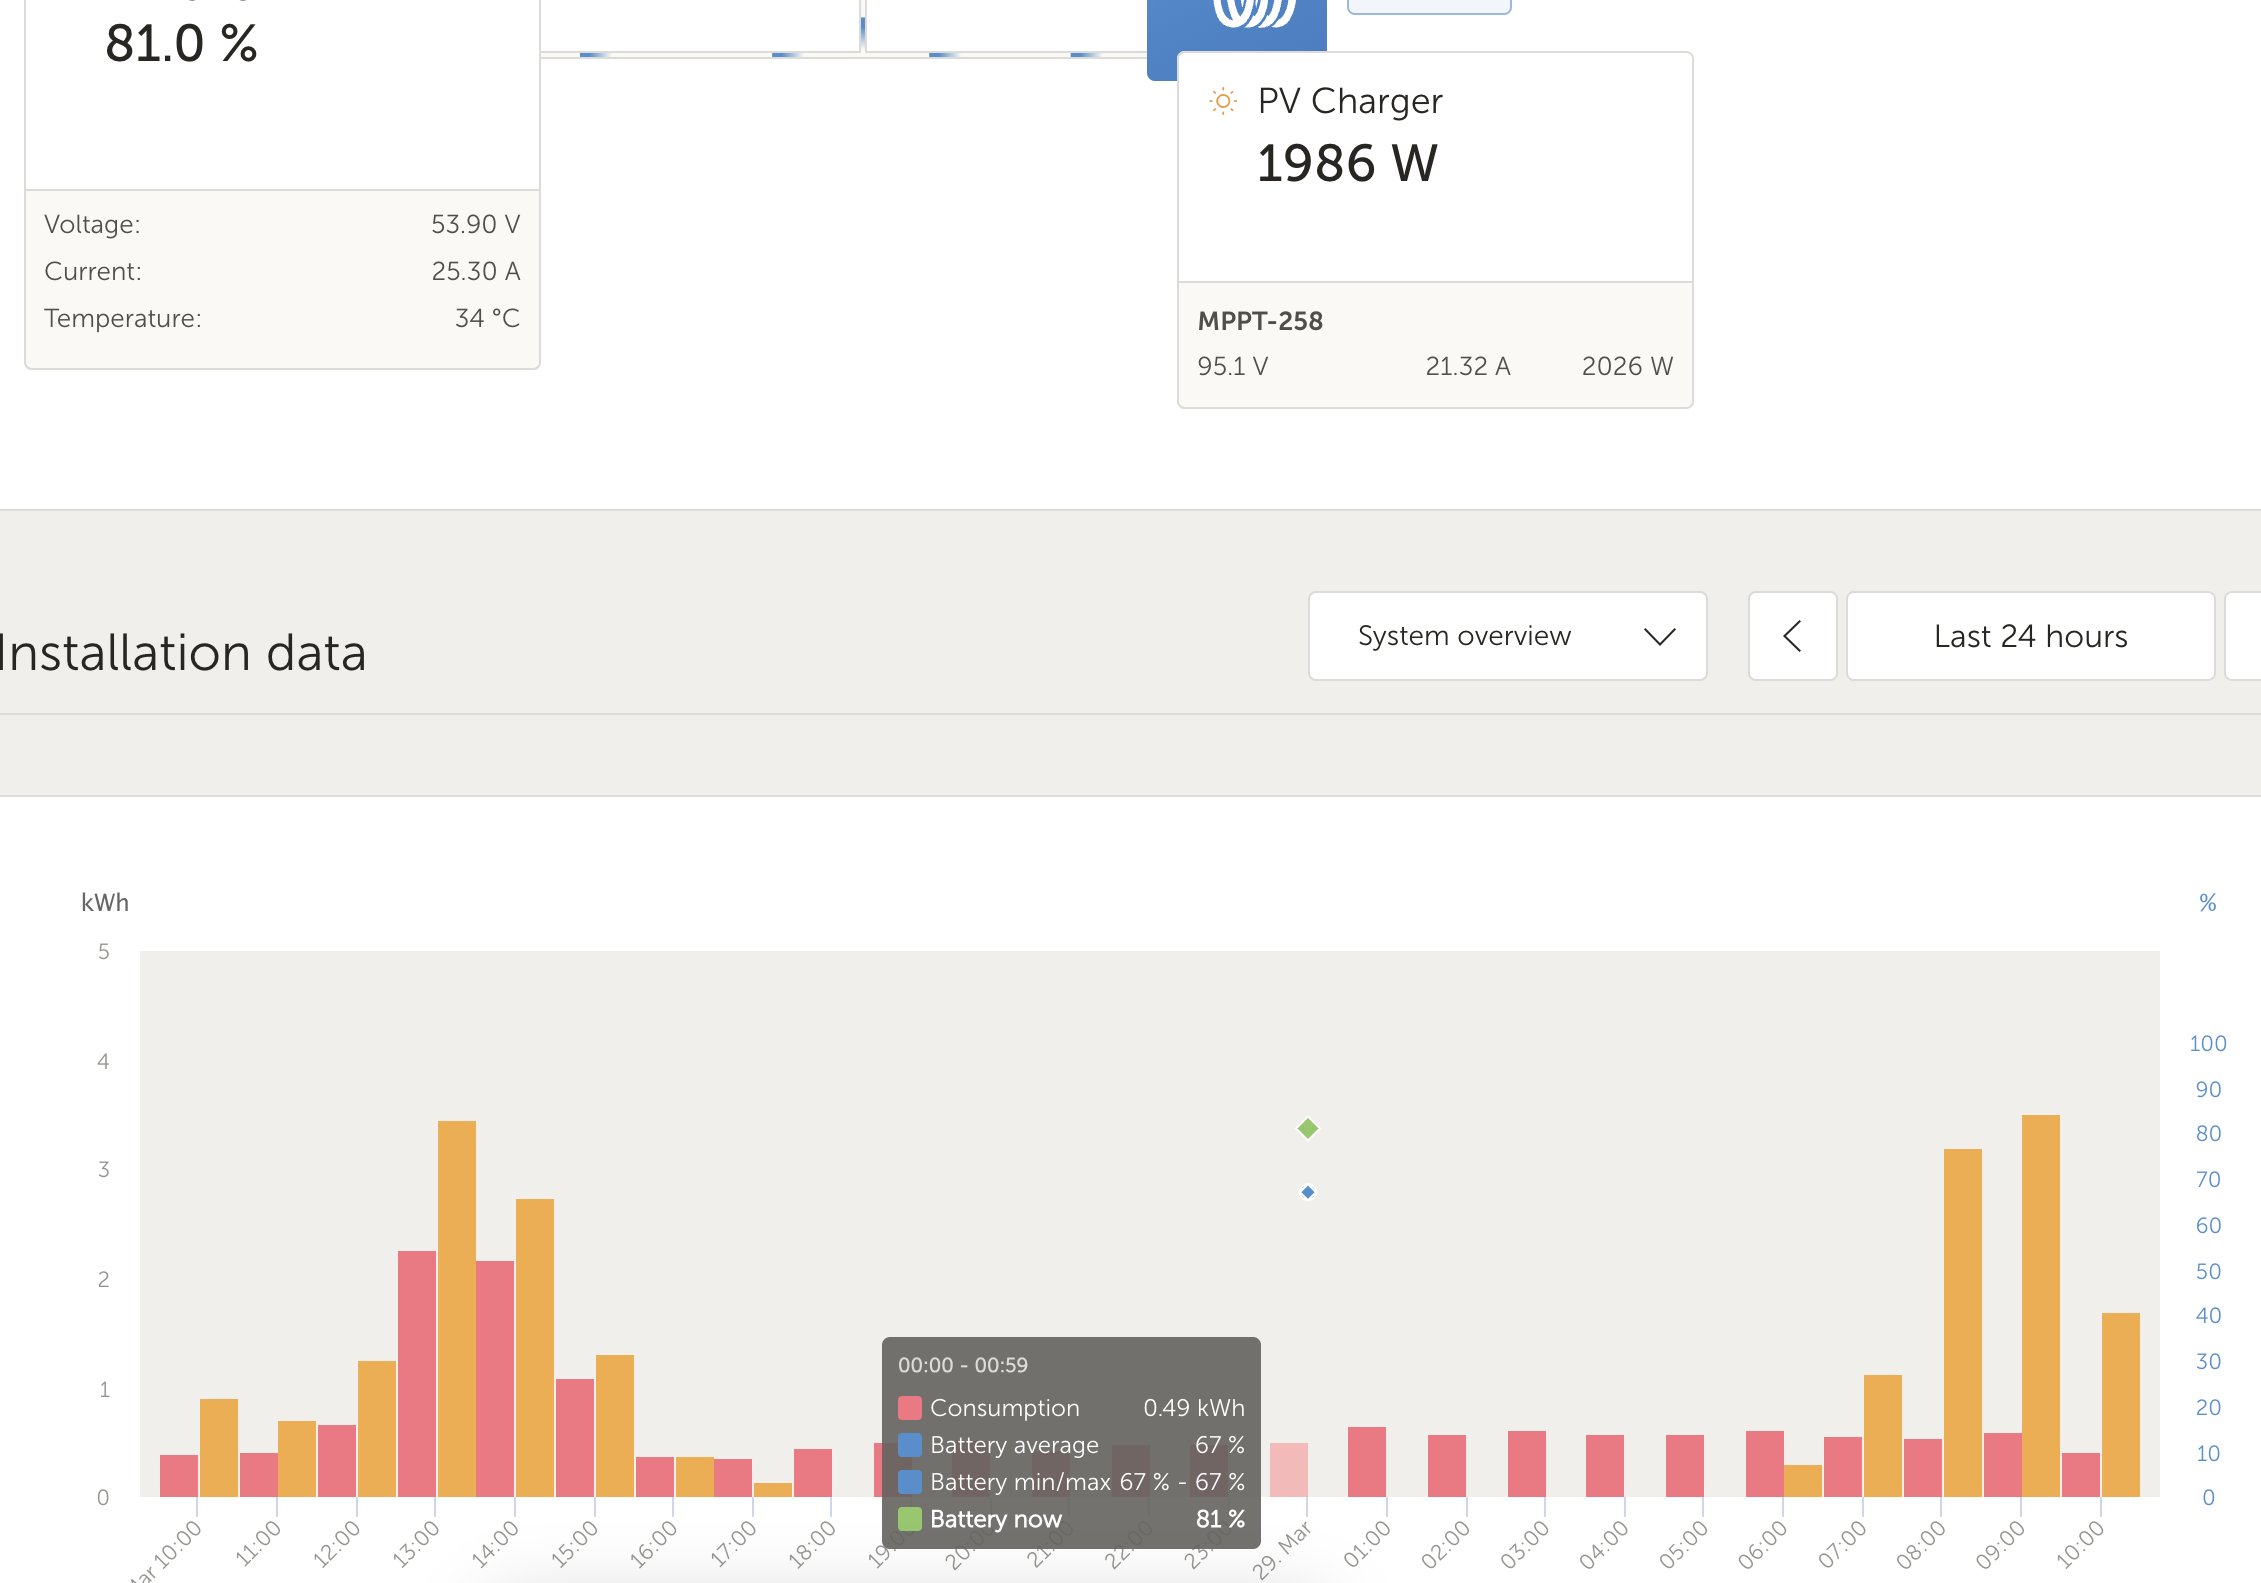
Hi Guy. OK, thank you for having it looked into. I will not touch anything else, but I actually already did try @nickdb's suggestion of disabling and re-enabling the VRM logging option last night (including another reboot of the CCGX). I briefly thought it had worked, as I got a green dot on the chart and then a blue dot, but after some time passed, I realised that the dot never continued to grow into a line, and remained as a dot in the chart. It seems that restarting the logging just created a new "stuck" point on my chart and on the Installations page. Interestingly, the green dot (Battery Now) does actually appear to move up and down the Y-axis and correctly indicate the current SOC, but it doesn't move along the X-axis (time). The blue dot (min/max) indicate the new "stuck" value shown on the Installations page, which was the SOC at the time I re-enabled logging. Very strange, indeed. See the new screenshot:

screenshot-2024-03-29-at-103703am.png

0 Likes 0 ·
Show more comments
jason-lane avatar image jason-lane commented ·
@Guy Stewart (Victron Community Manager) Would you mind asking the team who are looking into this to send me a message? There's something else I would like to ask them to take a look at while they're in there.
0 Likes 0 ·
Show more comments

Related Resources

Additional resources still need to be added for this topic