question

kevinc-63559 avatar image
kevinc-63559 asked

Grafana on Linux without docker?

I have Grafana up and running via Docker on a local web server, but would prefer to run the components native. Doing so would enable automatic software updates when the system is updated.

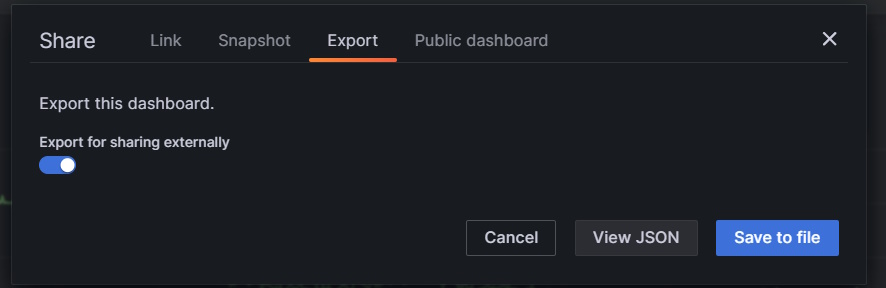
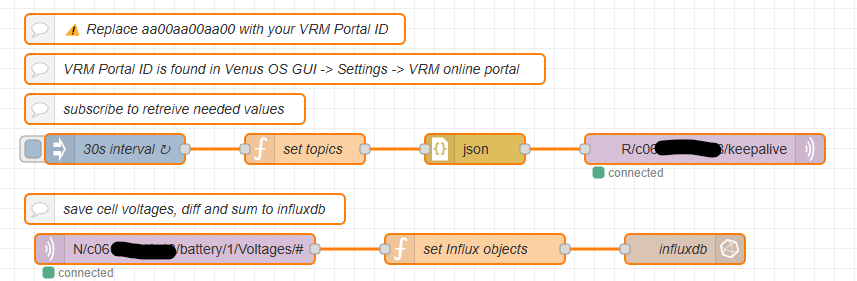
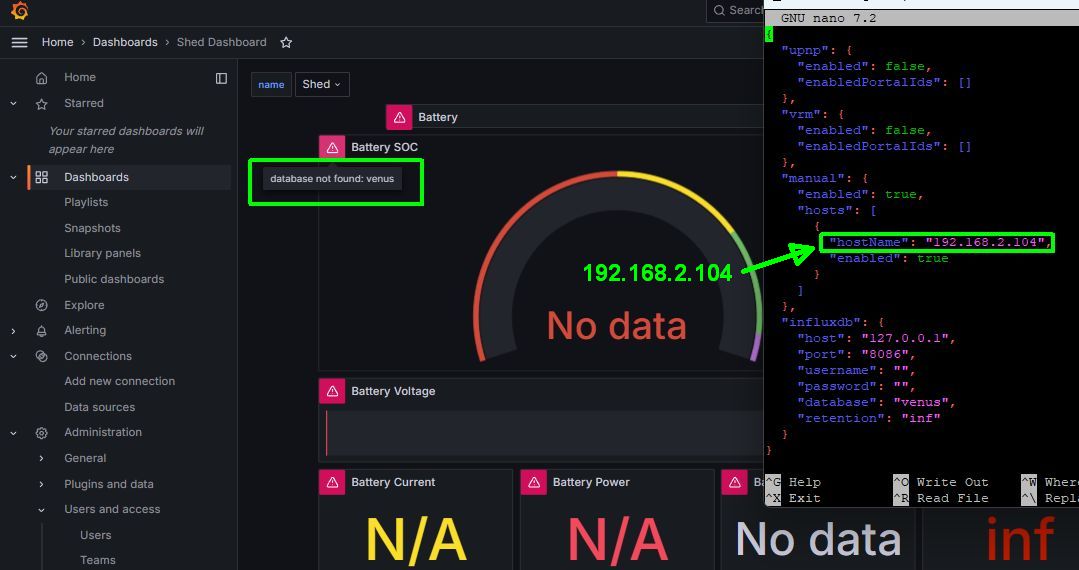
Obviously need Grafana installed, it is. Obviously need InfluxDB installed, it is. Easy enough to export my Grafana dashboard and import it to a new system. However I'm clueless how to link InfluxDB to my Cerbo to gather the statistics. Am I missing other parts? I see the (4) docker containers... Influx and Grafana are just two of those....

Anyone happen to have a walkthrough (or just hints) on doing this?

grafanalinux
2 |3000

Up to 8 attachments (including images) can be used with a maximum of 190.8 MiB each and 286.6 MiB total.

3 Answers
johnny-brusevold avatar image
johnny-brusevold answered ·

I made a note for how to run grafana and influxdb with venus influx loader on a pi5 with raspberry pi os. Works perfectly for me.


  1. influx grafana venus-influx-loader on pi5 Raspberry Pi OS with desktop 64 bit
  2. ----------------------------------------------------------------------------------------------------------------------------------------
  3.  
  4. install influx
  5.  
  6. sudo apt update
  7. sudo apt upgrade
  8.  
  9. curl https://repos.influxdata.com/influxdata-archive.key | gpg --dearmor | sudo tee /usr/share/keyrings/influxdb-archive-keyring.gpg >/dev/null
  10.  
  11. echo "deb [signed-by=/usr/share/keyrings/influxdb-archive-keyring.gpg] https://repos.influxdata.com/debian bullseye stable" | sudo tee /etc/apt/sources.list.d/influxdb.list
  12.  
  13. sudo apt update
  14. sudo apt install influxdb
  15.  
  16. sudo nano /etc/influxdb/influxdb.conf
  17. edit line 15
  18. # Bind address to use for the RPC service for backup and restore.
  19. # bind-address = "127.0.0.1:8088"
  20. bind-address = "127.0.0.1:8068"
  21.  
  22. save
  23.  
  24. sudo systemctl unmask influxdb
  25. sudo systemctl enable influxdb
  26. sudo systemctl start influxdb
  27.  
  28. --------------------------------------------------------------------------------
  29.  
  30. install grafana
  31.  
  32. curl https://apt.grafana.com/gpg.key | gpg --dearmor | sudo tee /usr/share/keyrings/grafana-archive-keyrings.gpg >/dev/null
  33.  
  34. echo "deb [signed-by=/usr/share/keyrings/grafana-archive-keyrings.gpg] https://apt.grafana.com stable main" | sudo tee /etc/apt/sources.list.d/grafana.list
  35.  
  36. sudo apt update
  37. sudo apt install grafana
  38. sudo systemctl enable grafana-server
  39. sudo systemctl start grafana-server
  40.  
  41. -------------------------------------------------------------------------
  42.  
  43. install npm
  44.  
  45. sudo apt install npm
  46.  
  47. sudo mkdir /etc/venus-influx-loader
  48. sudo mkdir /etc/venus-influx-loader/config
  49. sudo nano /etc/venus-influx-loader/config/config.json
  50.  
  51. add to config.jsom, change "hostName": " ip " to your other pi's ip, "change retention time to "inf")?"
  52. ------------------------------------------------------------------------
  53. {
  54. "upnp": {
  55. "enabled": false,
  56. "enabledPortalIds": []
  57. },
  58. "vrm": {
  59. "enabled": false,
  60. "enabledPortalIds": []
  61. },
  62. "manual": {
  63. "enabled": true,
  64. "hosts": [
  65. {
  66. "hostName": "192.168.1.101",
  67. "enabled": true
  68. }
  69. ]
  70. },
  71. "influxdb": {
  72. "host": "127.0.0.1",
  73. "port": "8086",
  74. "username": "",
  75. "password": "",
  76. "database": "venus",
  77. "retention": "30d"
  78. }
  79. }
  80. --------------------------------------------------------
  81.  
  82. cd /usr/lib/
  83. sudo git clone https://github.com/victronenergy/venus-influx-loader.git
  84. cd venus-influx-loader
  85. sudo npm install
  86.  
  87. ----------------------------------------------------------
  88.  
  89. sudo nano /lib/systemd/system/influx-loader.service
  90.  
  91. add to file
  92. ----------------------------------------------------------
  93. [Unit]
  94. Description=influx loader Service
  95. After=multi-user.target
  96.  
  97. [Service]
  98. Type=idle
  99. ExecStart=/usr/lib/venus-influx-loader/bin/venus-influx-loader.js --disable-admin-api --disable-grafana-api -c /etc/venus-influx-loader/config
  100.  
  101. [Install]
  102. WantedBy=multi-user.target
  103. ------------------------------------------------------------
  104. save and exit
  105. sudo chmod 644 /lib/systemd/system/influx-loader.service
  106. sudo systemctl daemon-reload
  107. sudo systemctl enable influx-loader.service
  108.  
  109. "enable MQTT on your venusOS pi"
  110.  
  111. sudo reboot
  112.  
  113. runing on port 3000
  114. db venus
  115. import your venus-grafana favorit dashboard
8 comments
2 |3000

Up to 8 attachments (including images) can be used with a maximum of 190.8 MiB each and 286.6 MiB total.

northtown2022 avatar image northtown2022 commented ·

@Johnny Brusevold I followed your directions and got everything installed on a Pi5. Thank you!

I did get some type of permission error trying to save the edited config.json but after searching it up found that adding 'sudo' before the command allowed it to work:

sudo nano /etc/venus-influx-loader/config/config.json


After everything was installed I imported a dashboard I'm currently running on a Pi4.

I also added Infulxdb as my data source in Grafana and edited in my credentials etc..


I am getting this error in my Grafana dashboard:

Datasource c0c900db-5de0-4efc-b633-5a3f4782db42 was not found

Any ideas?

0 Likes 0 ·
johnny-brusevold avatar image johnny-brusevold northtown2022 commented ·

@NorthTown2022

Check your data source, with me it is set to venus, and data from venus_default

ikke-navngitt.jpg


Edit

Something I figured out on the fly, I had some problems with id, which was solved by selecting 'export for sharing externaly' under export


ikke-navngitt2.jpg


added sudo to the note

1 Like 1 ·
ikke-navngitt.jpg (184.5 KiB)
ikke-navngitt2.jpg (30.1 KiB)
northtown2022 avatar image northtown2022 commented ·

My limited understanding of Node-RED, Influx and Grafana has me stuck.

I'm trying to use my existing flow and influxdb data source but it's just not happening. This is the flow I'm currently using with the Pi4 and trying to use with the Pi5.node-red-flow.png

I don't have npm installed on Pi4. Is it used in place of Node-Red on Pi5?


0 Likes 0 ·
node-red-flow.png (36.9 KiB)
johnny-brusevold avatar image johnny-brusevold northtown2022 commented ·

@NorthTown2022

venus-influx-loader is the program that sets up the database in influx, and listens for the mqtt data stream that is sent from a venus device on port 8086 and forwards it to the database in influxdb


npm is the library used by venus-influx-loader


If you are not going to use venus-influx-loader, you must create the database manually.

1 Like 1 ·
northtown2022 avatar image northtown2022 johnny-brusevold commented ·

@Johnny Brusevold

I'm not planning to make things work differently, that's way beyond my scope! :) I thought I needed to use Node-RED as well but I'm pretty sure I've come to the conclusion that Venus OS Large is NOT needed here (unlike my other installation).

MQTT is enabled in the remote console of the Cerbo GX (192.168.2.104)

I've set the bind-address = "127.0.0.1:8068"

I set hostName = 192.168.2.104

I've imported several dashboards and keep getting the error 'database not found: venus' on all of them.

1710638982390.jpeg

Database is renamed to "venus". What am I missing here?1710638795412.jpeg

0 Likes 0 ·
1710638982390.jpeg (67.5 KiB)
johnny-brusevold avatar image johnny-brusevold northtown2022 commented ·

@NorthTown2022

I can't see all your settings from your screenshot,

but you need to enable 'Basic auth'


2024-03-17-1.png

2024-03-17-3.png


-1 Like -1 ·
2024-03-17-1.png (153.1 KiB)
2024-03-17-3.png (155.8 KiB)
Show more comments
northtown2022 avatar image
northtown2022 answered ·

@Johnny Brusevold

Success! I can see measurements now.

1710706892717.png


1710706892717.png (10.7 KiB)
2 |3000

Up to 8 attachments (including images) can be used with a maximum of 190.8 MiB each and 286.6 MiB total.

johnny-brusevold avatar image
johnny-brusevold answered ·

@KevinC_63559

It derailed a bit from what kevinc was asking, since I didn't have the answer.

But looked through a bit, and there wasn't much difference from pi5 to ubuntu/deb

The guide below has been tested on linux Ubuntu 22.04 lts and works flawlessly. I hope I haven't made any typos this time.


and you cannot use influxdb2


  1. influx grafana venus-influx-loader on Linux Ubuntu 22.04 64 bit
  2. ----------------------------------------------------------------------------------------------------------------------------------------
  3.  
  4. install influx
  5.  
  6. sudo apt update
  7. sudo apt upgrade
  8.  
  9. curl -fsSL https://repos.influxdata.com/influxdata-archive_compat.key|sudo gpg --dearmor -o /etc/apt/trusted.gpg.d/influxdata.gpg
  10.  
  11. echo 'deb [signed-by=/etc/apt/trusted.gpg.d/influxdata.gpg] https://repos.influxdata.com/debian stable main' | sudo tee /etc/apt/sources.list.d/influxdata.list
  12.  
  13. sudo apt update && sudo apt install influxdb
  14.  
  15.  
  16. sudo nano /etc/influxdb/influxdb.conf
  17. edit line 15
  18. # Bind address to use for the RPC service for backup and restore.
  19. # bind-address = "127.0.0.1:8088"
  20. bind-address = "127.0.0.1:8068"
  21.  
  22. save
  23.  
  24. sudo systemctl enable --now influxdb
  25.  
  26. -------------------------------------------------------------------------------
  27. note
  28.  
  29. TCP port 8068 is used for the RPC service for backup and restor
  30.  
  31. --------------------------------------------------------------------------------
  32.  
  33. install grafana
  34.  
  35. sudo mkdir -p /etc/apt/keyrings/
  36. wget -q -O - https://apt.grafana.com/gpg.key | gpg --dearmor | sudo tee /etc/apt/keyrings/grafana.gpg > /dev/null
  37.  
  38. echo "deb [signed-by=/etc/apt/keyrings/grafana.gpg] https://apt.grafana.com stable main" | sudo tee -a /etc/apt/sources.list.d/grafana.list
  39.  
  40. sudo apt update
  41. sudo apt install grafana
  42. sudo systemctl daemon-reload
  43. sudo systemctl start grafana-server
  44. sudo systemctl enable grafana-server.service
  45.  
  46. -------------------------------------------------------------------------
  47. note
  48. Default ubuntu 22.04 nodejs is to old for venus-influx-loader
  49. Either you have to upgrade your existing node-js or uninstall it to install this upgraded one, or change version with nvm
  50.  
  51. The version below (20.x) has nvm built in
  52. --------------------------------------------------
  53.  
  54. install node-js
  55.  
  56. cd ~
  57. curl -sL https://deb.nodesource.com/setup_20.x -o nodesource_setup.sh
  58. sudo bash nodesource_setup.sh
  59. sudo apt install nodejs
  60. node -v
  61.  
  62. sudo mkdir /etc/venus-influx-loader
  63. sudo mkdir /etc/venus-influx-loader/config
  64. nano /etc/venus-influx-loader/config/config.json
  65.  
  66. add to config.jsom, change "hostName": " ip " to your other pi/venus device ip, "change retention time to "xxd" for numer of days or "inf" forever)?"
  67. ------------------------------------------------------------------------
  68. {
  69. "upnp": {
  70. "enabled": false,
  71. "enabledPortalIds": []
  72. },
  73. "vrm": {
  74. "enabled": false,
  75. "enabledPortalIds": []
  76. },
  77. "manual": {
  78. "enabled": true,
  79. "hosts": [
  80. {
  81. "hostName": "192.168.1.101",
  82. "enabled": true
  83. }
  84. ]
  85. },
  86. "influxdb": {
  87. "host": "127.0.0.1",
  88. "port": "8086",
  89. "username": "",
  90. "password": "",
  91. "database": "venus",
  92. "retention": "30d"
  93. }
  94. }
  95. --------------------------------------------------------
  96.  
  97. cd /usr/lib/
  98. sudo git clone https://github.com/victronenergy/venus-influx-loader.git
  99. cd venus-influx-loader
  100. sudo npm install
  101. sudo npm install -g npm@10.5.0
  102.  
  103. ----------------------------------------------------------
  104.  
  105. sudo nano /lib/systemd/system/influx-loader.service
  106.  
  107. add to file
  108. ----------------------------------------------------------
  109. [Unit]
  110. Description=influx loader Service
  111. After=multi-user.target
  112.  
  113. [Service]
  114. Type=idle
  115. ExecStart=/usr/lib/venus-influx-loader/bin/venus-influx-loader.js --disable-admin-api --disable-grafana-api -c /etc/venus-influx-oader/config
  116.  
  117. [Install]
  118. WantedBy=multi-user.target
  119.  
  120. ------------------------------------------------------------
  121. save and exit
  122. sudo chmod 644 /lib/systemd/system/influx-loader.service
  123. sudo systemctl daemon-reload
  124. sudo systemctl enable influx-loader.service
  125.  
  126. "enable MQTT on your venusOS pi"
  127.  
  128. sudo reboot
  129.  
  130. runing on port 3000
  131. db venus
  132. URL http://localhost:8086 (this is grayed out, so you have to fill in)
  133. enable 'Basic auth'
  134.  
  135. import your venus-grafana favorit dashboard
2 |3000

Up to 8 attachments (including images) can be used with a maximum of 190.8 MiB each and 286.6 MiB total.