question

Matt Knight avatar image
Matt Knight asked

Change MPPT Tracking Refresh Interval

We collect data from our Victron system and store it for analysis. Here you can see the power generation curve from our rooftop solar panels, connected to a Victron 100/50 solar charge controller.
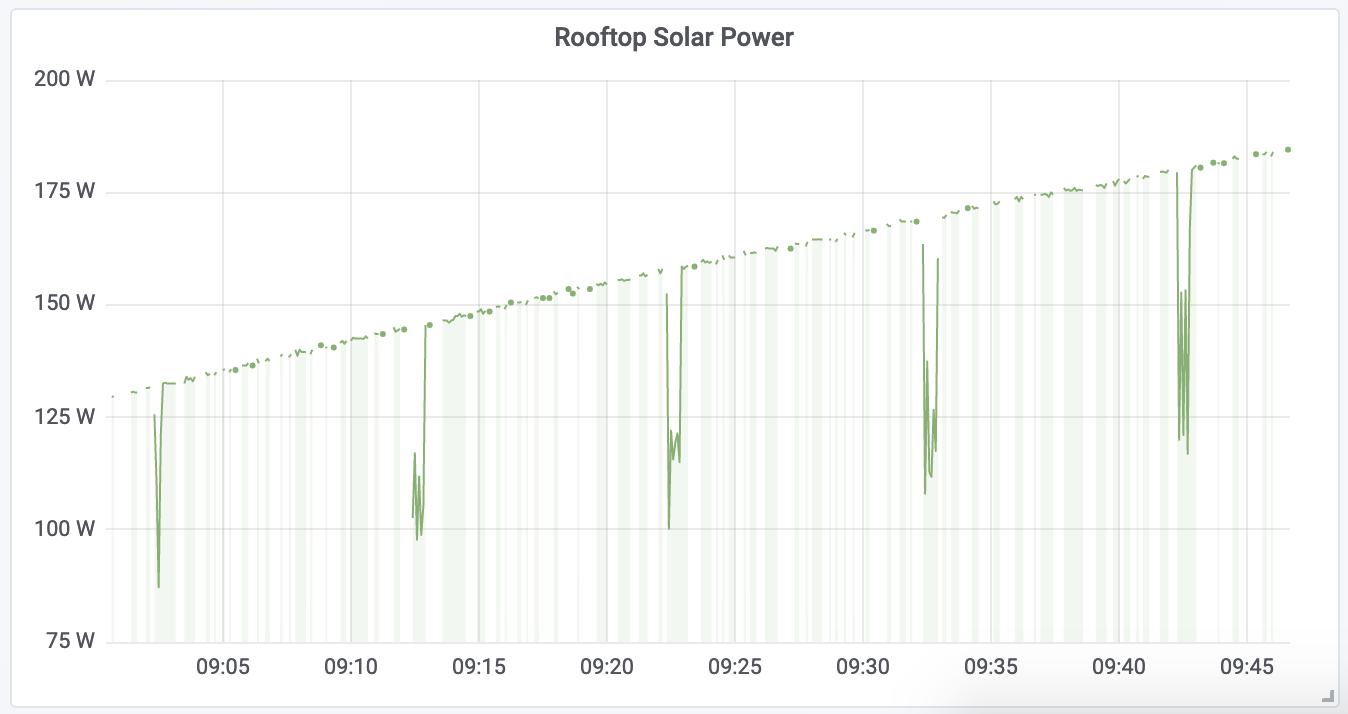

As you can see, every 10 minutes, the power drops off dramatically. I'm guessing this is the solar charge controller sweeping to find the Maximum Power Point.

Each of these "sweeps" takes ~33 seconds to complete, and during this time, power production decreases dramatically - the middle drop on the chart above is ~158W to ~120W average or so (about a 25% decrease). Power production after the sweep appears almost completely unchanged - looking at the PV input voltage, it reduced by ~0.18V (from 34.50V to 34.32V).

Treating this as a duty cycle and averaging over time, a 25% drop for 33 seconds every 10 minutes corresponds to roughly a 1.4% total drop in output.

Questions:

  1. Am I understanding the purpose of these drops correctly?
  2. Would the MPPT adjustment provide >1.4% improvement to output during the next 10 minutes?
  3. Is it possible / does it make sense to make the interval between these event adjustable - i.e. a user setting to change it?

Thanks,

Matt

MPPT ControllersSolar Panel
2 |3000

Up to 8 attachments (including images) can be used with a maximum of 190.8 MiB each and 286.6 MiB total.

8 Answers
Guy Stewart (Victron Community Manager) avatar image
Guy Stewart (Victron Community Manager) answered ·

1. I can't say for sure, but that seems like a pretty reasonable explanation.

2. This is impossible to say either way. On clear, sunny day conditions, then the loss during the sweep will probably be larger than the gain in finding the new MPPT but that is usually when you need it the least. In variable weather conditions, the gain from finding the new MPPT will probably be larger than the cost of the sweep, and that is when you need it the most.

3. This is not currently possible for an end user to change. Sorry to say It is extremely unlikely that the firmware and software development time would be taken to make this into a user facing feature.


Now questions for you, how fast is your sample rate on that data? And what did you use to capture it?

1 comment
2 |3000

Up to 8 attachments (including images) can be used with a maximum of 190.8 MiB each and 286.6 MiB total.

Matt Knight avatar image Matt Knight commented ·

Thanks, @Guy! I figured it may the case that this was something of a micro-optimization and therefore unlikely to get prioritized. Just to double check though, there's no way to change this at all - even via the low-level HEX protocol for example?


As for your questions about our data capture, I'll try and summarize. We have a Victron CCGX with the MQTT broker enabled. We have a server machine running 24/7 which subscribes to the wildcard topic on the broker. It parses and records every message in an InfluxDB database which in turn is exposed via a Grafana dashboard (which is where the screenshot above is from). I'm using Node-RED to orchestrate that control logic.


Since the reporting frequency via MQTT can vary quite significantly, the server also publishes a R/ request on several key topics (e.g. battery voltage, current, etc) every 5s to ensure we have sufficient resolution. We're not doing that on the solar data yet, but I'll likely add that in very soon.


We were having some stability issues with MQTT so at some point I may bypass MQTT altogether and directly interface via the dbus. I've written a proof-of-concept but since then MQTT has remained stable.


Let me know if you have more questions - happy to share what we have.

0 Likes 0 ·
markus avatar image
markus answered ·

Hi @Matt Knight,

"happy to share what we have"

Yes. This sounds very interesting. It would be great, if you write an article in the new "mods space"

launching-the-mods-space-a-new-section-on-communit.html

I am sure it would be interesting to many, if you could give a little bit of advise how to set this up.

Best Regards,

Markus

1 comment
2 |3000

Up to 8 attachments (including images) can be used with a maximum of 190.8 MiB each and 286.6 MiB total.

Matt Knight avatar image Matt Knight commented ·

Sounds good, will do!

1 Like 1 ·
sean avatar image
sean answered ·

I find it somewhat implausible that the MPPT sweep frequency is once every 10 minutes, and that 33 seconds is the period of time required to recalculate the new maximum power point.

Surely this isnt correct ?

15 comments
2 |3000

Up to 8 attachments (including images) can be used with a maximum of 190.8 MiB each and 286.6 MiB total.

markus avatar image markus ♦♦ commented ·

I have connected one of my MPPTs to a hydro turbine, so I can listen and watch the MPPT algorithm ;o) I can also not confirm 33s sweeps.

But the readout is very interesting, maybe we get behind what those sweeps are about.

0 Likes 0 ·
Matt Knight avatar image Matt Knight markus ♦♦ commented ·

Interesting. I'd be happy to collect other data / statistics if that would help us identify what this is. Per my original post, the voltage does change before and after those events every 10 minutes, so I can't think what else it would be. I'm certainly no expert in this topic, but the frequency and duration were in the ballpark of what I expected them to be.


@Sean / @Markus from your data collection, what sweep frequency / duration do you observe?

0 Likes 0 ·
markus avatar image markus ♦♦ Matt Knight commented ·

I am monitoring my installation via VRM, therefore I do not have such a high res. data collection.

But from my observations with my hydro turbine, the MPP tracker works MUCH faster than that and without noticeable sweeps:

When I have constant water flow and consumption, the turbine RPM is very stable without any noticeable changes. (I have to be near, so lets say 30 min. observation time)

When I activate a load, the MPPT pulls down the Voltage (turbine rpm falls) and Amps and Power raises. When the load stops, the turbine RPM changes back. This happens in 1 or 2 seconds.

When I have constant consumption and open the valve for more water flow, the RPM raises and is stable again within 1 or 2 seconds.

When I do not need much power, I close the valve by hand to lower the RPM, to save the bearings of the turbine. When I have heavier loads, I open the valve up again. I want to develop some valve control mechanism for that, but the manual control is much less effort than I thought and therefore the priority got lower, but one day I will have that.

The only thing bad, that can happen is when the load is too high and the MPPT pulls down the RPM below some point, then the turbine wheel gets "restrained". The MPPT gives not enough time in this situation to let the RPM raise above that point again. Obviously a solar panel gains Voltage much faster than a hydro turbine. I have to switch off some load or open the valve manually. But this is also not a big problem to me and it only occurs in my setup, when the valve is not fully open...

I hope you can take out something useful from my "bla bla" additionally I have that (too short) video: Valve open by 40%; 100W continuous consumption and 150W house water pump engaging several times.

I am going to make a longer and better video from the turbine under various conditions in summer when it's warmer and I am there more often.

0 Likes 0 ·
ripper avatar image ripper commented ·

I can confirm every 10 minutes and it goes on " forever" ( never counted it, will do now) which is frustrating to see after a while. My logging is once every minute and it gets the low spikes pretty much all of them. Looking at the BMV which has much faster refresh cycles, it goes up and down on the watts multiple times when you would thinks twice should do the trick. I also record the solar panel voltage and there one can see when it finds a better spot. That is when most panels are in the shadows and one is completely not I think. Usually its sitting at 60 Volts, then it drops down to 30V.

0 Likes 0 ·
ripper avatar image ripper ripper commented ·

And the sweeps are only (mostly?) in bulk mode. I have severely overlayed my little 100/20 with 2kWp. Maybe therefor it has always enough for Abs and Float

0 Likes 0 ·
ben avatar image ben ♦ commented ·

I can also confirm ~30sec every 10 minutes. The power is still pretty good within a lot of those 30 seconds, so it appears roughly to "cost" about 2% of produced energy when conditions are stable.

0 Likes 0 ·
markus avatar image markus ♦♦ ben ♦ commented ·

This is quite interesting. Maybe in my case those sweeps are not noticeable on the hydro wheel because the Power Point is far more stable than on a solar panel (in partial shading). ...just thinking.

But I didn't saw this behavior on my solar panels either. But this could also be the reason I didn't watch it close enough...

But what I can tell from my observations, that it takes only seconds for the MPPT to find it's maximum power point on a hydro turbine. And in situations it "restrains" the wheel (as described above) the MPPT gives not enough time for the wheel to raise RPM again. This situation can last for hours. If those sweeps were that long, the wheel would have enough time to raise again.

Regards,

Markus

0 Likes 0 ·
ben avatar image ben ♦ markus ♦♦ commented ·

It kind of looks like it achieves 3 sweeps in 30 seconds, and then it goes right back to the previous V, when the sun is stable I mean. I only have 1.0 second resolution, but here's an example from today:


0 Likes 0 ·
Matt Knight avatar image Matt Knight ben ♦ commented ·

That's really interesting! I'll try increasing the resolution of our data capture to see if we observe the same.

Can any Victron staff comment on this? Seems like they would be able to confirm these observations.

0 Likes 0 ·
Matt Knight avatar image Matt Knight Matt Knight commented ·

As a follow-up, I tried increasing the polling frequency to 1s for those metrics but the CCGX was unstable and dropped off the network. @ben what protocol are you using to capture reliably at 1s intervals?

0 Likes 0 ·
ben avatar image ben ♦ Matt Knight commented ·

I'm using the built in MQTT server, waking it up with a client and then letting its native updates coming from Venus OS stream to my database. Let me know if gobbledegook makes any sense...

0 Likes 0 ·
Matt Knight avatar image Matt Knight ben ♦ commented ·

Ah, OK, so you're just accepting the updates from the MQTT broker at whatever frequency they happen. So you have 1 second resolution as that's the limit of your database? By my observations, the actual messages on the MQTT broker are not consistently 1/second, but it varies a little. Particularly for some of the battery metrics, it is prompted more by change in value than anything else - that's why I'm forcibly polling a number of key topics (by issuing a publish on "R/<serial>/<metric>") in addition to passively listening.

0 Likes 0 ·
ben avatar image ben ♦ Matt Knight commented ·

Yes, I’m accepting the updates at whatever frequency they come in.

I’m surprised you find that polling specific values makes a difference. My understanding is that every time the dbus-to-mqtt bridge refreshes against dbus, it publishes any changed values to mqtt on the appropriate topics. And mqtt should guarantee you get all of those updates if you are subscribed.

So while some dbus values could be changing faster than 1Hz or whatever it is, I didn’t think anyone looking at things from the mqtt side should be able to poll and “outpace” the rate at which the bridge is writing those values. You’re already getting all the values it cares to publish, in other words?

Well, that’s what I thought. Now you’ve got me interested in going and looking at the code.

0 Likes 0 ·
Matt Knight avatar image Matt Knight ben ♦ commented ·

Huh, I hadn't thought about it that way before, but it makes sense!

I originally introduced the polling because I noticed that the broker was not publishing updates as fast as I wanted on some metrics. Once the battery got to 100% SoC, there would be no further pushes until it changed, but I seem to recall some of the other metrics weren't updating as fast as I wanted. I'm pretty sure I'm getting more resolution by polling (i.e. the values have changed). Let me know what you find though!

0 Likes 0 ·
ben avatar image ben ♦ Matt Knight commented ·

I went and looked at the python code that provides the bridge from dbus to mqtt. It’s event-based, so I believe that means it will receive every change on all the dbus values. And it just turns around and republishes all of those on mqtt.

So the granularity of the data, then, should be the same as the rate at which the various dbus “drivers” read the vebus/can/whatever data from the hardware and write it onto the bus.

The drivers themselves probably have varying rates.

I also share your observation that messages “get slow” or simply nonexistent when there is little or no change. But that doesn’t mean you’ve lost any granularity: by polling it, you should just be getting the same value repeated back to you.

Please let me know if you have some fields on which you specifically observe finer resolution when you poll. I don’t think that’s possible, but if it is then it will prompt me to re-examine my understanding of the system. :)

p.s. For the fastest-moving values, I think the dbus drivers are writing new values at roughly 1Hz. I will look later today at dbus-spy and see if I can find any that are moving faster than that, but my casual recollection is that that’s the rate limit.

1 Like 1 ·
markus avatar image
markus answered ·

It seems that this behavior is spotted by more and more people.

spotty-drops-in-solar-generation.html

I had a chance, to have a close view on my solar setup this weekend. I don't have those sweeps...

But I have to mention, my solar charger is pretty oversized for my installation and it is only utilized by half of its load capacity at maximum yield.

Best Regards,

Markus

2 comments
2 |3000

Up to 8 attachments (including images) can be used with a maximum of 190.8 MiB each and 286.6 MiB total.

stepir avatar image stepir commented ·

Unfortunately VRM portal is not reporting anymore data from the last summer - I don't recall to have never seen those sweeps before this winter. I thought this was due to the new setup of my strings (moved from a single series of 10 panels to two series of 5 in parallel). Now could it be that this is due to a firmware or software change being done in this period of time (august 2018)?

My MPPT is well oversized as well, I have a 150/100 being used with roughly 1kwp.


0 Likes 0 ·
Matt Knight avatar image Matt Knight commented ·

@Markus are you observing with VRM or your own monitoring? VRM only logs every minute so it may well miss those sweeps. Also, our own charger is oversized too - a 100/50 with 400W of solar panels connected.

0 Likes 0 ·
rainerb avatar image
rainerb answered ·

Hello,

I can also see these "spikes" with my MPPT100-50 (every 10 minutes) and I have a direct comparison to my Fronius Galvo AC inverter.

My two PV arrays are directly next to each other on the same roof and same direction.


In my opinion these mppt spikes really annoys the ESS regulation. The sudden loss of mppt pv power often switches the inverter from charging to discharging and a few seconds later it feeds battery power to the grid until the ESS regulation is up to date again.


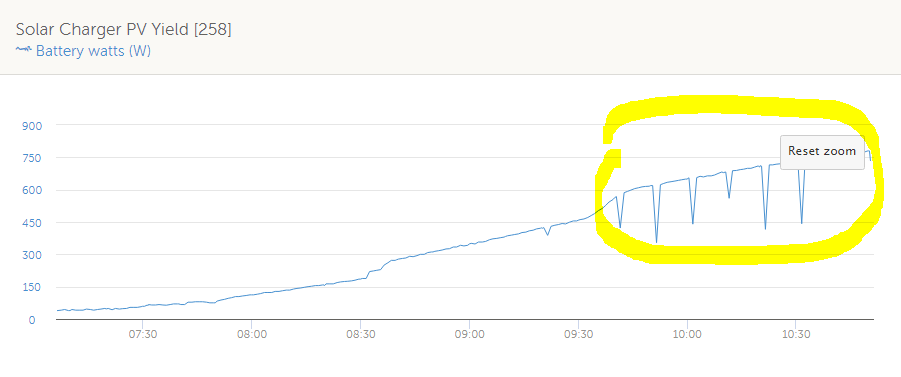
MPPT100-50 with spikes


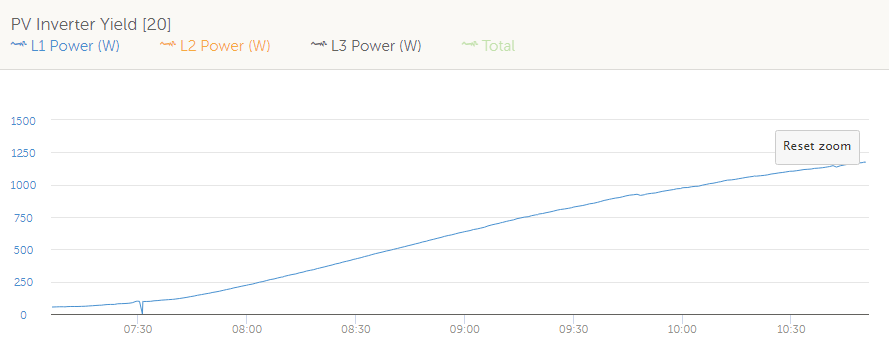
Fronius Galvo with a smooth production (same date and time)

Best regards

Rainer


mppt100-50.png (18.8 KiB)
froniusgalvo.png (15.4 KiB)
2 |3000

Up to 8 attachments (including images) can be used with a maximum of 190.8 MiB each and 286.6 MiB total.

custom avatar image
custom answered ·

Hello,

is there anything new on this issue?

I have also noticed the voltage drop every 10 minutes during a Bluebird day while my MPPT 75/10 is in bulk mode. I read the data directly from the VE.direct port.

Will this behaviour improved in future firmware versions?

Thanks!

2 comments
2 |3000

Up to 8 attachments (including images) can be used with a maximum of 190.8 MiB each and 286.6 MiB total.

maggi80 avatar image maggi80 commented ·

20220810-073027.jpgI would be very interested in a solution too. I have the same issue registered, when we have a day with totally blue sky. And my mppt drops about 1kW for the time of mpp tracking every 10 minutes. That brings my battery sometimes to switch from charge to discharge and my water heater is getting off when there is to low solar power
0 Likes 0 ·
20220810-073027.jpg (272.3 KiB)
kevgermany avatar image kevgermany ♦♦ commented ·
If you abandon tracking, it won't be there. But tracking is the essence of an mppt.

Note that the graphical display is affected by sampling frequency. Interesting that the current increases during the tracking period. And here that appears to be making the tracking period be shown larger than it really is.


0 Likes 0 ·
Fra avatar image
Fra answered ·

I am evaluating a controller with an almost flat efficiency curve at any power at 99%.


And a double mppt routine with 6,000 changes per second.


And a 30mhz processor.


I noticed that the victron smartsolar in boost-mppt seems to vary the voltage up and down a little faster than once per second.


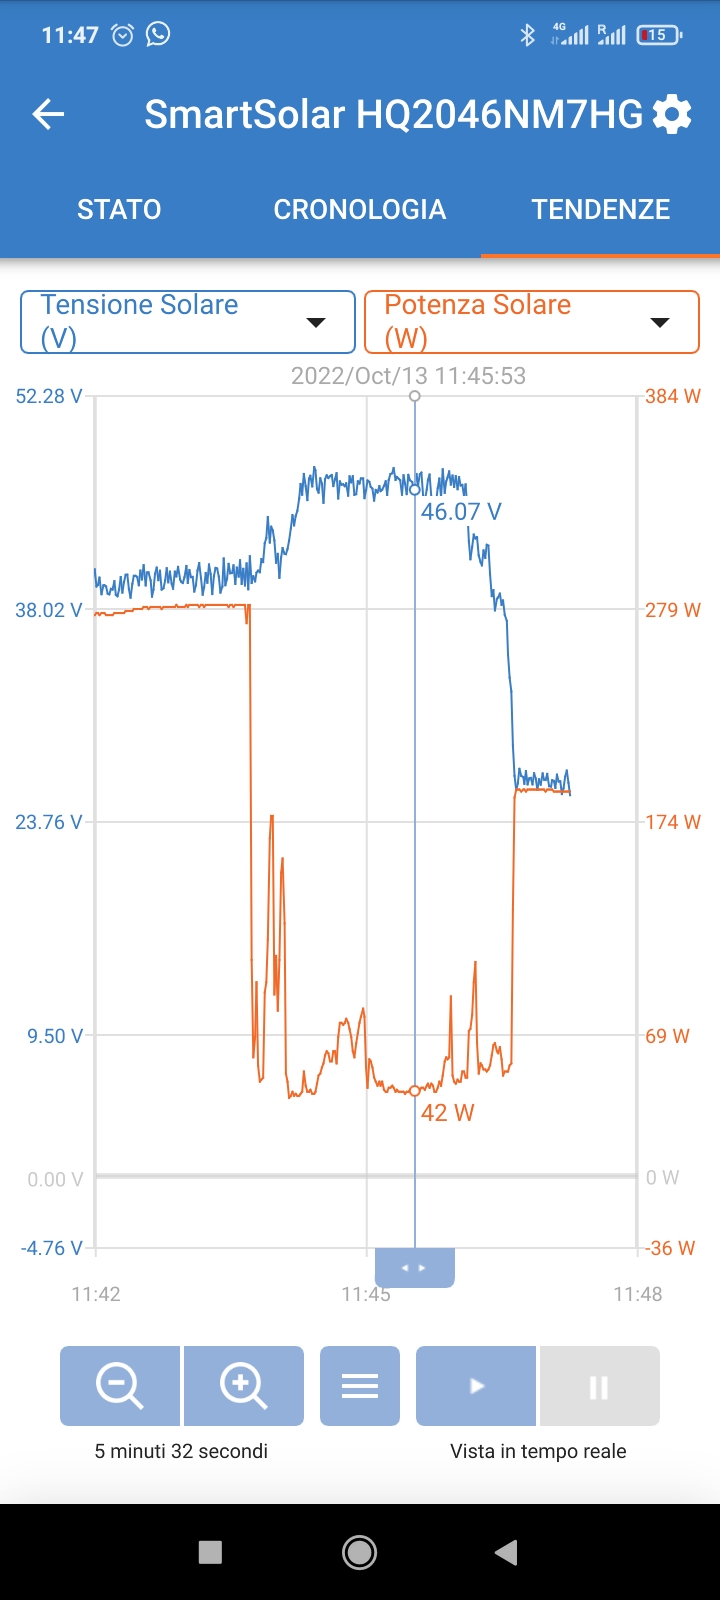
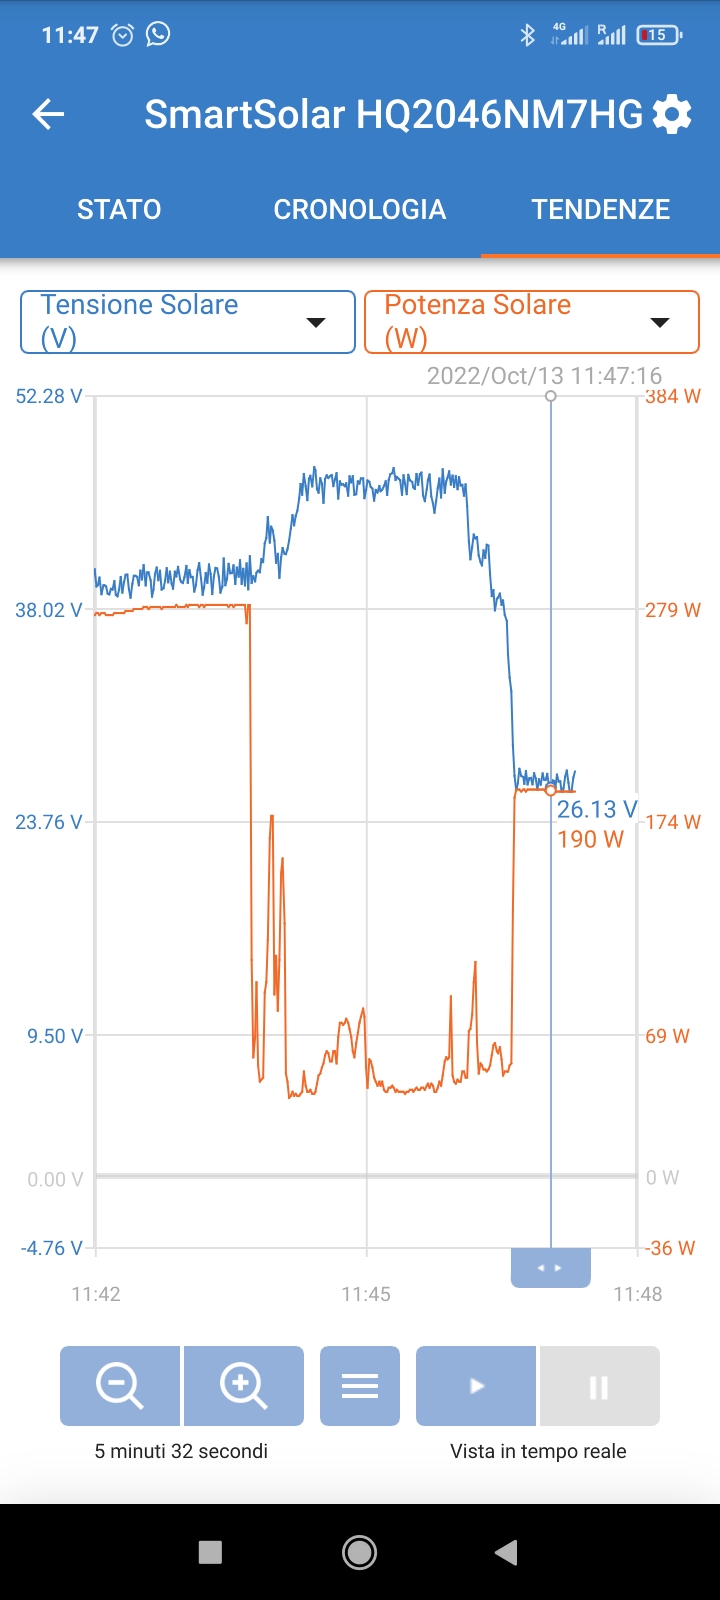
also noticed that in case of partial shading of 33% of the panel longitudinally on purpose, the controller stays for 3 minutes on a false MPP losing 3/4 of power. (Negative fact).

screenshot-2022-10-13-11-47-32-289-comvictronenerg.jpgImage Caption

screenshot-2022-10-13-11-47-28-761-comvictronenerg.jpgImage Caption

Only after 3 minutes does it find the true mpp at about half voltage and recover all the power possible.


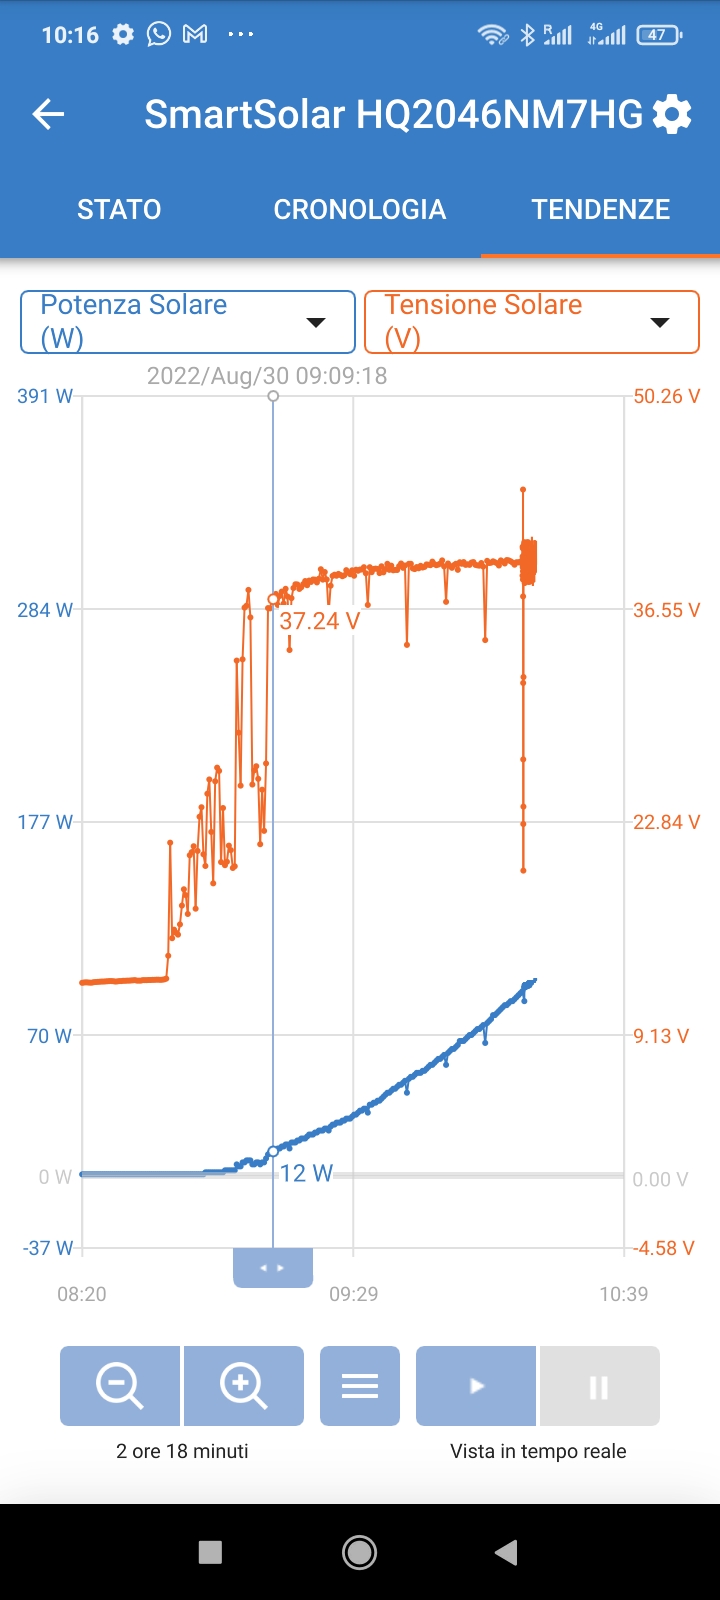
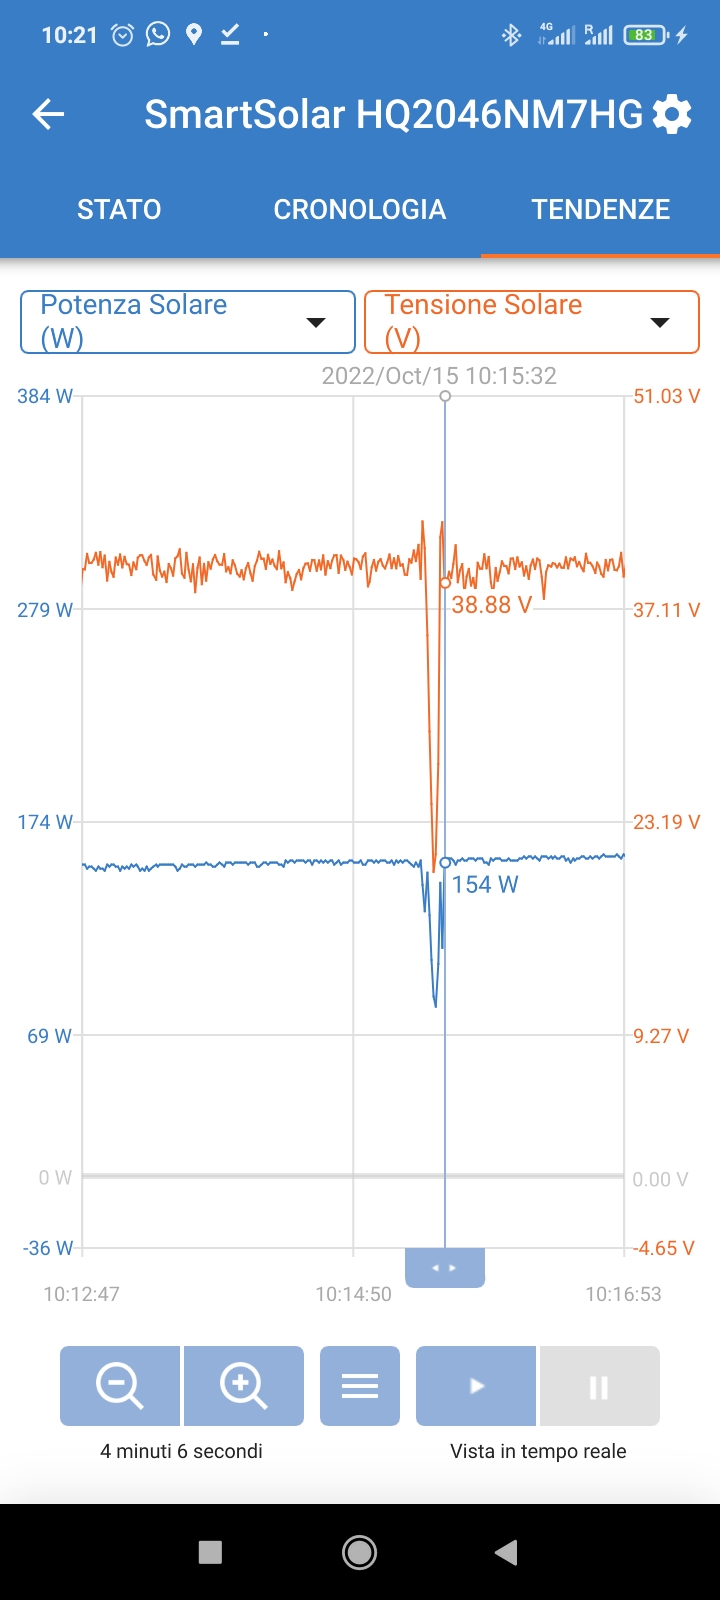
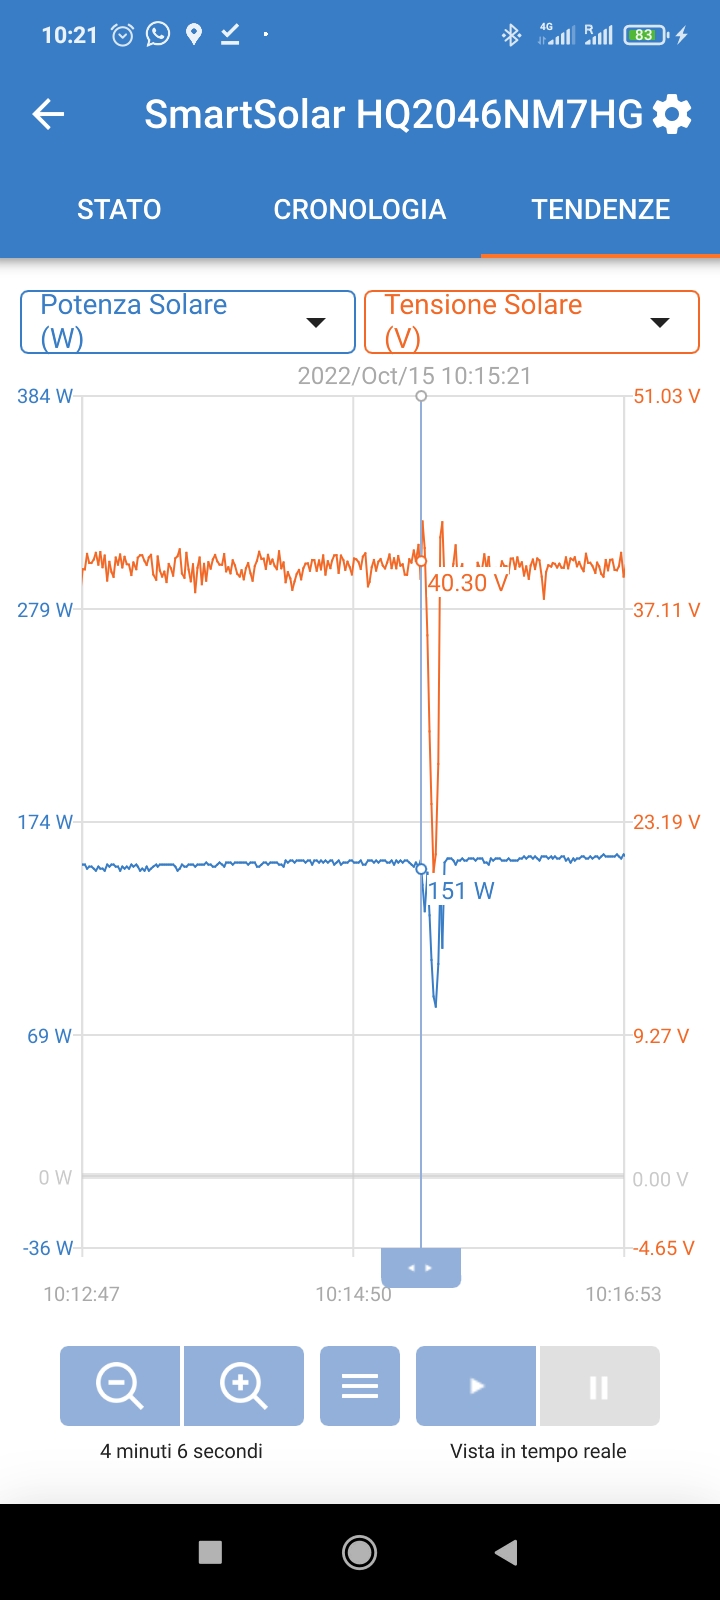
I also noticed a full swap of the voltage curve every 10 minutes lasting 10 seconds.

In my case last 10 second not 33 second.

screenshot-2022-08-30-10-16-30-134-comvictronenerg.jpgImage Caption

screenshot-2022-10-15-10-21-11-777-comvictronenerg.jpgImage Caption

screenshot-2022-10-15-10-21-04-314-comvictronenerg.jpgImage Caption

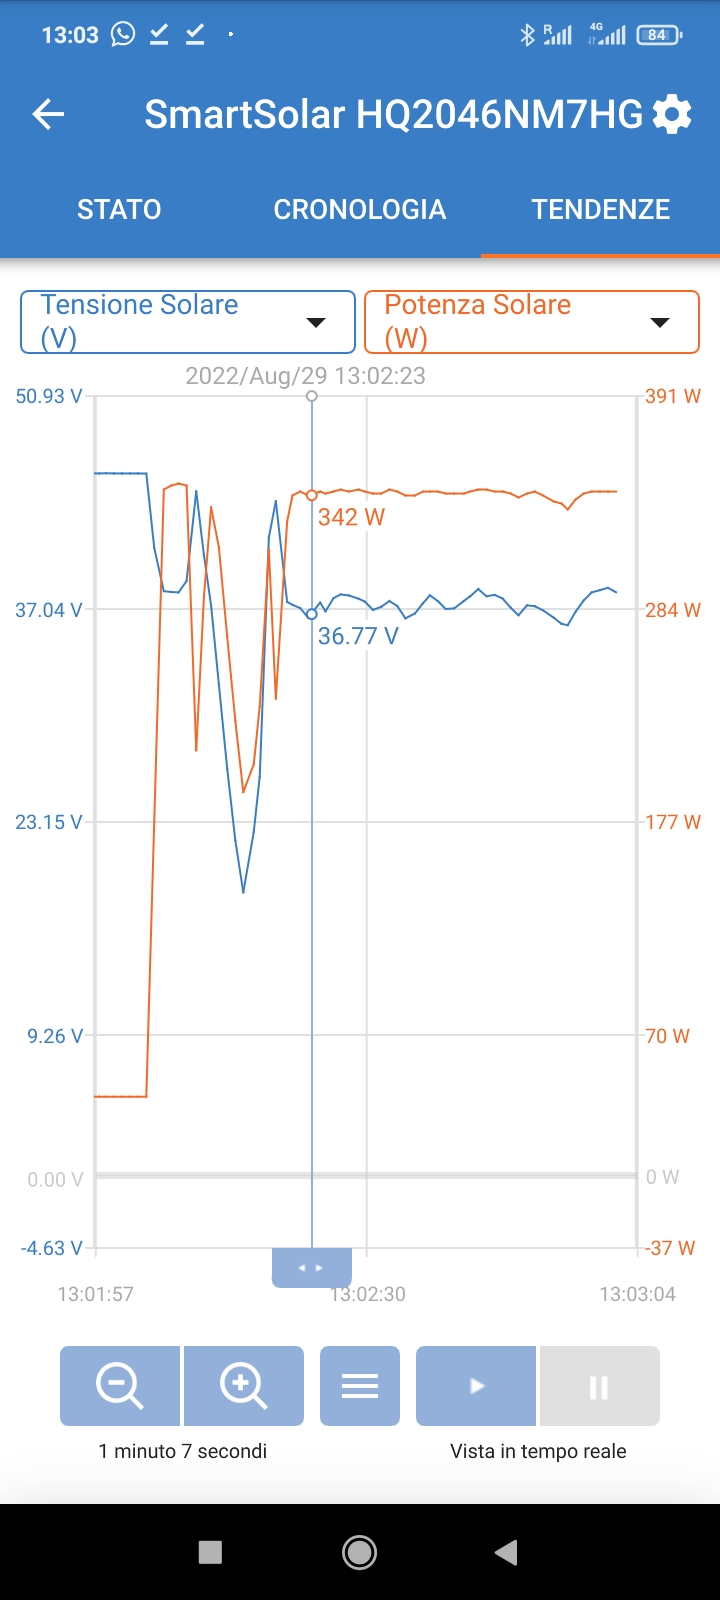
And I noticed that in case of sudden load increase from no-mppt phase to mppt phase the controller performs 4 complete swaps of the voltage curve (positive fact).

screenshot-2022-08-29-13-03-02-435-comvictronenerg.jpgImage Caption


Thank you


1 comment
2 |3000

Up to 8 attachments (including images) can be used with a maximum of 190.8 MiB each and 286.6 MiB total.

klim8skeptic avatar image klim8skeptic ♦ commented ·

I also noticed a full sweep of the current curve every 10 minutes lasting 10 seconds.

Typo's.

Mppt adjust power op by varying pv current,

0 Likes 0 ·
gerard-van-seventer avatar image
gerard-van-seventer answered ·

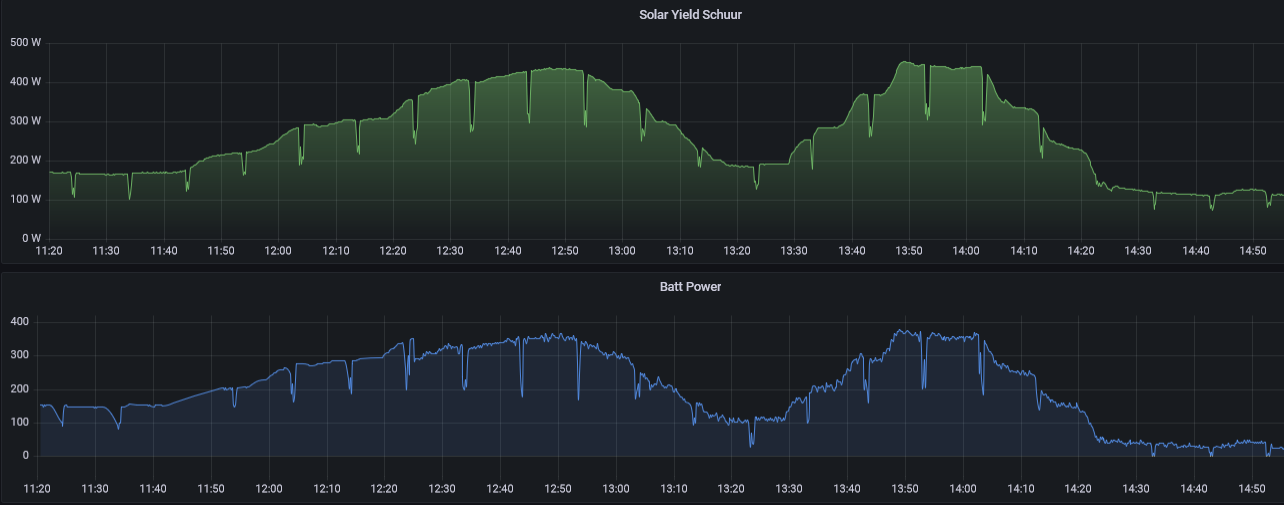
Does anyone know a solution for this "issue"?

I'm having a SmartSolar Charger MPPT 250/70 (v1.59) with the same issue. Since energy is expensive and any watt counts I would expect a better mppt algorithm.

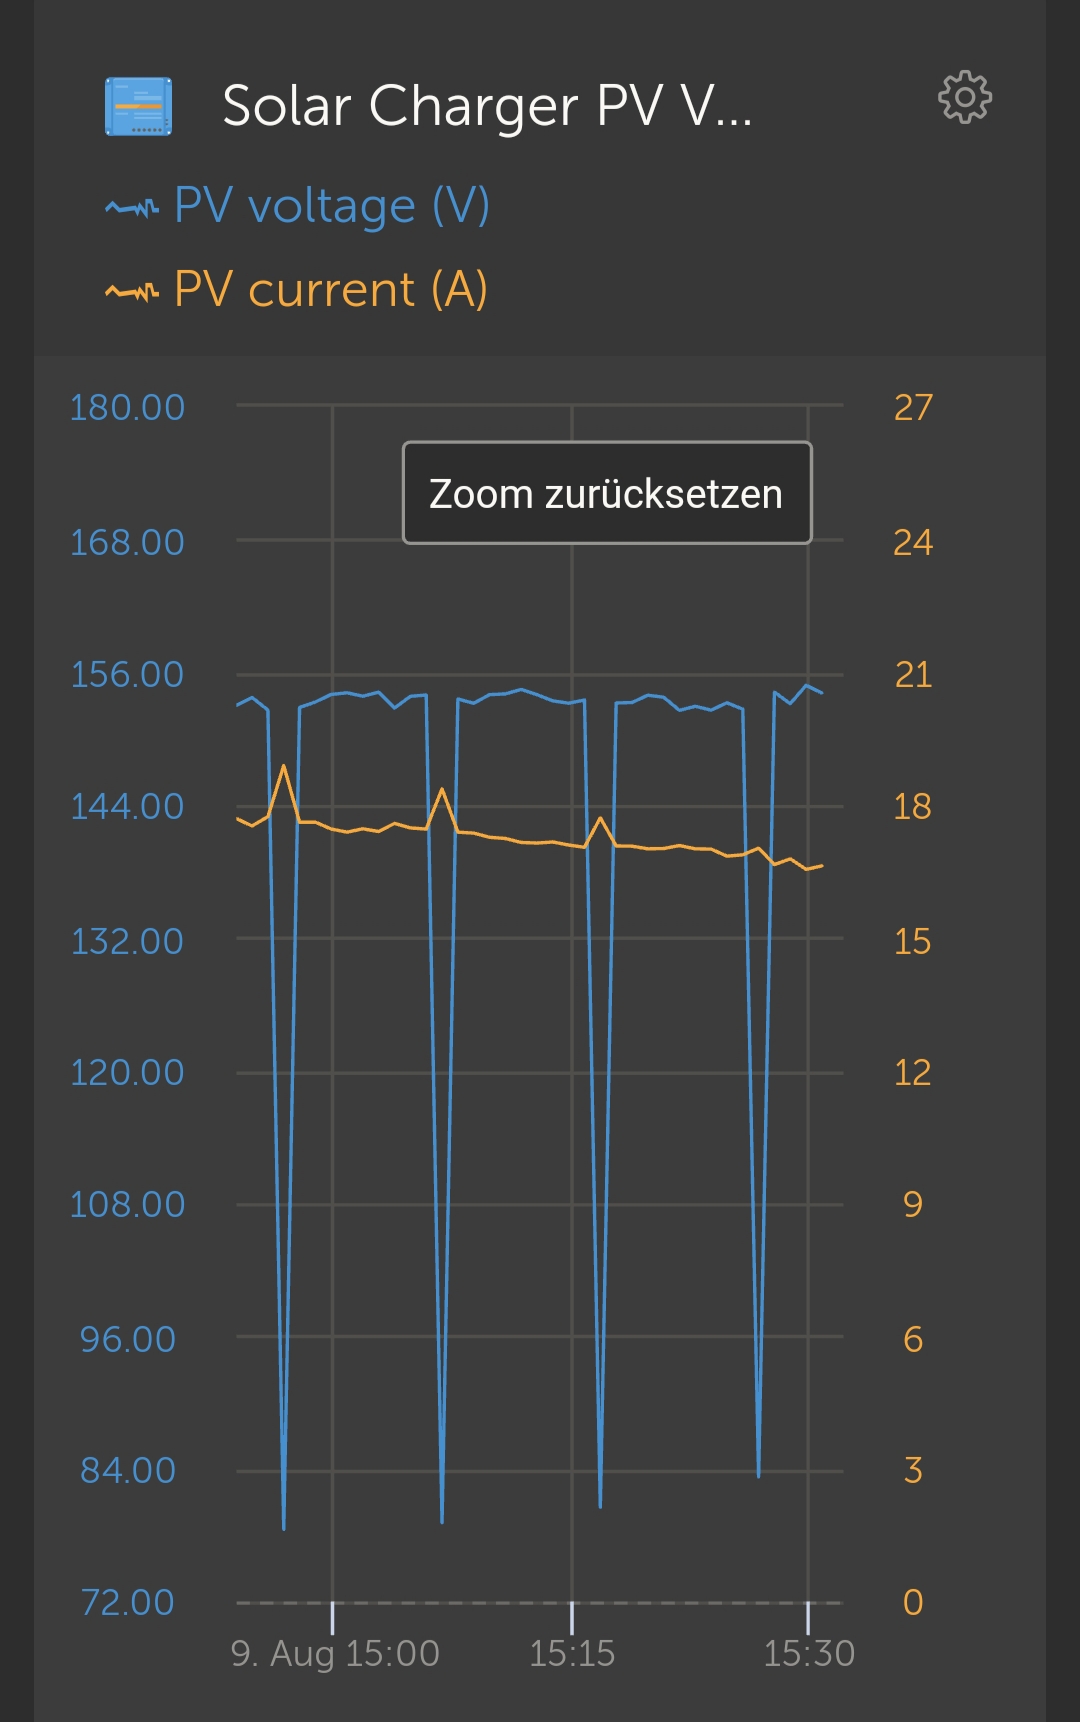
Here are my graphs with the issue.

mppt-dips-1.png

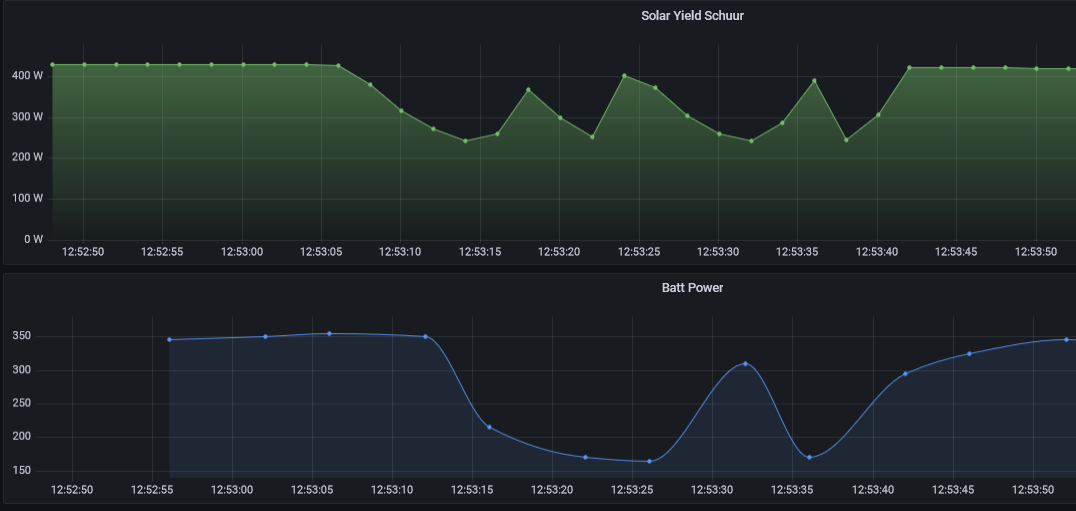
And some more detail

mppt-dips-2.png

--Gerard


mppt-dips-1.png (76.3 KiB)
mppt-dips-2.png (47.9 KiB)
2 comments
2 |3000

Up to 8 attachments (including images) can be used with a maximum of 190.8 MiB each and 286.6 MiB total.

kevgermany avatar image kevgermany ♦♦ commented ·
What issue? It's a natural part of tracking.
0 Likes 0 ·
Show more comments

Related Resources

MPPT Product Page

MPPT Error codes

MPPT 150/60 up to 250/70 Manual

Additional resources still need to be added for this topic