question

juergen pflug avatar image
juergen pflug asked

Grafana dashboard - Ideas

Hi.
I have finally got my VICTRON-Grafana dashboard running :-)

The devices in use are:
Venus GX
Quattro 48/8000
2x SmartSolar Charger MPPT 150/85 &
BYD Battery & BMS

I am using a Raspberry Pi4 running DietPi, InfluxDB, Telegraph plugin and Grafana Server.

I also installed the following plugins on grafana:

SUN and Moon (data source)

and

Carpet Plot


It is still work in progress but I am quite happy with outcome so far.
I have created a "Overview" dashboard where basically everything should be "green" - when OK.
So a quick look should tell me that everything is OK.

2021-07-27-11-48-27-victron-vrm-grafana-mozilla-fi.pngThere are more detailed dashboards for other things like the inverter:

2021-07-27-11-50-36-victron-vrm-grafana-mozilla-fi.png

or Battery

2021-07-27-12-06-47-victron-vrm-grafana-mozilla-fi.pngor charger - current data & history

2021-07-27-12-30-09-victron-vrm-grafana-mozilla-fi.png


I borrowed some ideas from other dashboards and added some of my ideas.

This is just to give you some additional ideas for the layouts

Cheers


VRMBMV Battery Monitorgrafana
2 |3000

Up to 8 attachments (including images) can be used with a maximum of 190.8 MiB each and 286.6 MiB total.

6 Answers
pau1phi11ips avatar image
pau1phi11ips answered ·

Looks awesome!

Hoping to do something like this at some point. Too busy converting a van to a motorhome at the mo.

2 |3000

Up to 8 attachments (including images) can be used with a maximum of 190.8 MiB each and 286.6 MiB total.

Marnix Keesmaat avatar image
Marnix Keesmaat answered ·

Would you like to share the json for the Grafana dashboards?
They look very nice.

1 comment
2 |3000

Up to 8 attachments (including images) can be used with a maximum of 190.8 MiB each and 286.6 MiB total.

jwfrary avatar image jwfrary commented ·
@juergen pflug would be really cool if you could share the json files for your dashboards!
0 Likes 0 ·
juergen pflug avatar image
juergen pflug answered ·

no problem :-)

Victron VRM-1630403024735.zip
but keep in mind: this is still work in progress :-)

cheers


1 comment
2 |3000

Up to 8 attachments (including images) can be used with a maximum of 190.8 MiB each and 286.6 MiB total.

jwfrary avatar image jwfrary commented ·
Awesome cheers
0 Likes 0 ·
daba avatar image
daba answered ·

check my approach :-)

https://snapshots.raintank.io/dashboard/snapshot/QkGgr01SGU1kgdgk4k1ndKKBEMKfhk2p

1 comment
2 |3000

Up to 8 attachments (including images) can be used with a maximum of 190.8 MiB each and 286.6 MiB total.

ppr avatar image ppr commented ·

would you share your approach as well and share the json?

thank you

0 Likes 0 ·
tinyvan avatar image
tinyvan answered ·

hello - my grafana data collection works fine with the default, but not with imported json files. do i have to set other things to work that? win 10 docker - so data are there, but with json files not visible. do you have any ideas? thx!!

2 |3000

Up to 8 attachments (including images) can be used with a maximum of 190.8 MiB each and 286.6 MiB total.

thiemoh avatar image
thiemoh answered ·

I transformed the awesome dashboard from juergen pflug to match the data format of default victron influx logging:

VictronDashboad.json.zip


1 comment
2 |3000

Up to 8 attachments (including images) can be used with a maximum of 190.8 MiB each and 286.6 MiB total.

albundy0815 avatar image albundy0815 commented ·

Hi and thanks a lot for providing the victrondashboard. I checked it on my side and most of them is working. But I've one special question which I'm not sure if you can reproduce it.

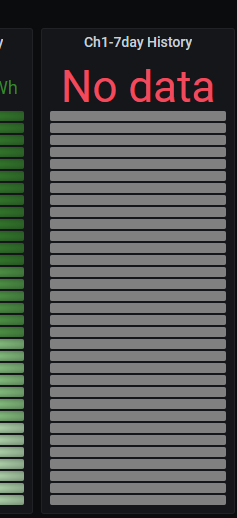
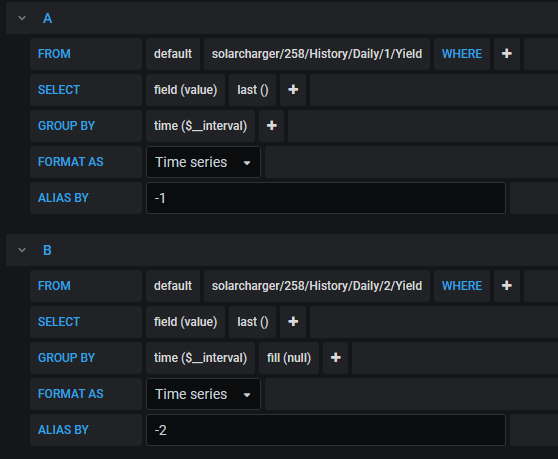
I would like to have the history yield of the solarcharger and it seems that these data are not in the influxdb. I see a lot of entries but not the history. I was searching the last days for a solution to reproduce it and it seems that these data are not requested from the docker victron-server.

In the initial and in your dashboard there is 1699191249713.png

and if I check it I can't get the data

1699191284135.png


When I check the measurements in influx, I can't see any measurement with the daily history:

1699191374190.png


Could you please check it for me as well? I guess, this was removed in the docker image?!

0 Likes 0 ·
1699191249713.png (10.5 KiB)
1699191284135.png (23.9 KiB)
1699191374190.png (28.0 KiB)