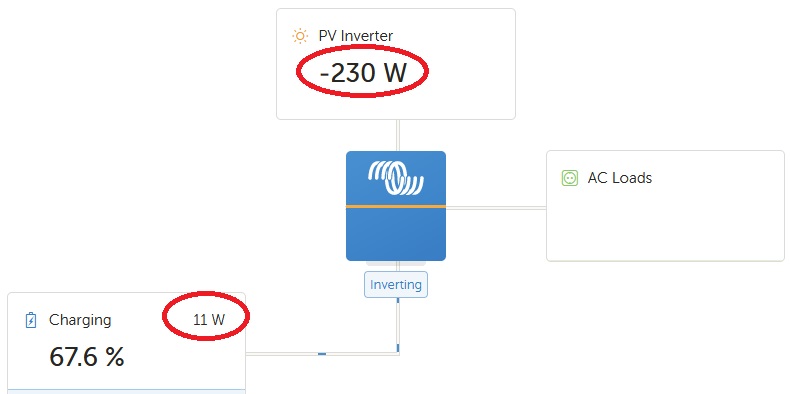
On the dashboard page I can see that my solar panels are for example at a certain point generating 230W, and 11W is being used to charge batteries, the rest is being used in the house (used energy = 230W - 11W = 219W).
Using API call below I can read battery to consumer (not on the image).
https://vrmapi.victronenergy.com/v2/installations/{idSite}/stats?type=live_feed&interval=15mins&start={startDate}&end={endDate}
But how do I read the 2 other values from the dashboard, using API? (in any form is ok: either the live value at the time of request, or some aggregate per 15mins or hour). In other words I want to get the values in red on the image, using API (this is the power from PV, and the power to Batteries)

I have tried using a different call below, but again I only get the same battery to consumer results:
https://vrmapi.victronenergy.com/v2/installations/{idSite}/stats?type=kwh
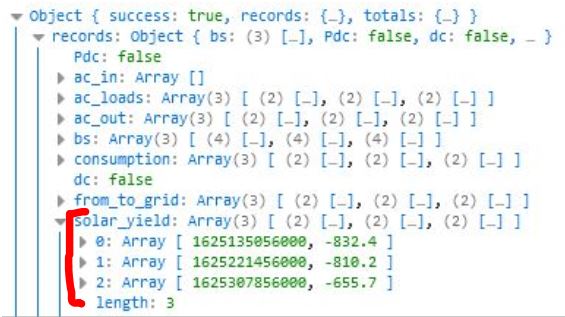
I also tried another call below, and this gives me the value I want in the field 'solar_yield', but only 1 value per day at 12:24 (around noon). Instead I would like either the current live value, or an aggregate per 15mins or hour:
https://vrmapi.victronenergy.com/v2/installations/{}/stats?end={endDate}&interval=15mins&start={startDate}&type=venus"

