Dear Community
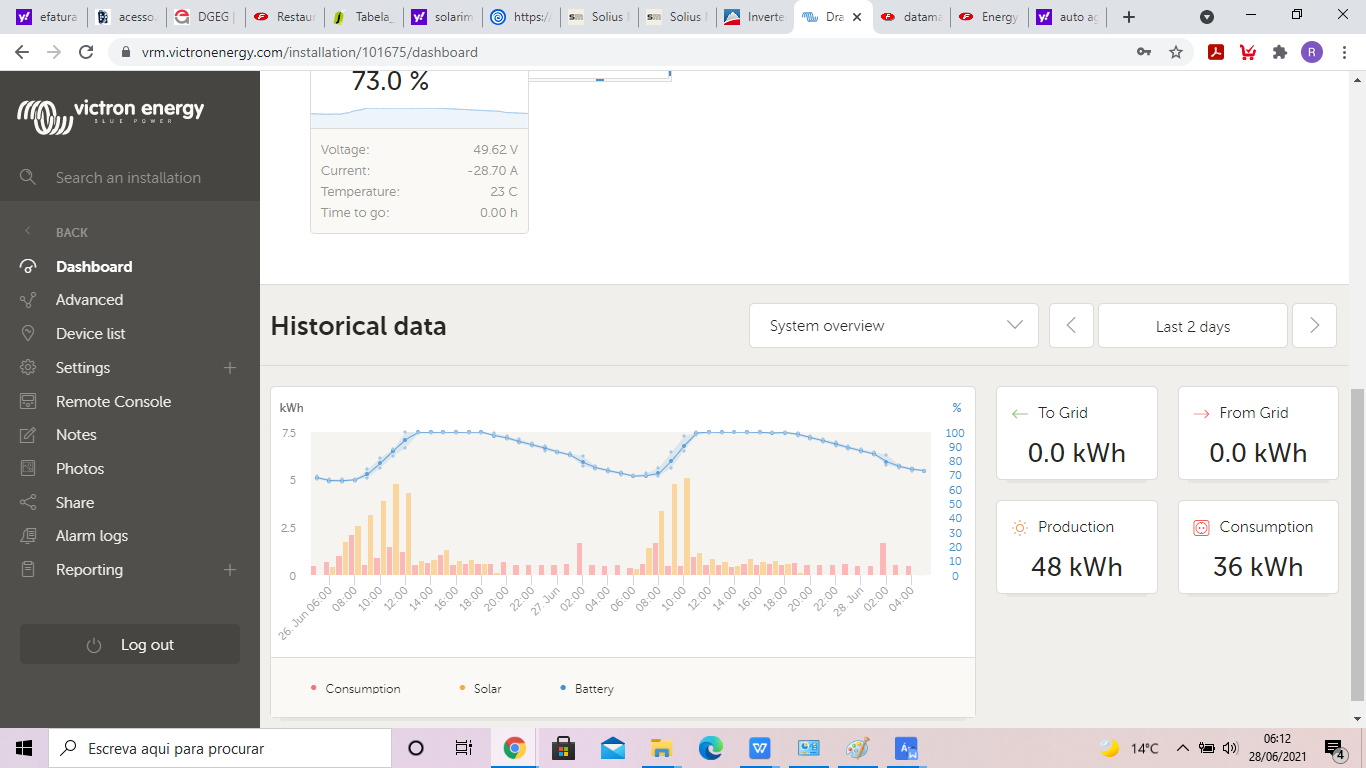
Till now, at least for me, the expected behaviour of the Pylontech SoC on the Dasboard Overview graph was a point over time, with little variance within the same hour.
That would result in a graph like this.
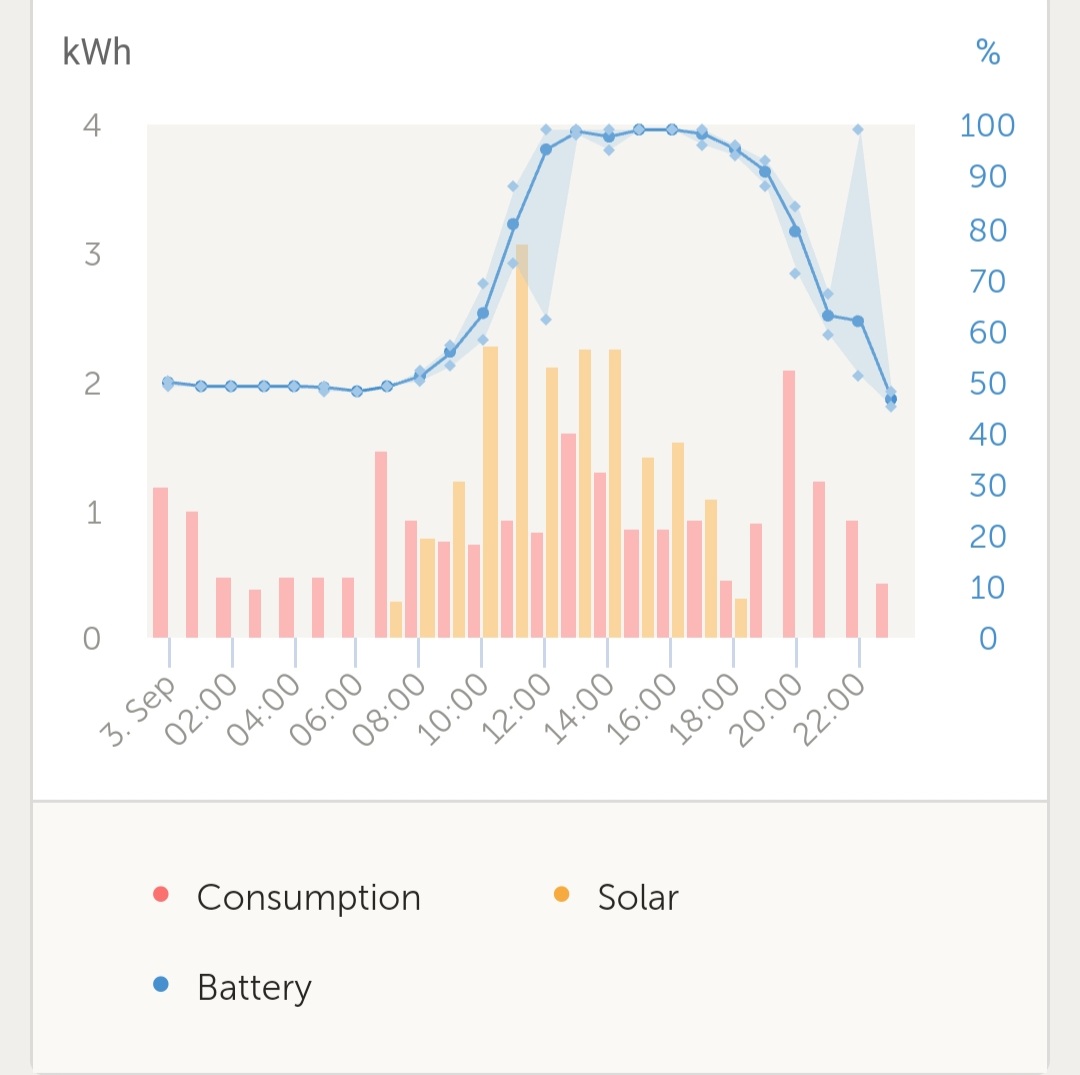
However, in latter installations, done with multiple US2000C (and using a LV HUB), the behavior of the systems has a wide range of SoC, that does not correspond to reality.
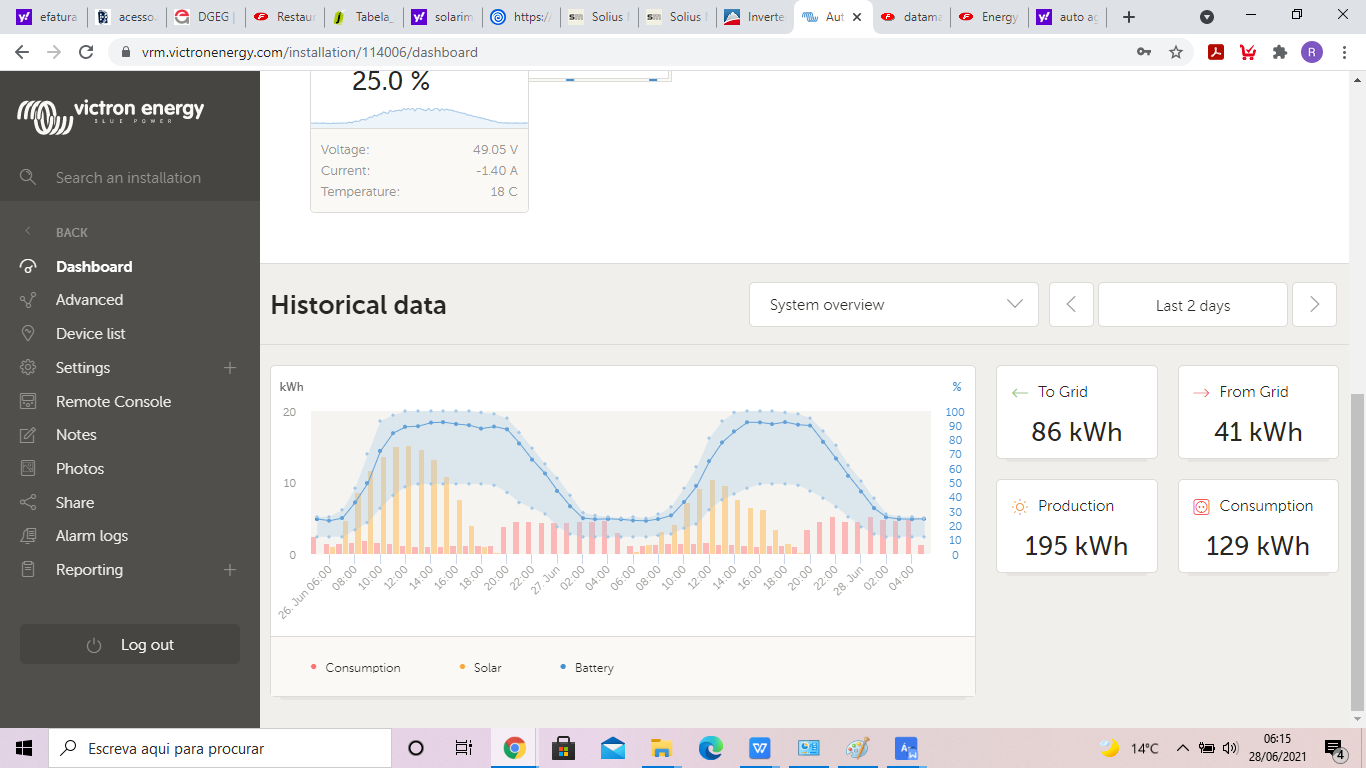
For sure there is a communication problem, as current SoC moves from 100% to 50% within minutes and then comes back again, and that results in the chart above with the "undefined" SoC.
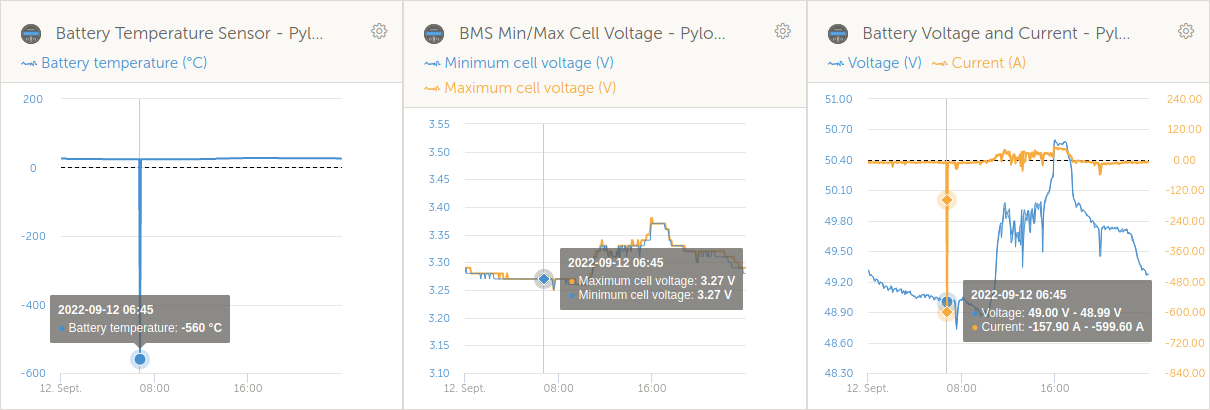
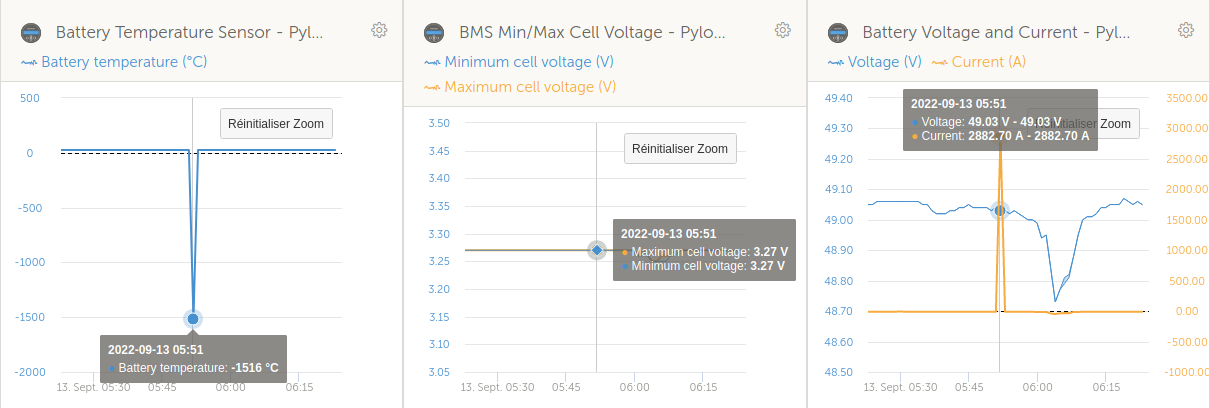
Another example (another installation also using 18 Pylontech US2000C and the LV Hub):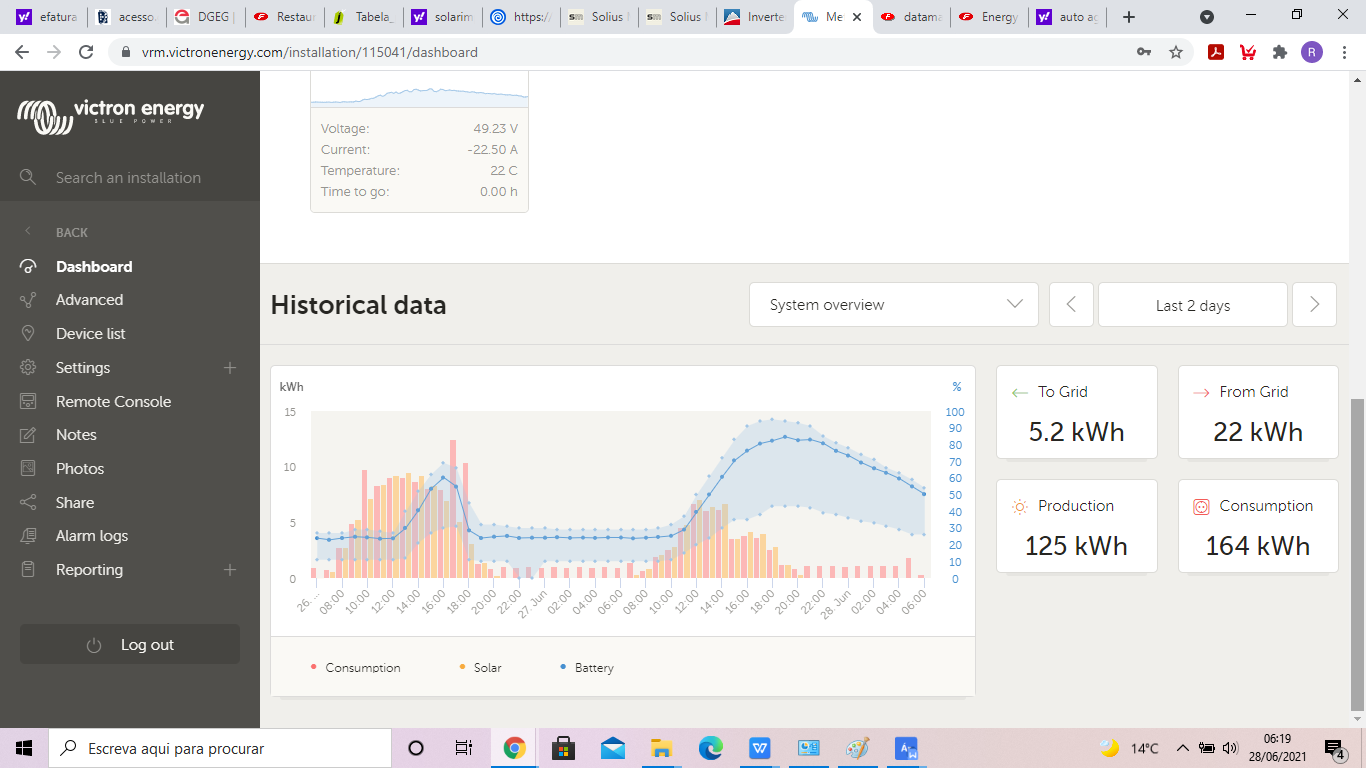
This one is even stranger, as the consumption adheres to the production, but I will ask for it in a different topic.
Note: it was hard to put the 18 Pylontech working right with the LV Hub, as the communication cabling is different from Pylontech US2000B.
Moreover:
Pylontech type B, use the Victron CAN cable type B.
Pylontech type C, use the Victron CAN cable type A
Which cable is the more accurate for the Pylontech LV Hub, using the new Pylontech type C?
Can you get me a updated manual on this type of installation with multiple Pylontech C batteries?
Best regards and thanks in advance.
Nuno M. G. Santos

