question

johannes-cronje avatar image
johannes-cronje asked

VRM Dashboard Information

Good Evening.

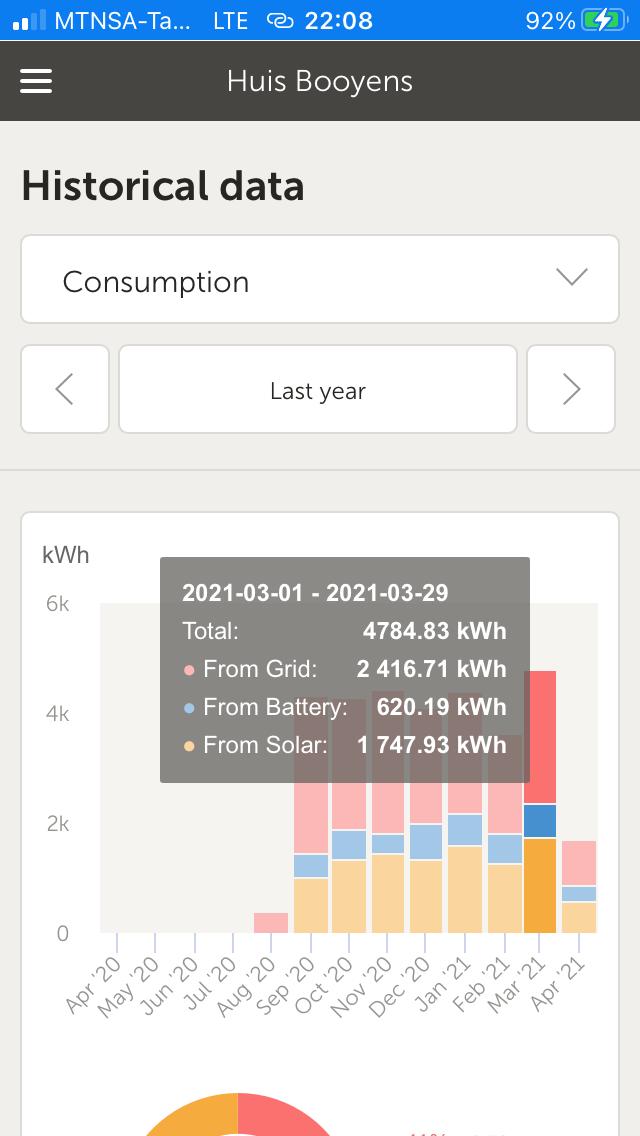
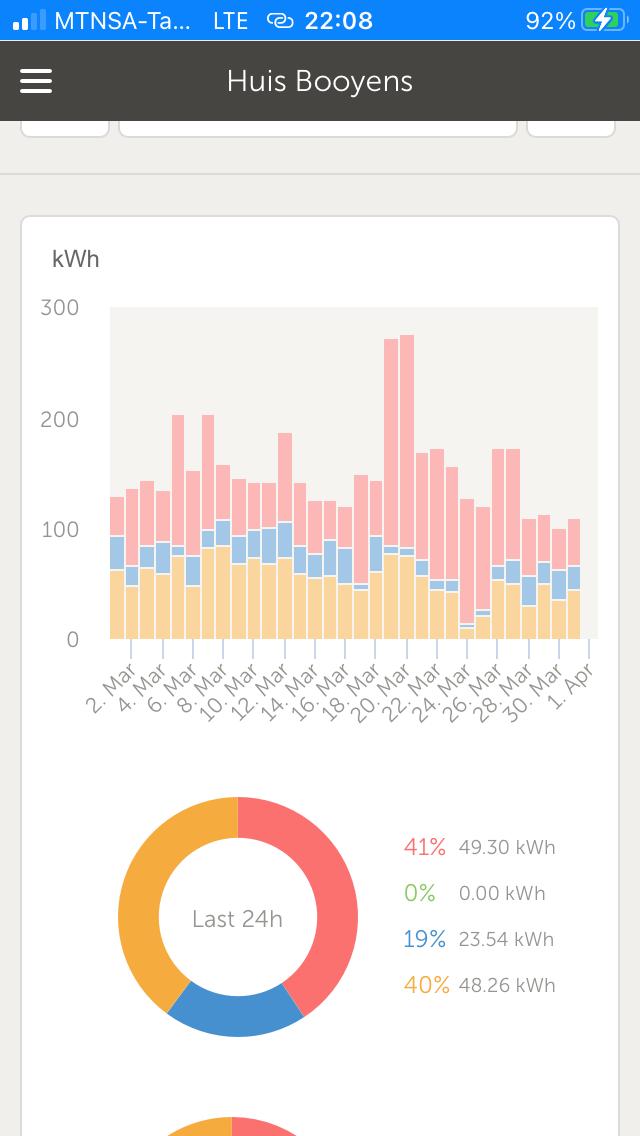
I am currently busy with a site analyses, on one of my installations . On VRM the Dashboard when working through my consumption figures , i notice something that does not add up. When Viewing a single month for example March 2021 i can see the consumption everyday from the 1st to the 31st . When i am looking on a month to month basis the dates indicate from the first to the 29th , this is the same on all the months , the date's are not until the end of the complete month. Is the information for the month as per the dates indicated or does it actually reflect a complete month.

Regards Johannes Cronje
whatsapp-image-2021-04-14-at-220958.jpeg

whatsapp-image-2021-04-14-at-220959.jpeg

VRM
3 comments
2 |3000

Up to 8 attachments (including images) can be used with a maximum of 190.8 MiB each and 286.6 MiB total.

Ulrich avatar image Ulrich commented ·

Maybe it's an InfluxDB topic: If you specify 1 month as the time frame, 30 days are always calculated internally. This is due to the SQL query. I don't know how Victron queries the data internally.

0 Likes 0 ·
Show more comments
1 Answer
Teun Lassche avatar image
Teun Lassche answered ·

Hi,

This looks like representation bug, the data being shown is, like already mentioned, for full months. The description seems off.


I've forwarded it internally, thanks for bringing it to our attention

2 |3000

Up to 8 attachments (including images) can be used with a maximum of 190.8 MiB each and 286.6 MiB total.

Related Resources