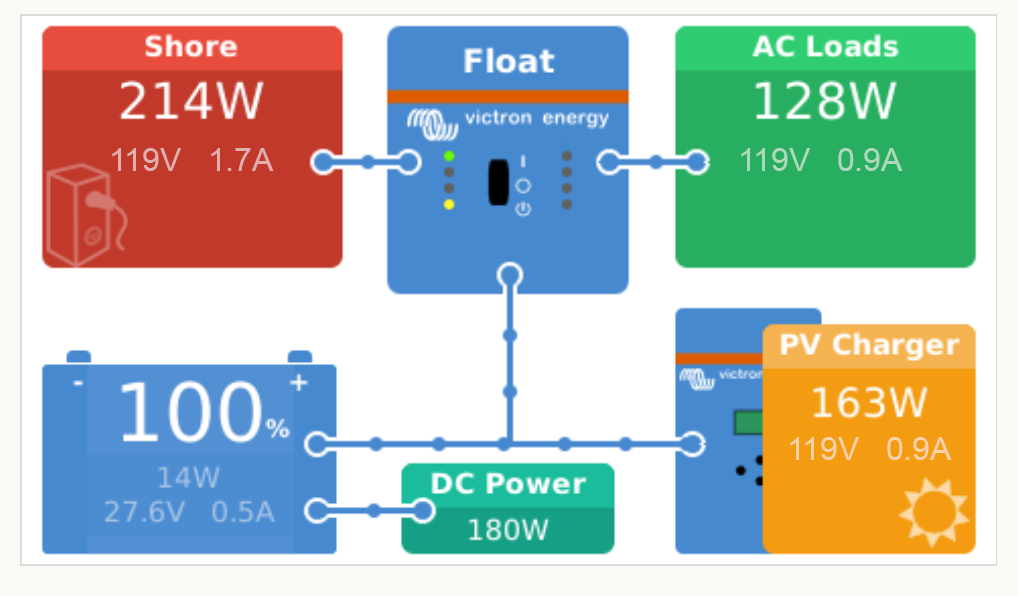
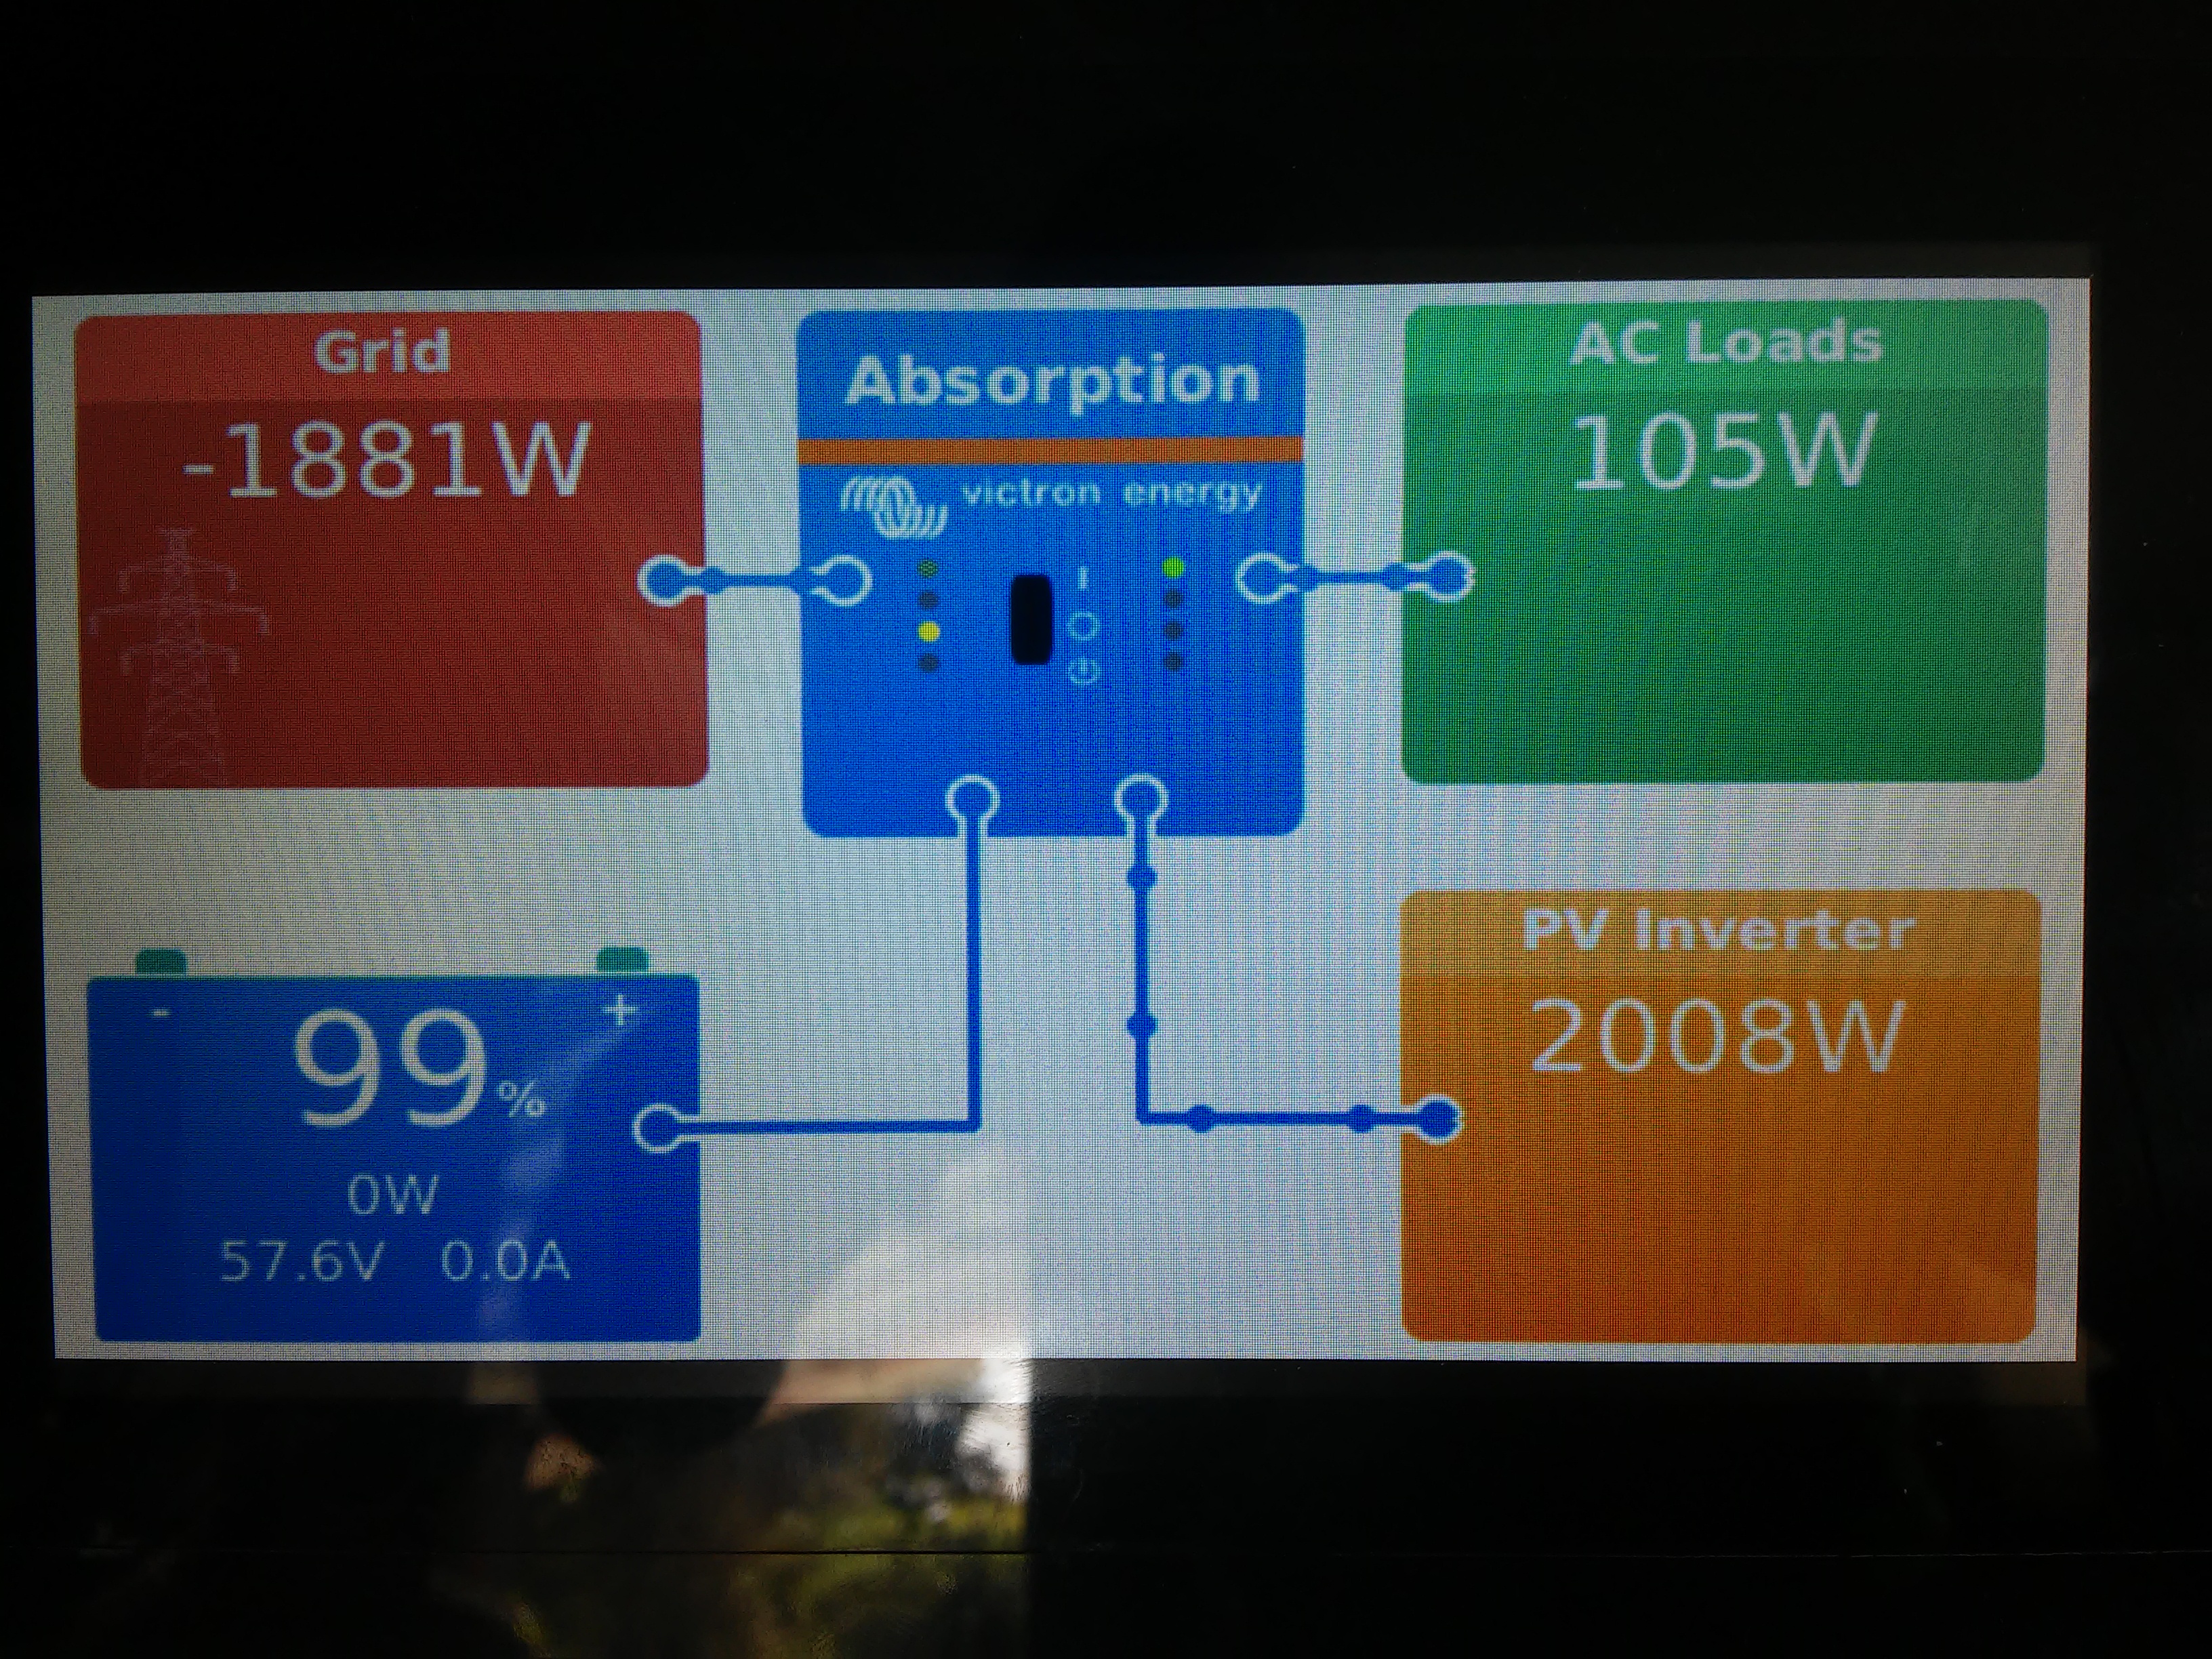
Why does'nt the CCGX display the volts and current values on the Grid and AC loads and PV loads, just like the Battery does?
I would be handy to look to see the what the AC voltage, current levels are doing.
- Home
- Anonymous
- Sign in
- Create
- Spaces
- Grafana
- Node-Red
- Unsupported topics
- Questions & Answers
- Modifications
- Communauté francophone
- Deutschsprachiger Bereich
- Preguntas en Español
- Explore
- Topics
- Questions
- Ideas
- Articles
- Badges
question
Suggestion - Increase the display parameters on CCGX overview screen
Hi Rob,
if you know a bit programming you can do this on your own:
look on your RasPi for the file /opt/victronenergy/gui/OverviewTiles.qml.
This is, where those tiles on the overview page are generated. You can use the blue tile with the Victron Logo for example, to edit it, play around and show the values you want.
Look for the values and variables available in dbus, you can use in your custom tile, in dbus_systemcalc.py.
The overwiew page (with the moving dots) can be edited in: /opt/victronenergy/gui/OverviewPage.qml
Do not forget to backup the original files, in case you destroy them by editing. ;o)
I would be glad if someone could find out the dbus variables for pv power of a single mppt in case there are more than one. I was not able to find this out by now.
Regards,
Markus
Hi Markus
Thanks for the information, i am using a Raspi 3B+ with a 7inch screen so has plenty of screen area to display this data compared to the CCGX unit.
I will have a look at the code later on.
I am running version venus Ver 2.30-6
Regards
Rob
Hi Markus
What is the best program to edit these QML files, QT editor etc?
I've just been using emacs for small changes.
I imagine Qt Creator can probably load them, but they're not very complicated in the first place.
You know, I agree, would be nice to know at a glance how hard I'm pushing my generator (by voltage sag) or my shore line. Would be a question for @mvader (Victron Energy Staff) I'd suspect.
It was a choice. If you show all there is to show. The page would be full of small font-size numbers.
Especially for a three phase system.
You do know you can see voltages, but then on a different page, right?
Perhaps we can make a special page full of numbers some day. Also when testing things it’s nice to see all there is to see, however cluttered.
Oh, sweet, I might have to try this. Only thing that stinks is it gets blown away on firmware update.
Not necessarily; put your custom work on /data and make a script that writes it to the rootfs on powerup. This is documented, in the root access document I think.
For more discussion on this, please go to the dev-venus mailing list.
Looking forward to a screenshot of your work! ;-)
Ps there is also this now, as an alternative to modifying the wel you can modify html:
I meant the original files can get modified by the update and Venus will not start with the old ones from the previous Firmware. So you have to edit the new versions of the files...
So it was at the last Firmware Update I did.
Ah yes. If you are really serious though, and have improvements that benefits every one, then put in a pull request. I might have to give you access to the sources, but that is no problem.
@mvader (Victron Energy Staff) I do some UI work in my day job, I'd think we could consider data value opacity to help bring some visual hierarchy as well as the varying sizes you already have. I might have to play with this either way.
I’m not sure what you mean? Sounds cool though, data value opacity ;-). I’ll look it up after clicking submit.
But perhaps if not in code you could make a sketch of what you mean? I’m always interested in better ways to show lots of data / turn lots of data into information.
Here is how it might work. Visually this big and bright number stick out and catch your eye then you cna focus in on the details if you want.. VS it all just screaming visually at you.

Yes very thing i have being thinking about, bang on the money Neoneddy.
that will just finish the display data off nicely., and give the clients more information to go by, as most would appreciate it. As most engineers installing and commissioning can see what the grid and inverter voltage are doing etc.
Regards
Rob Duthie
Hello @mvader,
maybe it would be a good idea to consider to make a Custom Tile as a feature of Venus.
This would be the ultimate approach against the "I would like to see this voltage and that current on the ccgx overview" grousers.
Regards,
Markus
 There is plenty of room below the Grid and AC loads, PV inverter to show these parameters.
as per image, as you can see the battery has space for volts and current.
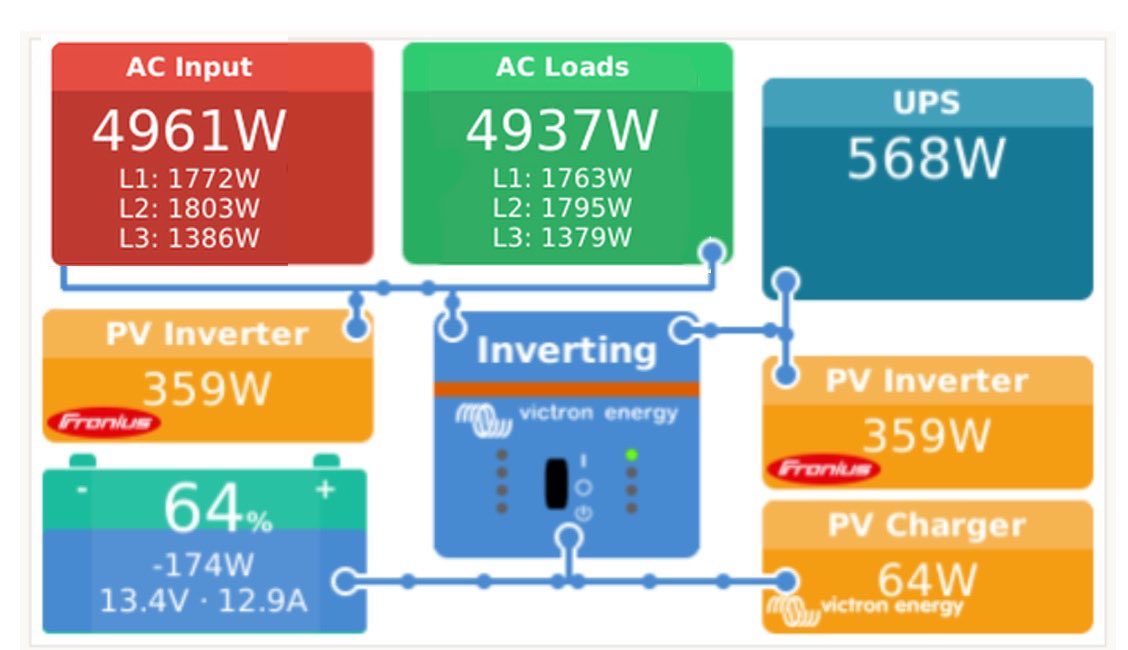
In that system, there is a lot of free space. But there are MANY possible configurations already. So any design change to the information shown needs to take into account the full range, so it doesn't break something for some other users.
Such as this poor (possibly impossible) example with a 3 phase system and multiple Fronius PV inverters:
I still think this is a very good idea, and have wanted more data at a glance myself. Especially for troubleshooting generator issues.
There are a lot of good suggestions in this thread which I like, such as a 'custom' tile screen.
Another nice addition would be the option to show the "time-to-go" from the BMV on the battery tile. Yes, we can modify the QML ourselves. But this is arguably more important than one of either {current, power}, since those two values are redundant with each other when voltage is displayed.
You could add in settings another area to turn on the voltage and current readings for the AC loads, PV invertor etc as an option for the color control units.
I am willing to be used as a test bed for this idea, i have just ported a raspberry pi 3B+ to version 2.30-8 and testing that now with full functions etc.
I have being using Bit vise to access the linux files so i can edit them now.Related Resources
Additional resources still need to be added for this topic
The feature requests topic tag can help Victron R&D find feature suggestions for products.
There are many factors that go into the Victron product roadmap, and feedback from end-users can help.
question details
6 People are following this question.
Related Questions
SMA STPTL-30 + data manager M + Victron Quattro = ESS + zero feed-in
Quattro based SOC % counts down too slowly but CCGX displays correct AC load wattage
Batteries apparently losing charge on light load
I'd like to propose a change to VRM and venus-OS system diagram DC bus
Can Color GX use Wifi for remote VRM comms and wired LAN for direct comms to SolarEdge HD Wave
