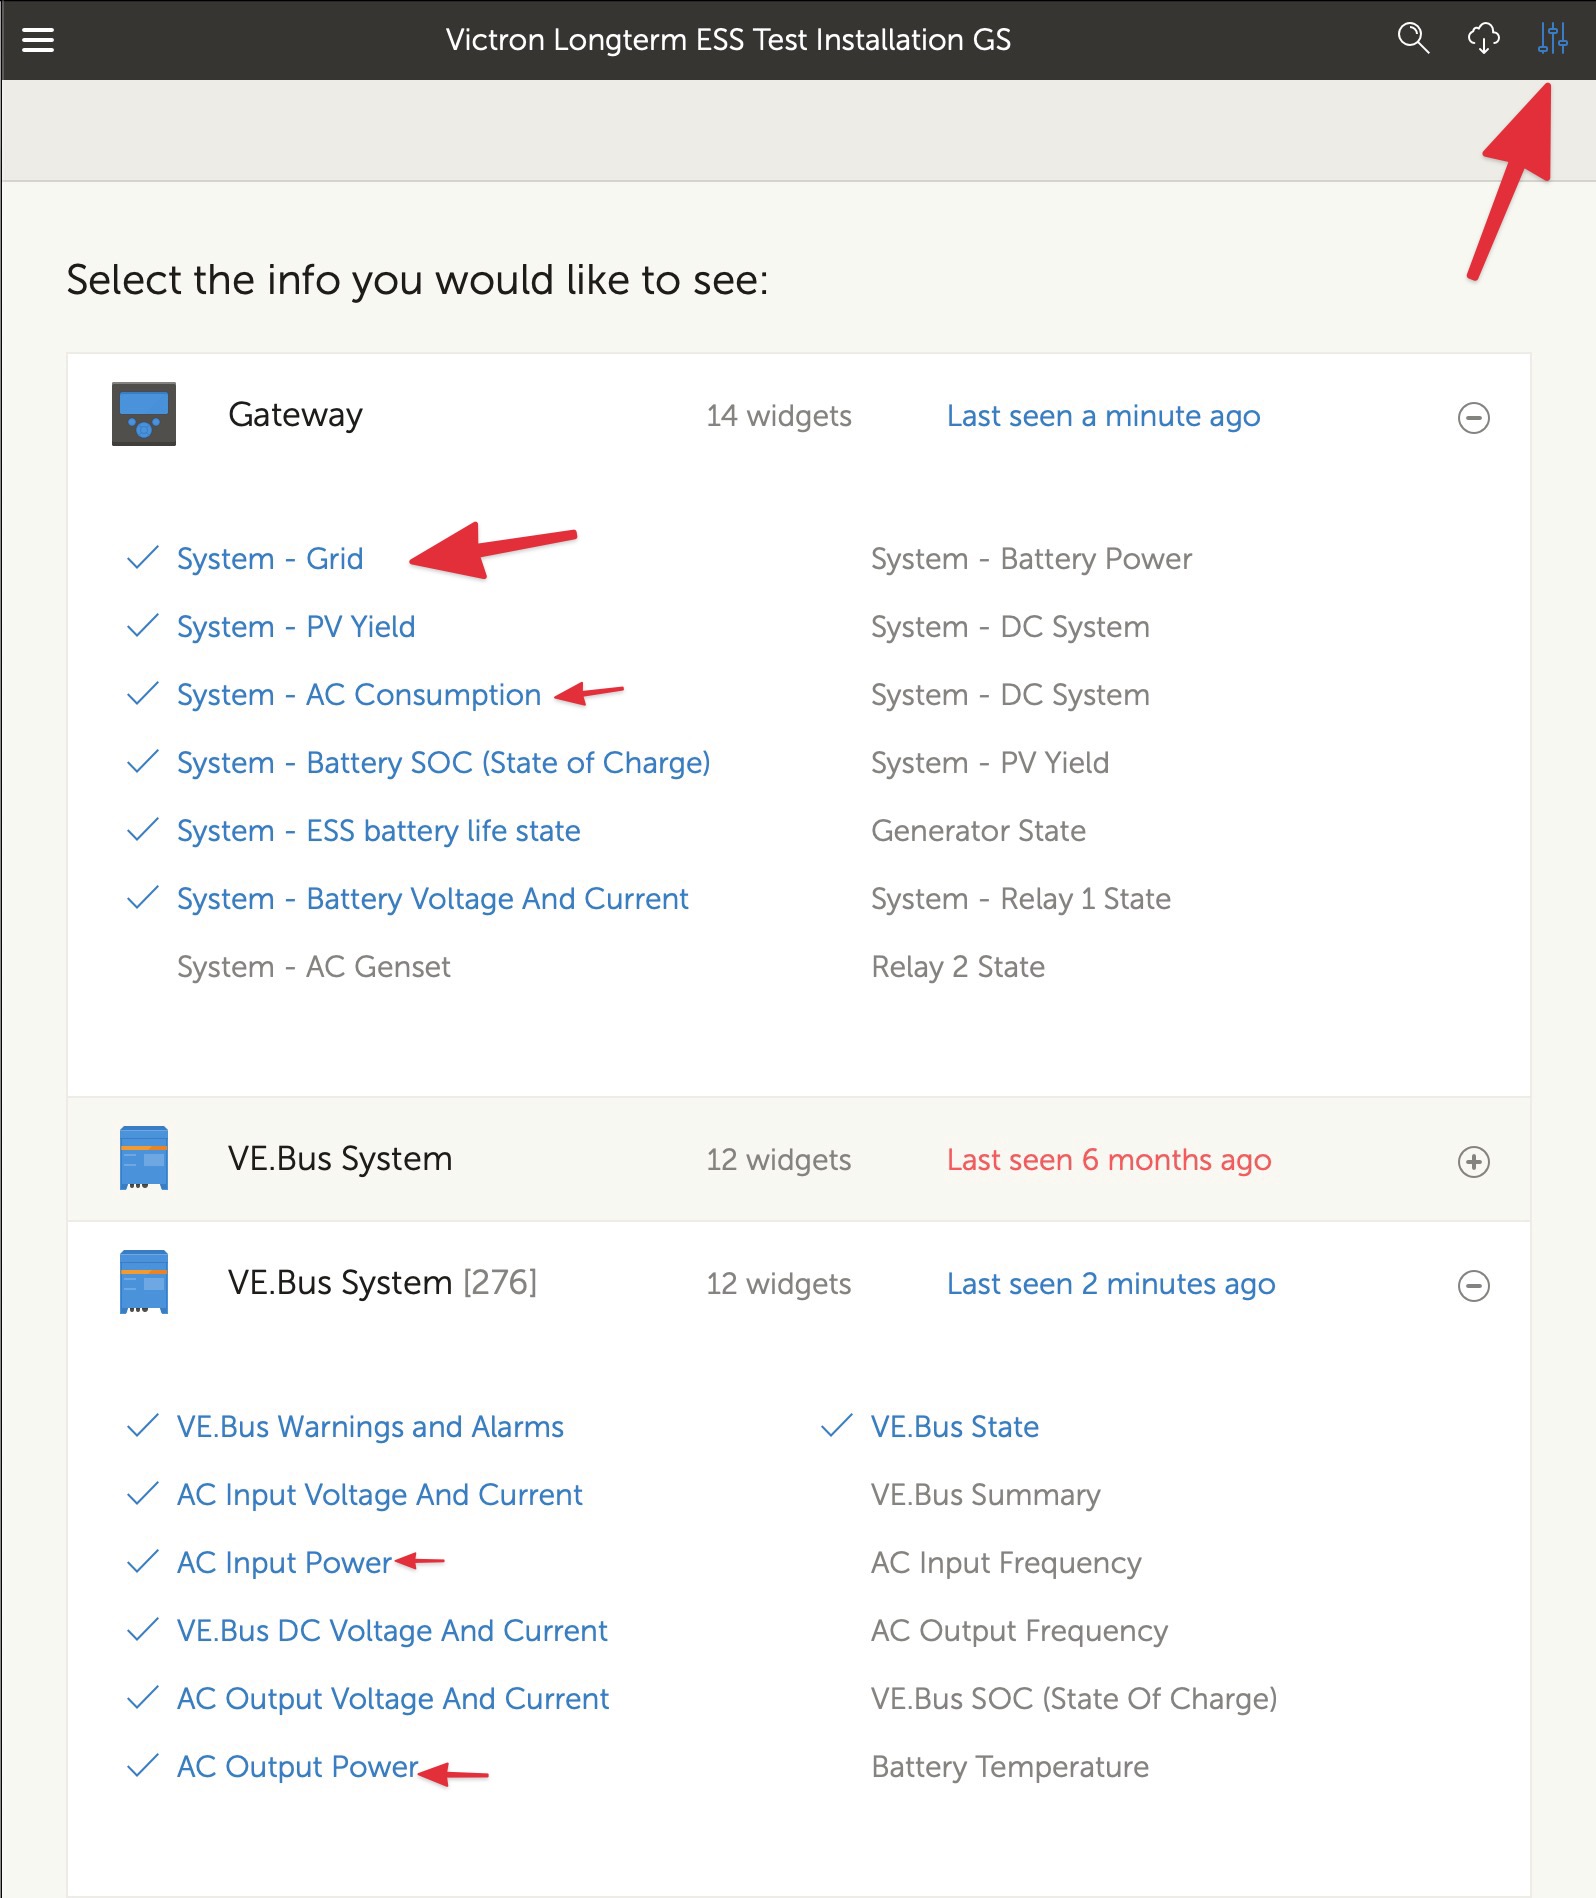
I have multiple systems running ESS successfully and I get a great visual picture on the new dashboard and on remote console of what my critical loads are (will work when grid down) and my AC loads - will not work when grid is down. I am not am to see this as a graph over time. I am sure it is possible to show this as a graph if the values can be shown in realtime. Please can you guide me as to where to see this info on the advanced graphs.
- Home
- Anonymous
- Sign in
- Create
- Spaces
- Grafana
- Node-Red
- Unsupported topics
- Questions & Answers
- Modifications
- Communauté francophone
- Deutschsprachiger Bereich
- Preguntas en Español
- Explore
- Topics
- Questions
- Ideas
- Articles
- Badges
question
Hi @Richard Douglas,
Perhaps not yet,
I trust you are familiar with the widgets button, and the available options that presents in the advanced section of VRM.

That is the extent of the data currently shown, so if you can't find what you are looking for it might need to be added.
I will make an enquiry to find out in case it is there somewhere, otherwise if it can be added.
While you wait, have you had a look at the VRM Online Training on Victron Professional? It has more demonstrations and explanations.
Hi Guy. I suspect it is not there yet.
It is important for us in South Africa - with a terribly unreliable grid - to be able to estimate loads and the area under that curve at certain times of day to correctly size batteries and to a degree solar arrays. If you could get this on to the requests I'd be grateful.
I understand, I will see what can be done.
For now - you can still get the info you want via the 'download function' here - though not displayed as nicely as the VRM :)

question details
42 People are following this question.
