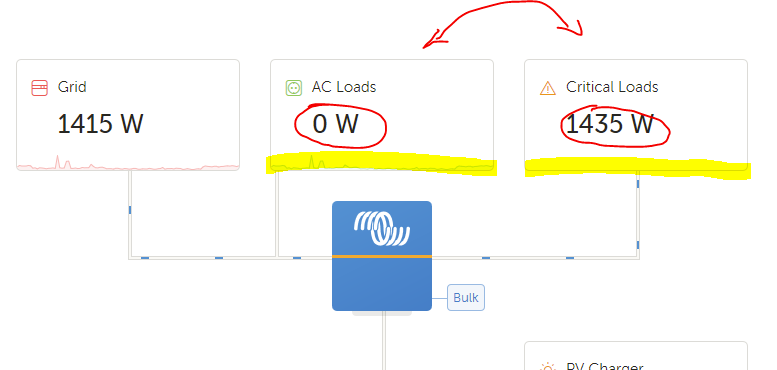
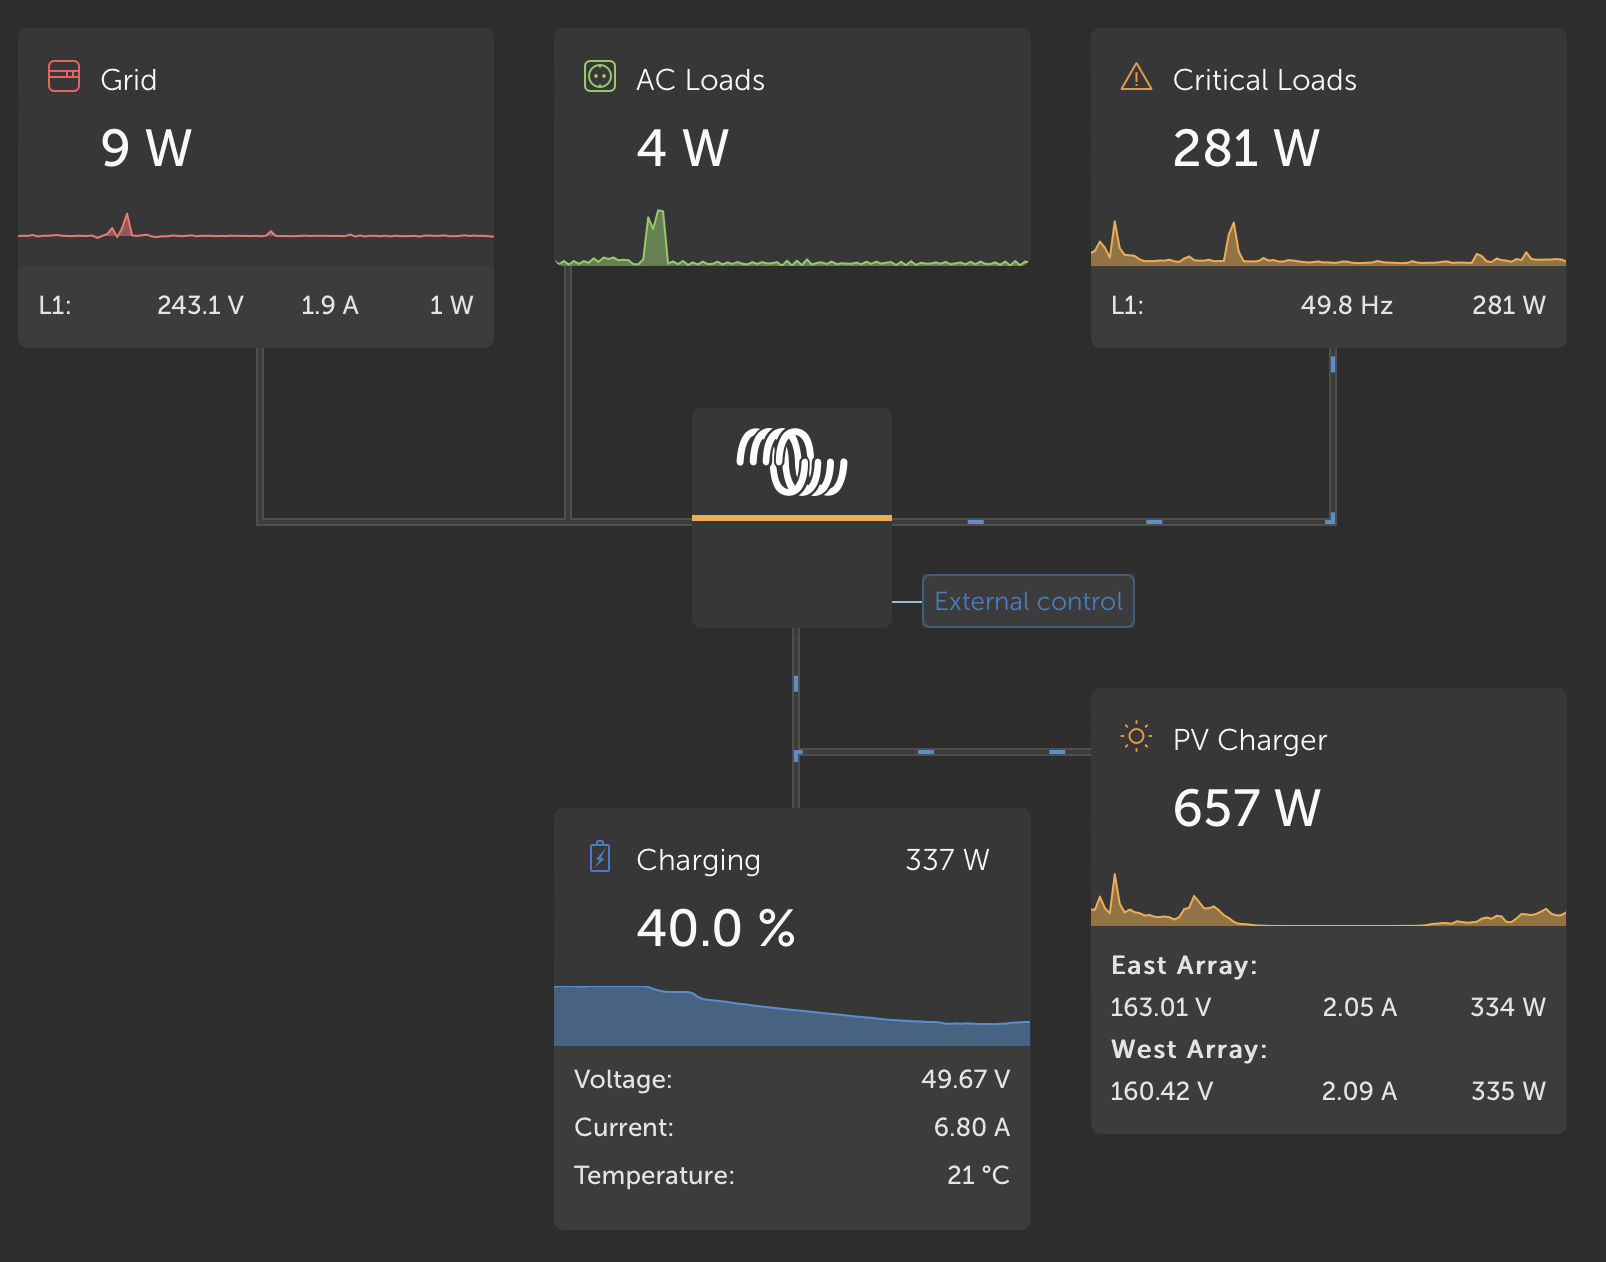
I am slightly confused by the below capture. Should there not be a little graph displaying Critical Loads as well? Perhaps the AC Loads and Critical Loads graphs are swapped around somewhere in the code.
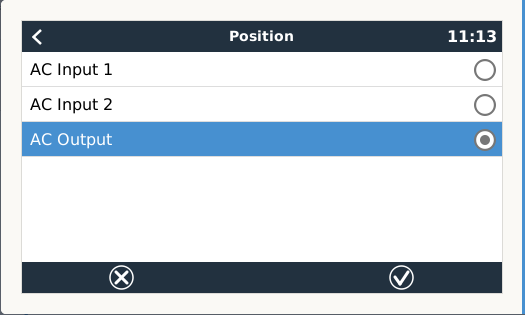
My System consists of a Quattro and ET112 Grid Meter (selected as active).
If I select the Internal meter then the AC Loads and Critical loads become one and displays correctly as a single box with the correct graph. With the external meter the below is shown.
I've also checked other VRM images on the Net and they are all the same from what I can find.


