question

Ingo avatar image
Ingo asked

VRM Dashboard AC Loads vs Critical Loads Graph?

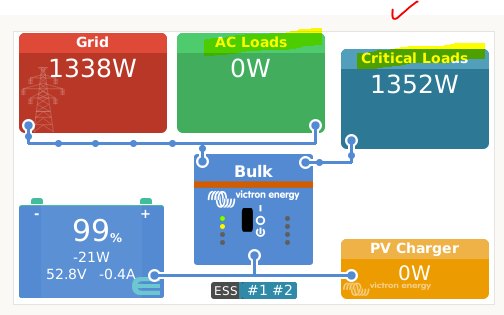
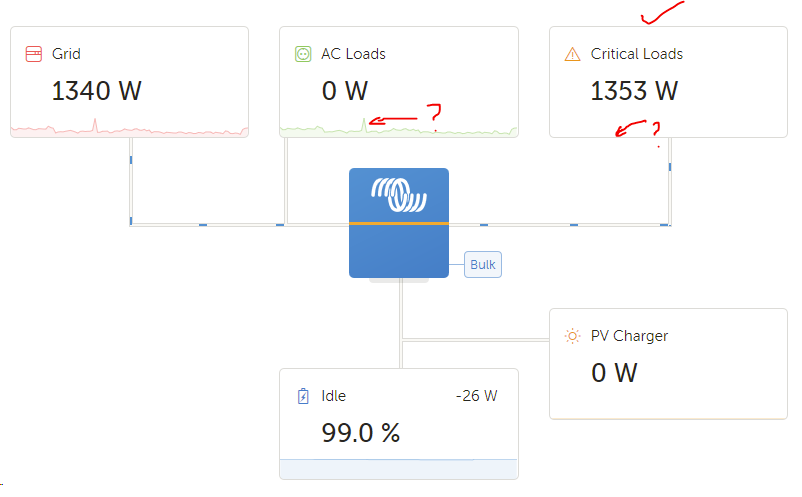
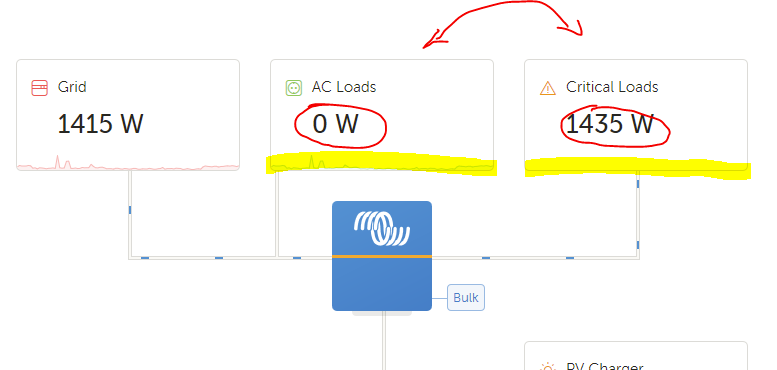
I am slightly confused by the below capture. Should there not be a little graph displaying Critical Loads as well? Perhaps the AC Loads and Critical Loads graphs are swapped around somewhere in the code.

My System consists of a Quattro and ET112 Grid Meter (selected as active).

If I select the Internal meter then the AC Loads and Critical loads become one and displays correctly as a single box with the correct graph. With the external meter the below is shown.

I've also checked other VRM images on the Net and they are all the same from what I can find.
1608804231739.png

VRM
1608804231739.png (22.0 KiB)
6 comments
2 |3000

Up to 8 attachments (including images) can be used with a maximum of 190.8 MiB each and 286.6 MiB total.

2 Answers
freddyuk avatar image
freddyuk answered ·

Is there any update on this condition?

1 comment
2 |3000

Up to 8 attachments (including images) can be used with a maximum of 190.8 MiB each and 286.6 MiB total.

ppr avatar image
ppr answered ·

I dont understand the problem. Everyhing connetced on the AC-Out-1 is "Critical Load"
If you uncheck the grid meter and tell the Multis to sum everything up and display what there current load is, it is obvious that Critical Loads and AC Loads are the same.

AC-Load can also have other loads what are not connected behind the Multi and that delta is shown.

2 |3000

Up to 8 attachments (including images) can be used with a maximum of 190.8 MiB each and 286.6 MiB total.

Related Resources

Additional resources still need to be added for this topic