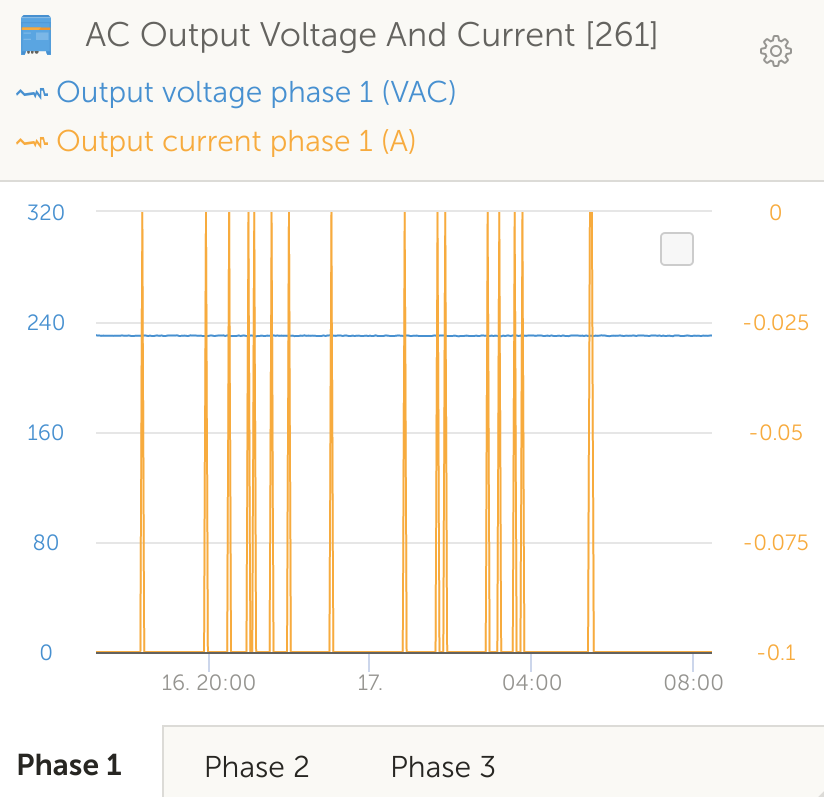
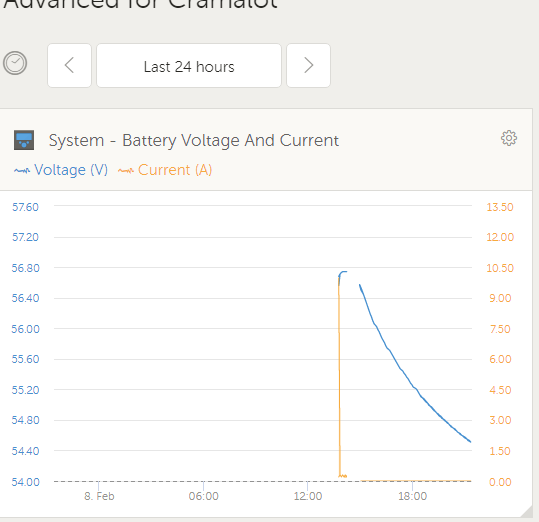
Scaling of the charts in VRM is sub-optimal. Often there is too much headroom or floor or both or offset "wrong":
excessive headroom:
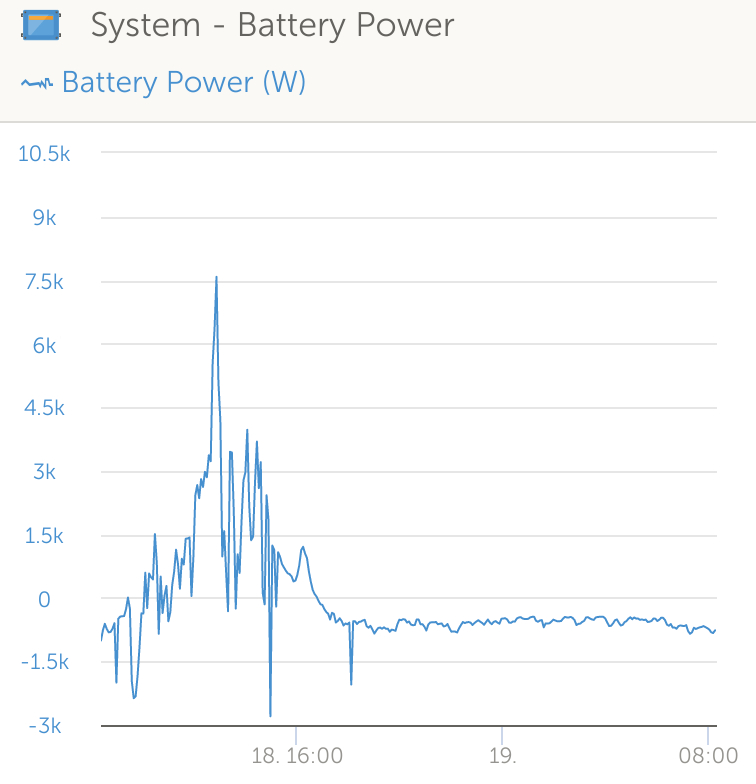
both (+ offset) - thus too coarse:
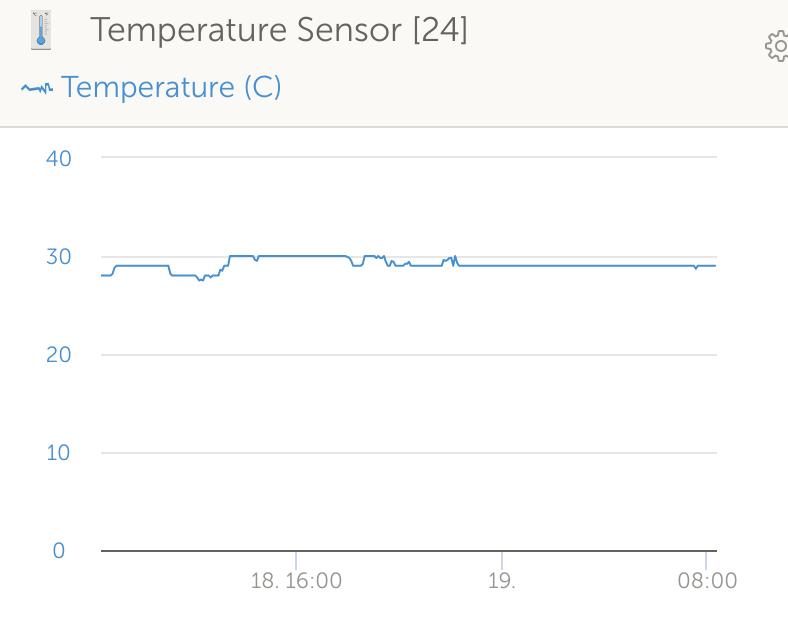
Another instance of the same problem:
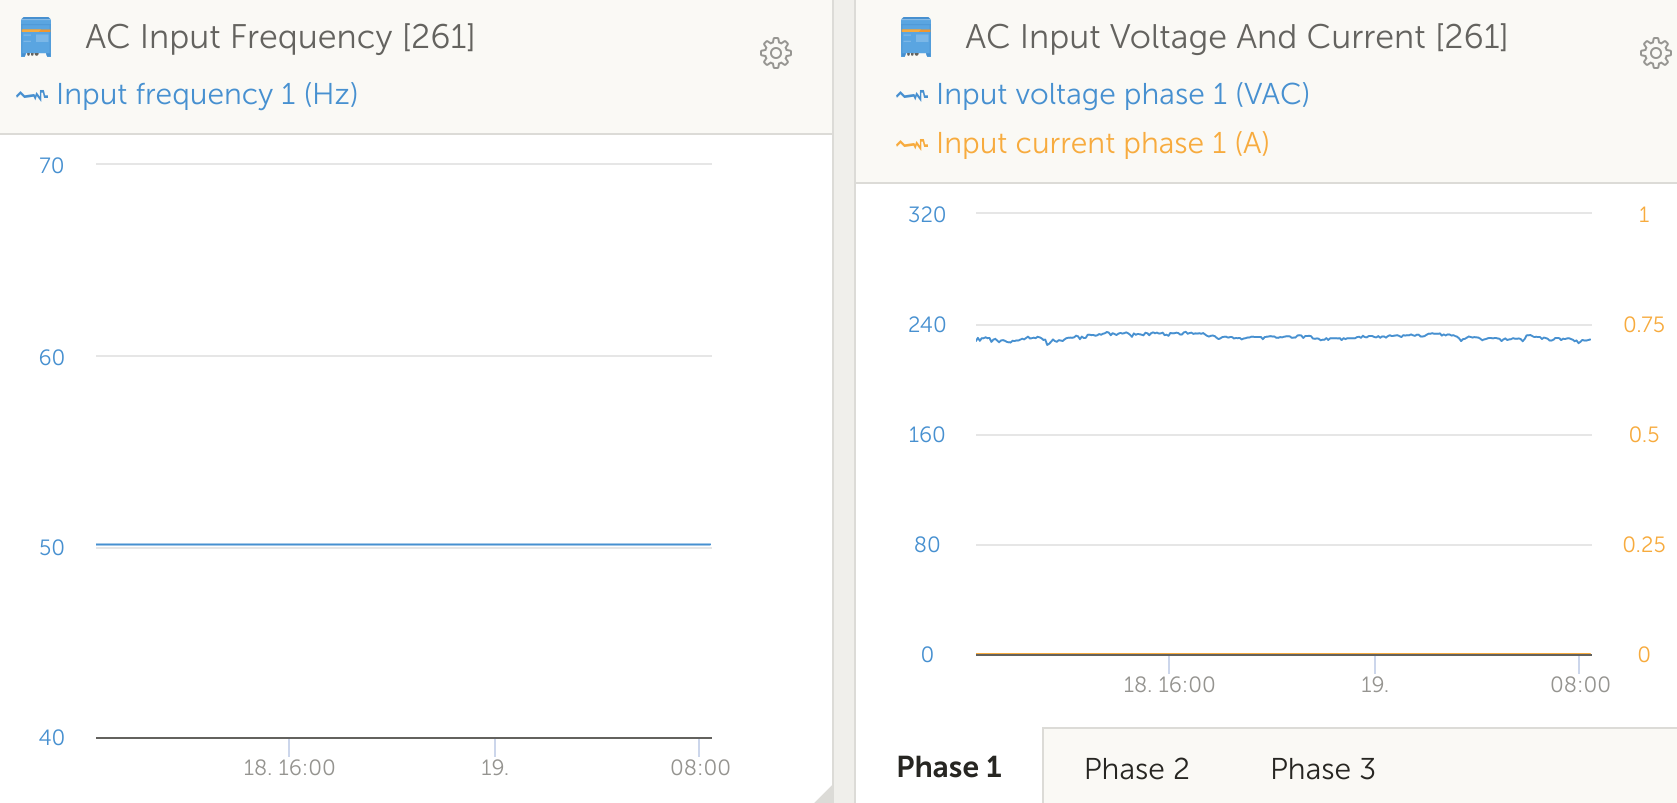
Actually also an instance of excessive headroom:
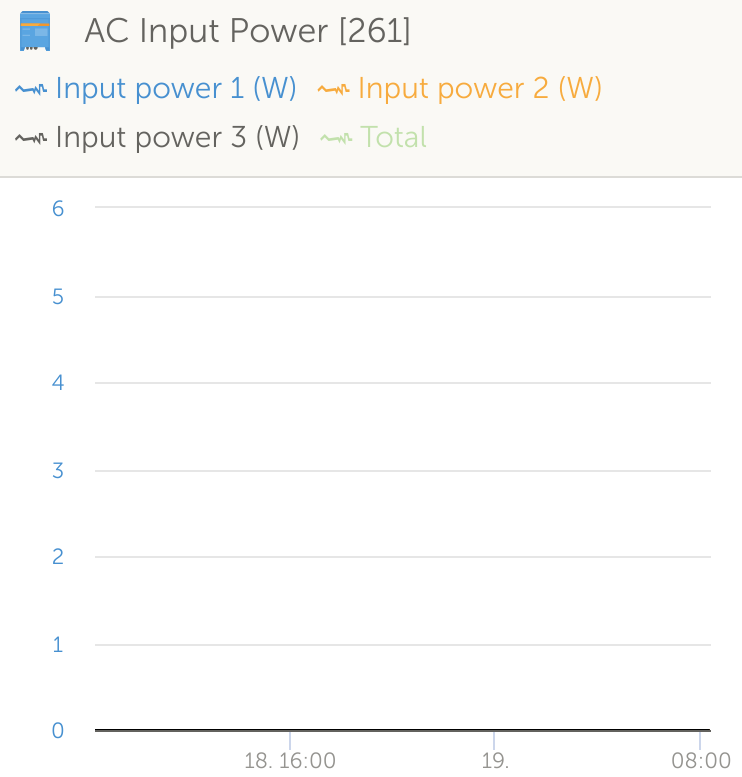
If you're looking for the input power wattage: It's 0
Usually this could have been shown with the 0 in the middle of the chart with 1 above and -1 below it, so it would not be hidden in the X-axis.
All these screenshots are taken at the same time and show the usual modus operandi of the VRM charts. There's quite some room for improvement there - IMHO.
I should mention, that this does explicitly NOT apply to values that have a given fixed range - e.g. battery SoC (0-100%)
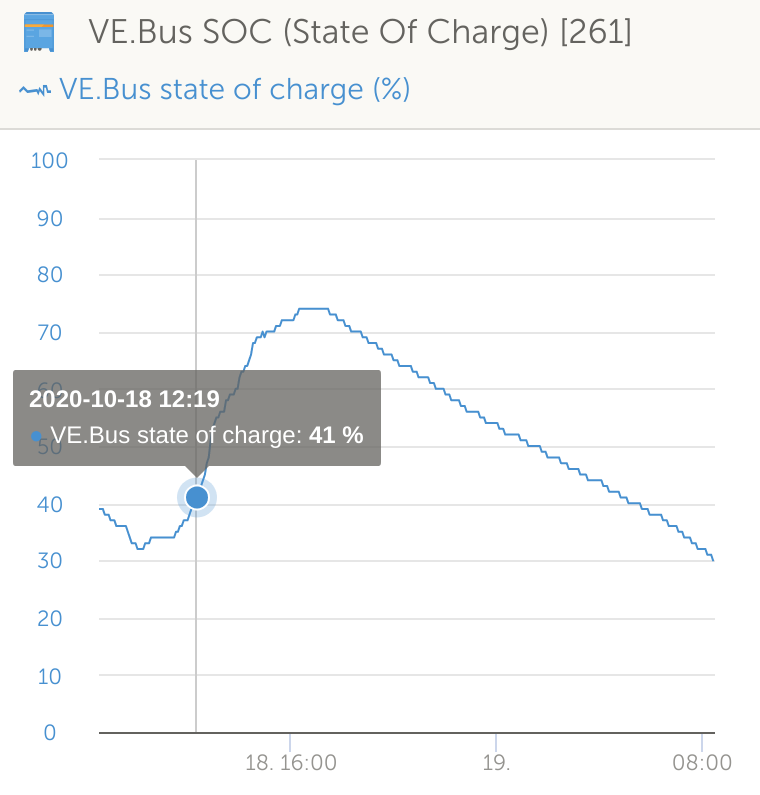
This is good as-is.

