Hi, Anyone other than me think this is a (huge) problem?
is VRM a tool for presentation of history?
I think yes, and a greate tool for system monitoring... BUT...
all data logged when cames to history and peak loads are close to useless...
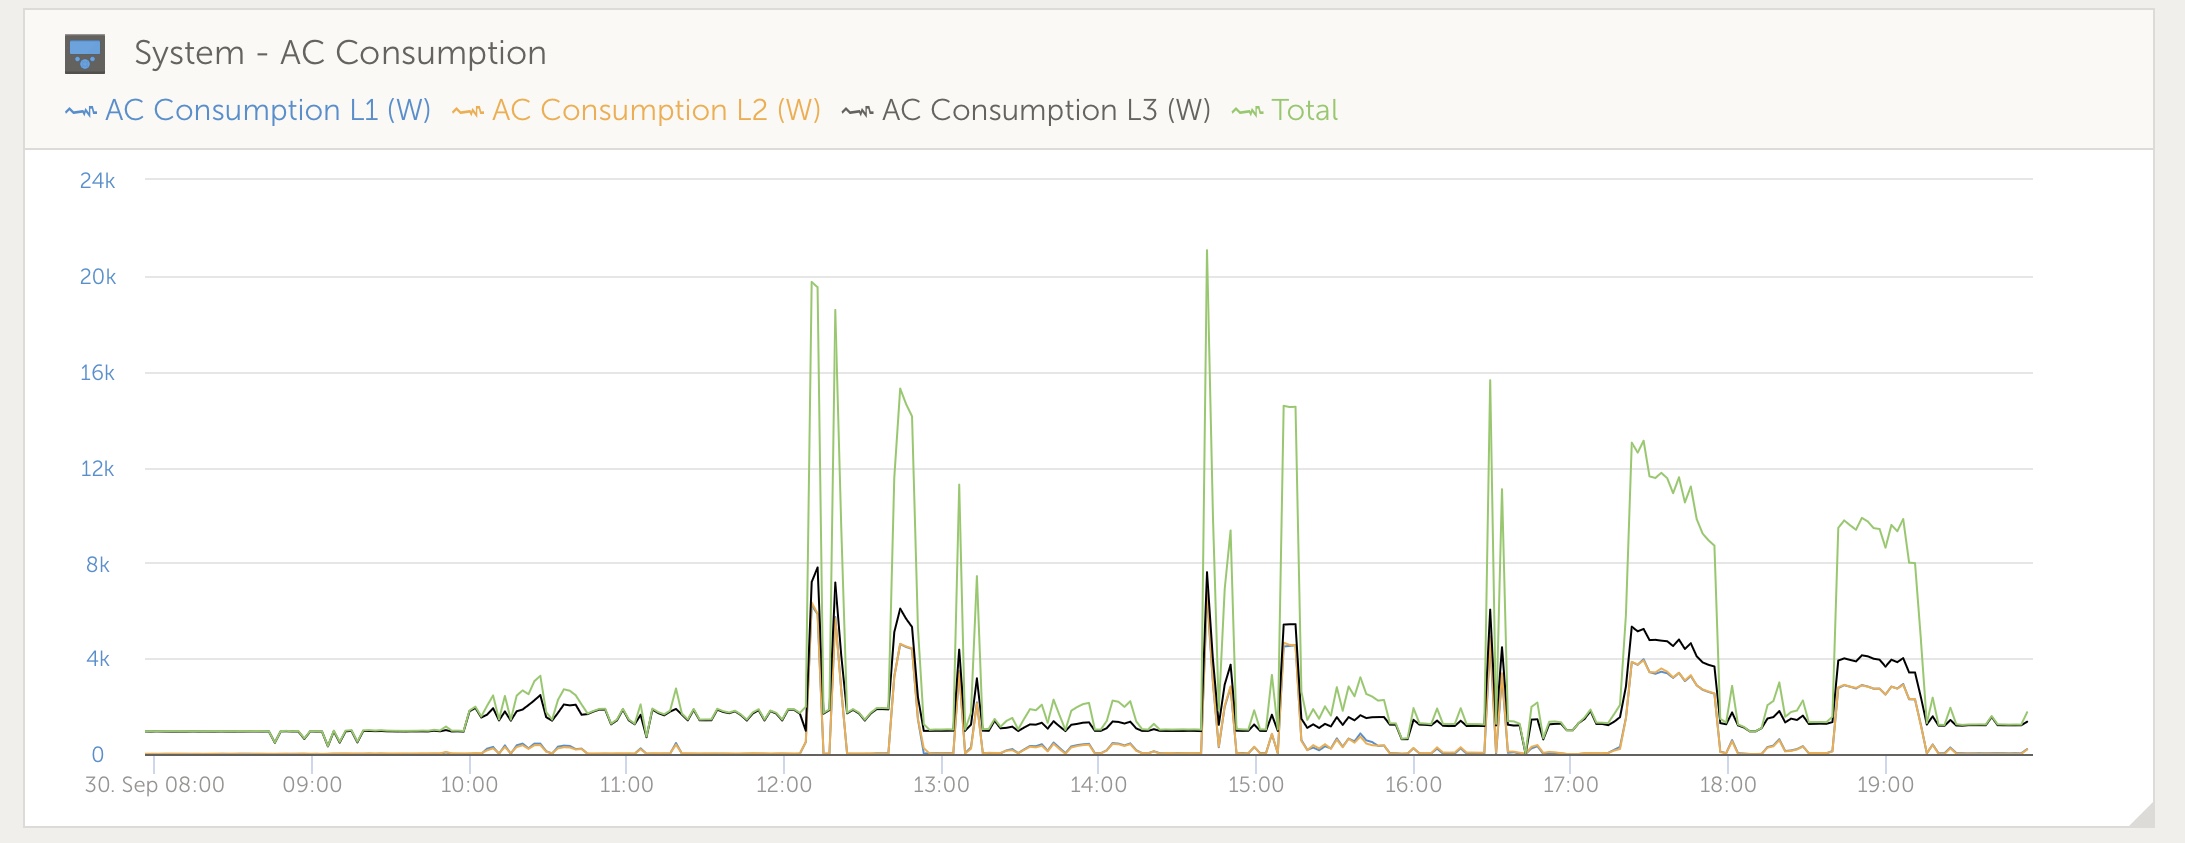
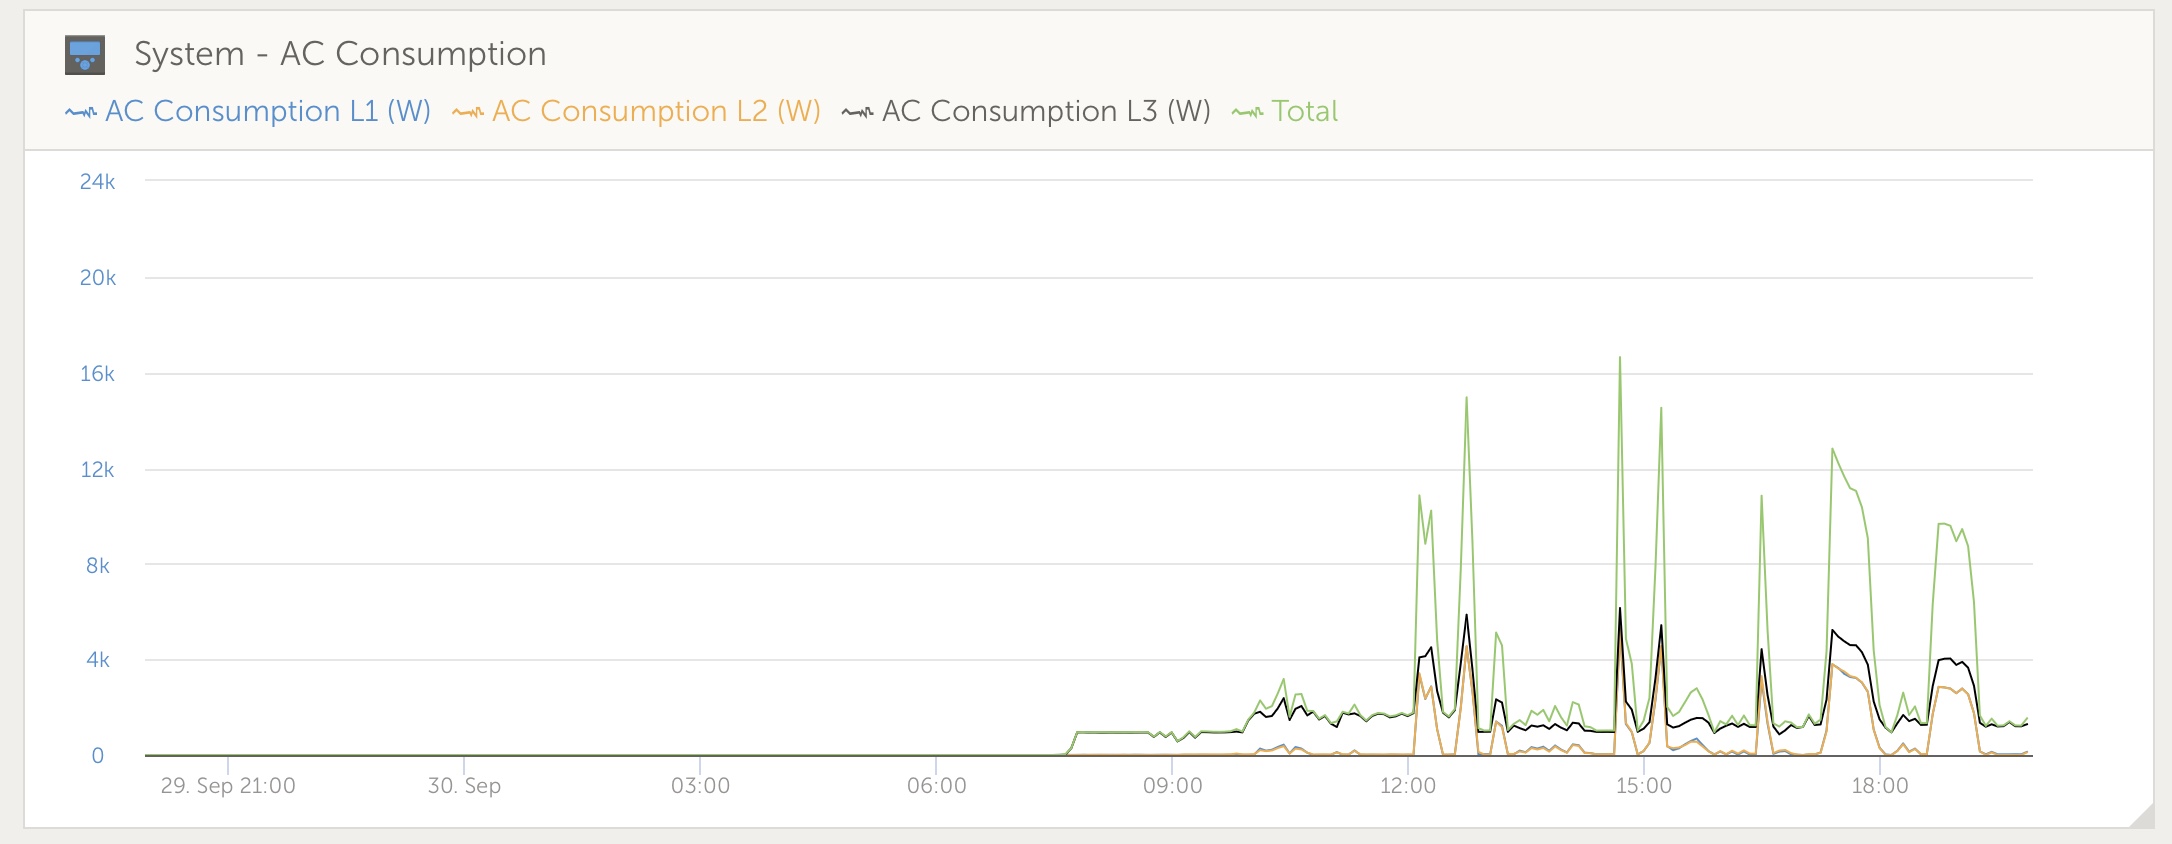
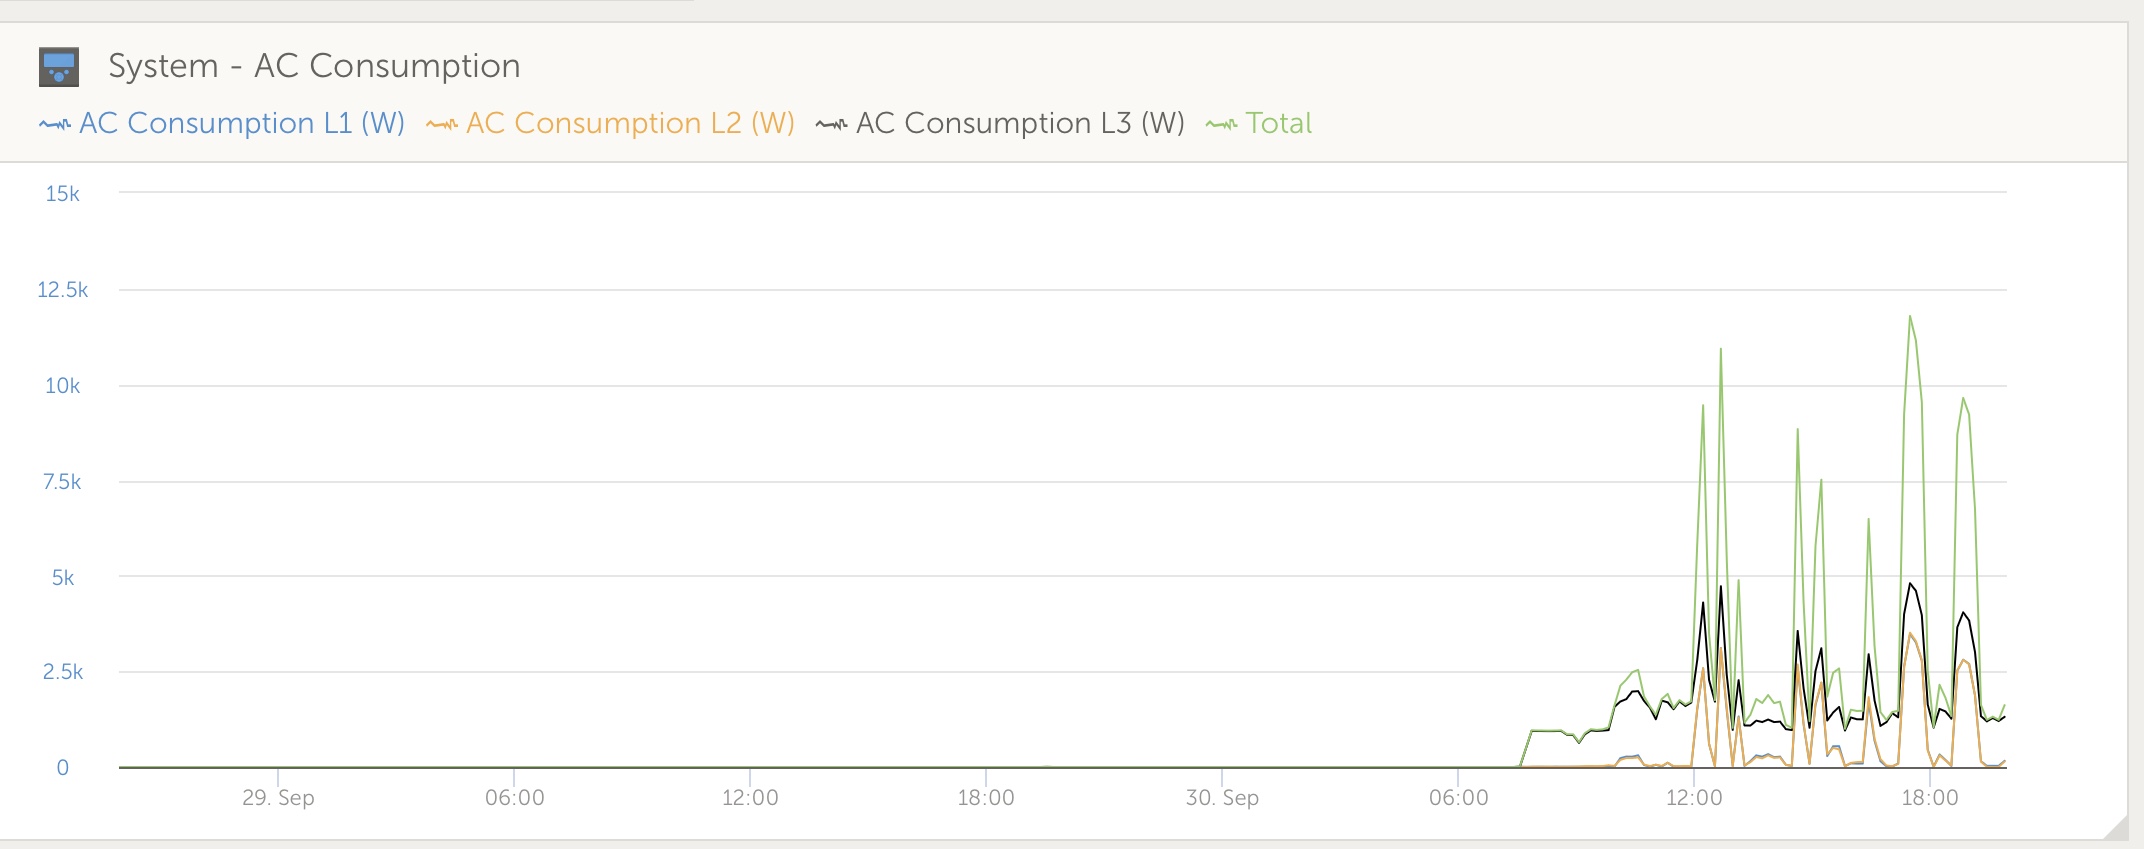
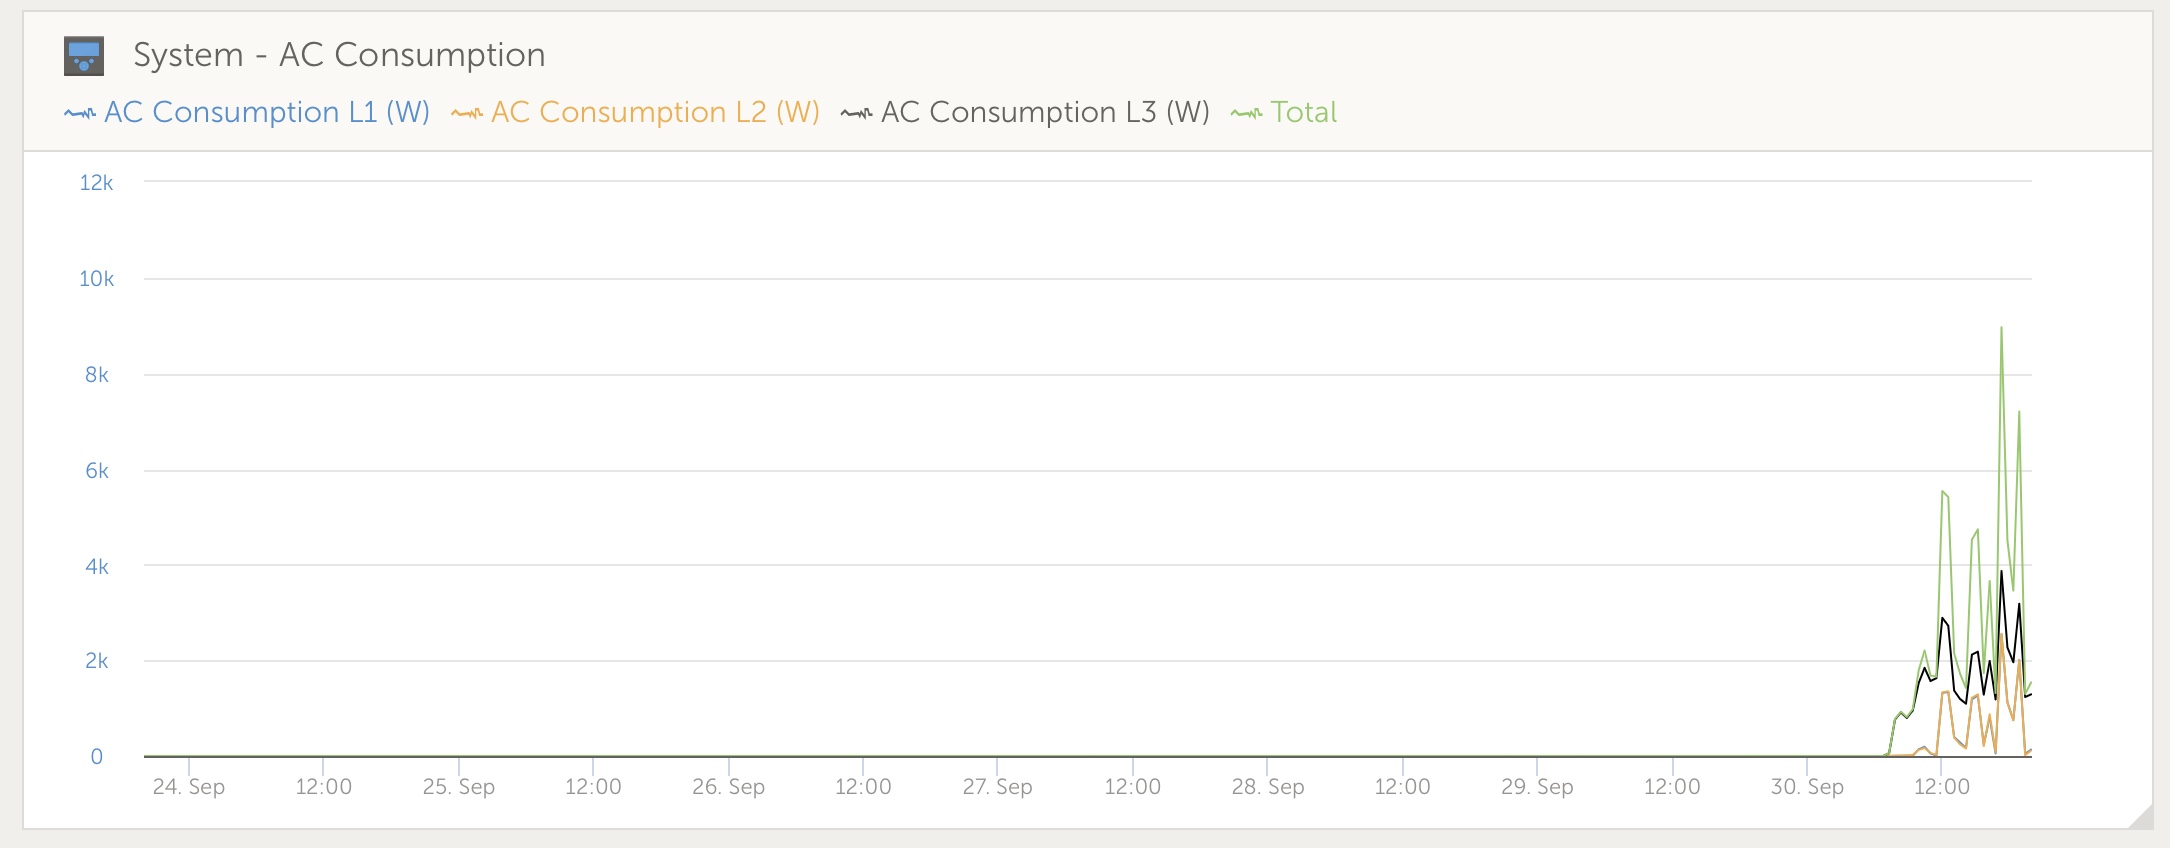
The pictures below show a overload on a 90 kVA Inverter system!
Tell me... what can we use this pretty pictures for other than it fals give an impression that system has only a 10% of its max load ? :-)
Is it a feature? A bug? Even a analog, 1980 home entertainment system had Vue meters with peak hold function........ Most cheap multimeter has the function as well.
(And actually.,, the year 2013 Color control gx was able to log peak loads down to a secound peak easy. And also show it on the excel download.
we used it that time as documenting peak load ability. Not any more..
now days not even close to real load data is logged in venus devices...
yes, i know i have posted once before about it.That time on soc view.
But no more information about what is concluded.. Only recognised it may be a problem....
is it an design feature? A bug? if recognise its a fail, what is the plan?
the tool has been broken now for years. If use api to pull data, the data will be false, and not show actual loads and therefore not showing actual problems for a system.
Today we need 3. Part dataloggers to give a any realistic presentation of load to our customers.
any info from Victron ? Is it a recognised problem? If so, what is the plan, and when...


