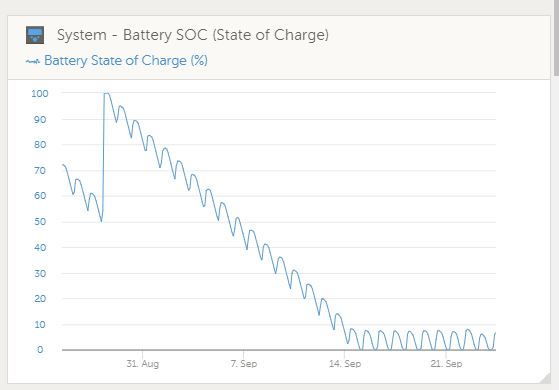
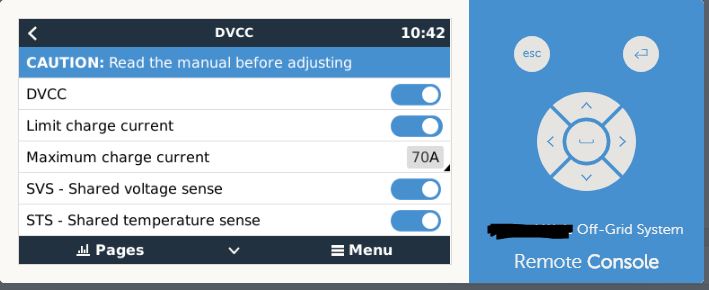
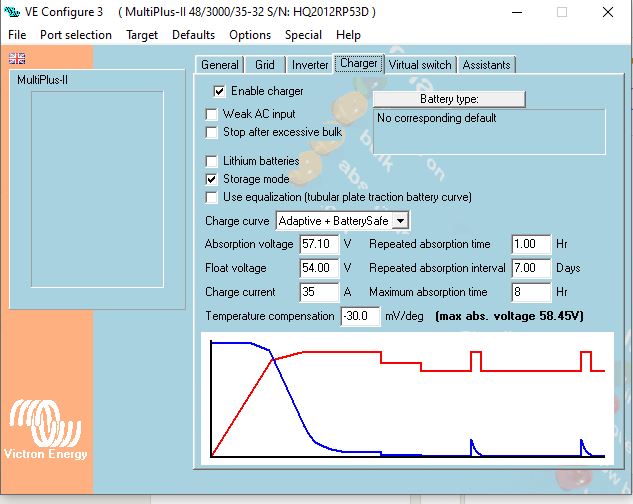
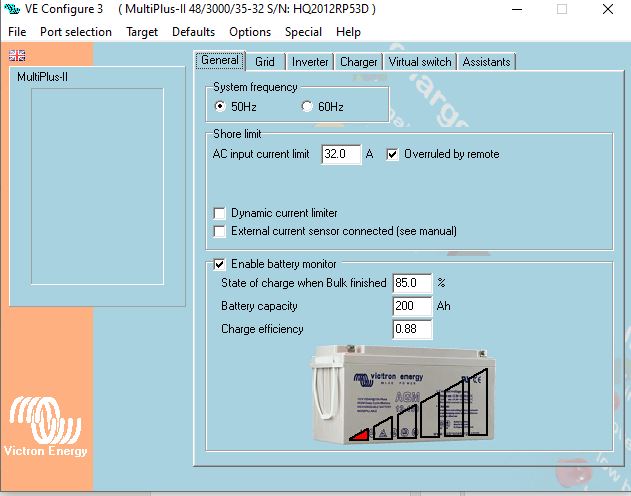
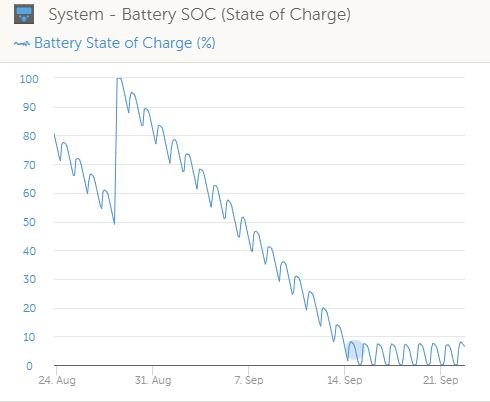
The State of Charge is displayed incorrectly on the Colour Control GX display and it's showing a drifting pattern towards 0%. A the moment the SOC reaches 8% during the day and goes down to 0% over night, even though the batteries are fully charged up.
We have the following components in an off-grid system we installed for our client:
1 x Victron SmartSolar MPPT 150/70-Tr
1 x Victron Multiplus-II 48V/3000VA 35-32 inverter charger
1 x Victron Colour Control GX
4 x Deep Cycle AGM Battery 12V 200Ah C20
12 x 330W solar panels
The system is connected to the internet via VRM.
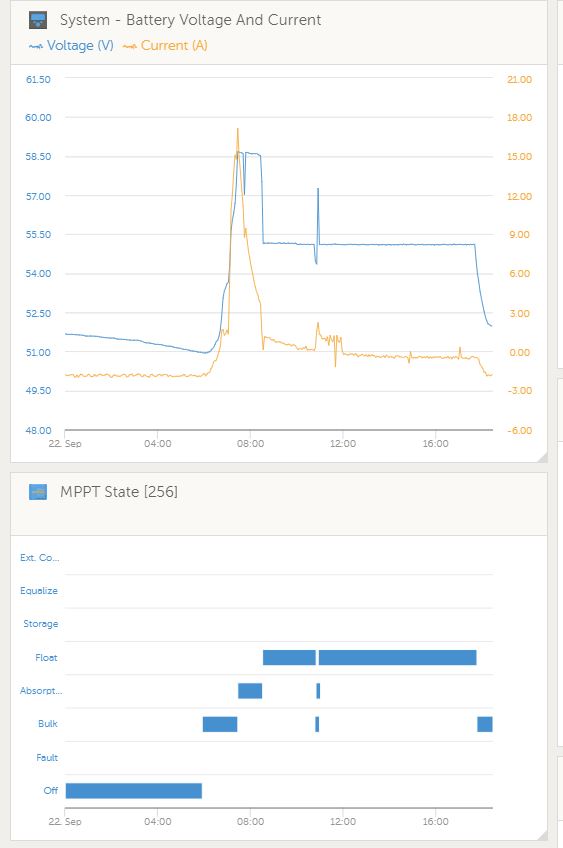
The MPPT charge controller charges the batteries up, by 8.30-9am in the morning and then goes to float for most of the day.
Why is the SOC displayed incorrectly?
Technical support from the distributors suggested installing the BMV or the Smart Shunt to fix the issue. However, the Victron manual says this is not required. The site is far away from our office.
Can anyone point me in the right direction how to fix this issue?
I've read the other threads with similar issues but the solution proposed didn't work for me.
I really appreciate your advice.
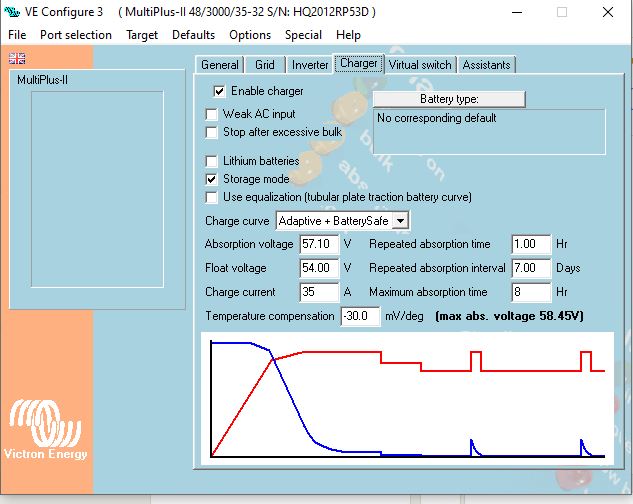
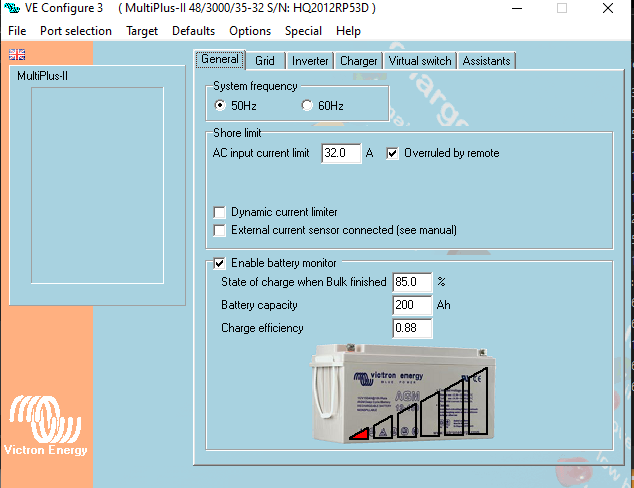
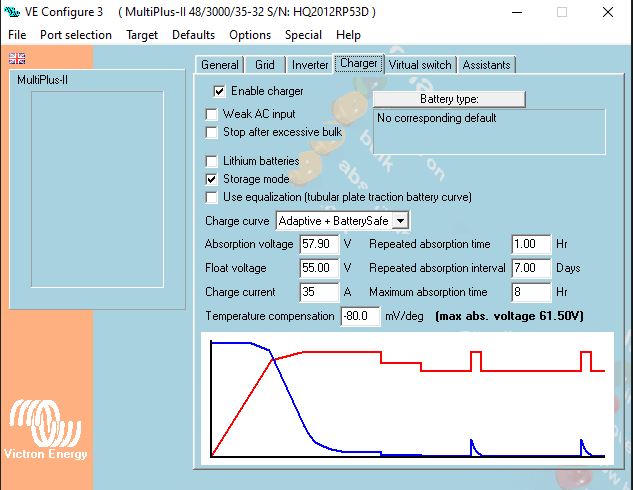
Here are the settings from VE Configure on the Multiplus II:
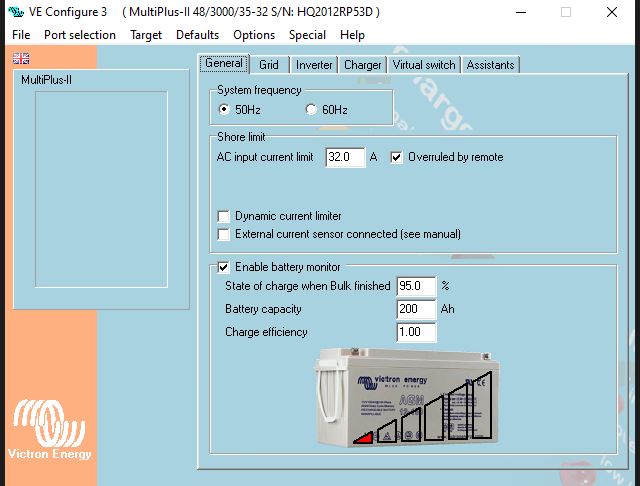
Here the SOC graphs from the last 30 days:
Here the voltage, current and MPPT status from today:
