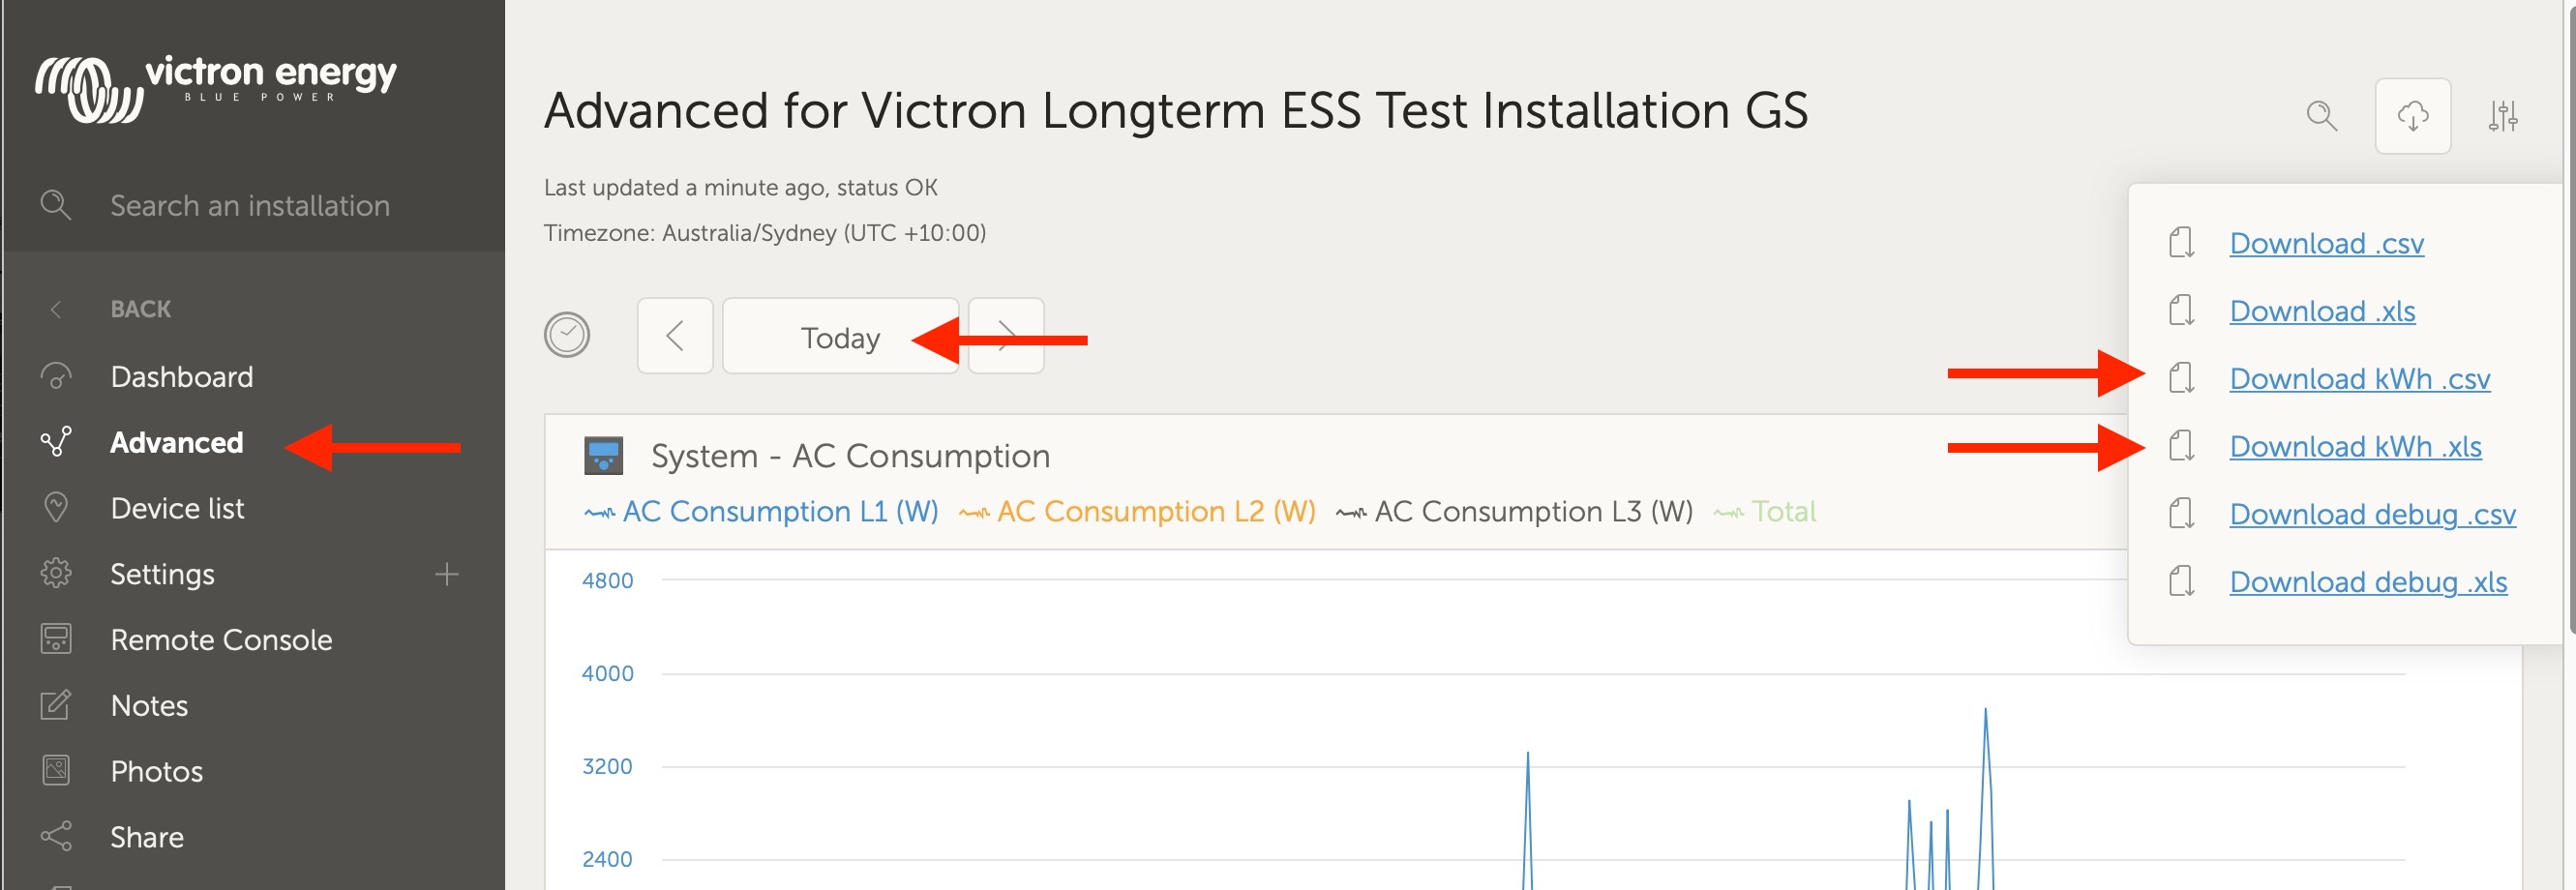
As we all know VRM is a very handy interface for getting details about power consumption and production.
While already a powerful tool, I’d like to see a small modification to the VRM consumption screen. Currently the summary graphs default to last 24h, 7d, 30d, and 365.
It would be be extremely handy if that graph (or another screen) also included a summary of consumption, solar, and genset numbers based on the date range you provided in the same screen. Currently to sum up power usage for a date range, one must manually add up each graph datapoint.


