question

camissa avatar image
camissa asked

Documentation for VRM Widgets

Now I have this nice, big new installation in my house. Many blue boxes, a colour display and access to a portal with sexy widgets. I paid a lot of money for it.

But where is the documentation? Where is the manual that tells me: "this is what the data in those widgets means. This is how you interpret the data."

In the documentation this section is empty and says: to be done. This was a year ago.

So where is it?

VRM
2 |3000

Up to 8 attachments (including images) can be used with a maximum of 190.8 MiB each and 286.6 MiB total.

5 Answers
JohnC avatar image
JohnC answered ·

Hi @Camissa

With the greatest of respect..

The VRM portal is essentially a collation of 'answers'. Meaningless unless you have a question. What do you want to see there? Perhaps your installer could help you decide what to watch for.

If you know what you want, it's there, and rarely needs explanation. How to 'interpret' it is for you and your own situation. Virtually impossible to document this sort of stuff beyond basics.

A silly analogy would be buying a new car and asking what the fuel gauge is for. And VRM akin to the diagnostic computer your serviceman uses. Power generation is perhaps somewhere in the middle of those extremes, but I'm just trying to get a point across.

I love my VRM, and know what I want from it. I can't use all the widgets, just select what I need.

So should you, once you determine what you need to see. Again, with respect..

2 |3000

Up to 8 attachments (including images) can be used with a maximum of 190.8 MiB each and 286.6 MiB total.

Guy Stewart (Victron Community Manager) avatar image
Guy Stewart (Victron Community Manager) answered ·

Hi @Camissa,

I have done some work in this regard, and I also have plans to do more, including some more problematic system case study diagnosis.

I know VRM is super valuable in the right hands, and the more demand I get for documentation to support it, the more time I will put into creating it.

I have created an online training video here, and is found with a VRM exam in Victron Professional Online Training -

https://youtu.be/FJF3QpAOkMQ

The Table of Contents for that video

0: 56 - Fleet overview

1:40 - System dashboard overview

6:19 - Advanced overview

9:51 - Spreadsheet export overview

12:37 - Device list overview

13:10 - Setting up CAN-bus on a GX device

14:07 - Remote VEConfigure for Multiplus

15:09 - Remote firmware update

16:06 - Unlinking, deleting or replacing a site

17:48 - Setting up users

18:50 - Alarm rules

21:10 - Off grid example

You will see that there has already been some user interface design changes since that video was made, so now it is actually done differently with how the data is sorted in the Advanced Tab.

There are more changes coming for VRM and once those are deployed I will make a new training to explain how it works.

1 comment
2 |3000

Up to 8 attachments (including images) can be used with a maximum of 190.8 MiB each and 286.6 MiB total.

Keith Arnold avatar image Keith Arnold commented ·
Just a suggestion is to add a i (info button) to each widget that will pop up more detail of exactly what the measurement is.

Could the Dashboard names ( I find them more meaningful and gives a picture story) be the same in the widgets? eg I select system critical loads, gives me 2 line graphs, huh? Is this the same as inverter output power? Is dashboard AC Loads (Grid Loads) = to widget AC Consumption? Having different names can be confusing.

Are you able to add AC coupled inverter PV yield (for each mppt or total) On the Dashboard.

thanks.

1 Like 1 ·
camissa avatar image
camissa answered ·

Thank you for the link, Guy. Sorry if I came across rude. That video helped a bit. A two line, brief explanation of the counters for each of the hardware devices. That is all I am looking for. I can guess for some of the widgets what they mean and I think I created a meaningful portal for me. But as I said, a bit of documentation or even a some examples for typical deployment scenarios would be great.


The company that originally installed my solar system set it up all wrong. Now I have a new service company and an updated system and all is fine. But I have learned that here in South Africa a certain level of independence from a service provider is pretty healthy.

2 |3000

Up to 8 attachments (including images) can be used with a maximum of 190.8 MiB each and 286.6 MiB total.

Herbert Müller-Rossbach avatar image
Herbert Müller-Rossbach answered ·

My DIY ESS with MPII-GX, CAN-Bus BMS Battery and Victron MPPT is installed and running.
I am very pleased with the system, great job Victron.

But more than two years after this initial posting the objection of @Camissa is still valid.
The advanced tab offers great information, but I need to know, what the figures actually represent, without guessing, without assuming. Not in every case the names are self explaining.
I even hooked up my old efergy energy meters to verify that I am correctly interpreting the readings in the VRM graphs.

@Guy Stewart (Victron Community Manager)
Please add the following information to your VRM Advanced Tab documentation:
A listing of all parameters offered for visualisation with explanation where they are measured in the system and any other relevant explanation.
This will avoid that new users of the wonderful Victrom equipment have to spent time on backward engineering. :-)

Please let me know, if I overlooked the information.

@JohnC I agree with you, that VRM is great. Nevertheless made Camissa a valid point.
It's great to have all the widgets and as an Engineer (MSEE) I know what I need , but I need to know how Victron has named the figures, respectively what the name really mean in the system.

1 comment
2 |3000

Up to 8 attachments (including images) can be used with a maximum of 190.8 MiB each and 286.6 MiB total.

JohnC avatar image JohnC ♦ commented ·

Hi @Herbert Müller-Rossbach

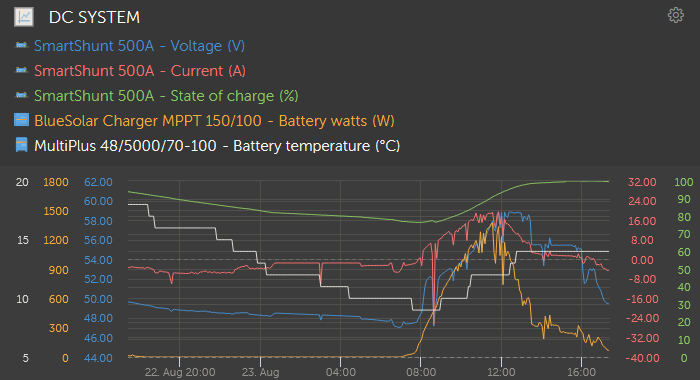
Things have actually changed a little in those 2+ years. This became necessary when the Custom Widgets feature was introduced, and sometimes the name of some of the custom widget components became 'uncertain'. So they expanded the name to include the source. As here..

1661239539734.png That source was always available as a checked selection where you select the standard widgets, but with the custom ones you now have this shown above the graphs.

DVCC might confuse some people, as the 'System' readings might not be the same as from individual components. The graph above reminds me of where my DVCC is getting it's data from, as those were selected to make the custom widget.


0 Likes 0 ·
1661239539734.png (60.8 KiB)
johanndo avatar image
johanndo answered ·

Oh, come on guys, the VRM portal is self explaining, there are no questions open, that really need a documentation. It is a mirror of your GX display.

The dashboard gives you the system overview like the GX and some aggregated statistics of a time period of your choice.

The Advanced tab gives you exactly the same data you see on the GX detail pages over time in a graphical and numeric representation.


Tension (Voltage, Volts) are always the readings from the Devices Current (Amperes) the currents flowing in and out of that devices, and Power obviously the Power (Watt) at this inputs and outputs, temperatures are the readings of the sensors attached to the selected device and so forth. In the ADVANCED tab all measures are like measures from isolated devices you look into the specific blue box of your choice, measurements are not summerized like in the overview page (except for the system overview device, that is virtual and does not exist as blue box - that is for conveniance).


You have to interpret this values yourself, if they are meaningfull in the context of your installation or not.


Look at the Voltages. Why are they different at the MPPT controller, Inverter and Battery? Because there are currents flowing through your wires, breakers, fuses, distribution panels, busbars and infrastructure, and that causes Voltage drops between source and load, they can be different without a current as well, then there is an open connection (blown fuse, open breaker, bad connection, BMS turned on protection measures). You need to understand the basic principles of electricity (V,A,W,Ah,Ohms), then you can read the figures like a book and troubleshoot your installation.

The explanation what you see and why it is what it is, is very specific to your system design and installation, no two installations are the same, same setup and configured the same way and your figures will not apply to a different set up. But the basic principles apply everywhere, regardless of the brand used, they are not Victron specific - they are universal.


2 comments
2 |3000

Up to 8 attachments (including images) can be used with a maximum of 190.8 MiB each and 286.6 MiB total.

Herbert Müller-Rossbach avatar image Herbert Müller-Rossbach commented ·

Hello @JohannDo, I am not sure what my request has triggered on your side to call it more or less illegitimate and to start teaching an electrical engineer the ohm's law??

It seems you are familiar with your Victron system on your boat. That is fine for you.

Despite all your writing, there is a clear documentation missing regarding the optional parameter of the advanced tab.

0 Likes 0 ·
johanndo avatar image johanndo Herbert Müller-Rossbach commented ·

I only tried to help you out navigating through the advanced tab as you seemed to be lost and wanted help to get started, and especially because you requested to know what the data represents and where it comes from. It represents the sensor reading of the respective device, and I gave you the explanation why you may see different values there - because this was your question.

Here is the documentation you asked for - all the data Victron is gathering by device classes.

https://github.com/victronenergy/venus/wiki/dbus

Not each device provides all parameters, some are common, some are not. In the Advanced tab is a selection of the essential parameters, mainly watts, volts, amps per device. Each device class has one widget with one or more graphs that can be activated. There may be 3rd party devices, like BMS, energy meters, alternator controllers, temp sensors, tank sensors etc. for which Victron has some templates, but it doesn't mean they are used or populated with all possible information, the vrm widgets evolve over time, new hardware is added, parameters are obsoleted sometimes and replaced by new...

The matter of the fact is, what you see is what you get and it is usually self explaining, as you see the exactly same data on your cerbo in the device details, it is actually a sub-set of what the cerbo displays over time.


If you have a specific question for a particular widget you don't understand, please post a screenshot, then it would be easier to understand your point.

0 Likes 0 ·