question

Andreas Åström avatar image
Andreas Åström asked

VRM Installation Data System Overview (Generator bars not showing)

Hi there,

I just got my AC coupled Victron / Fronius off-grid system up and running and I'm loving the experience so far!

The system is not fully commissioned yet...

Current setup:
7360 W PV (16 panels split up into two strings)
2x5kW Fronius Primo Gen24 (Limited PV output to 3kW due to battery bank limitation)
1xVictron Multiplus-II 48/8000/110
4S2P 65Ah AGM Led Acid battery
1x3.5kw Inverter Genset
1xVictron Cerbo GX

Future:
15kWh LFP battery on the way.
16 more panels are going up and will increase output once the LFP battery has been commissioned.
Likely going to get another LFP battery and still not sure if I'll go for an auto-start generator.


Anyhow, now to my question...

My system is fully off-grid and I'd like to see generator contribution along with solar contribution.

The graph in the overview has a series name/data label for generator and it's briefly shown on page refresh but then the bar disappears. I can see it under consumption and generator but not in the overview.

I've done a screen capture here to show the behavior. It does look like a bug to me.

https://www.loom.com/share/b60860e9a2e848cf870b2f874e9773fb?sid=f5180147-3003-4116-965b-a4cff929c74b
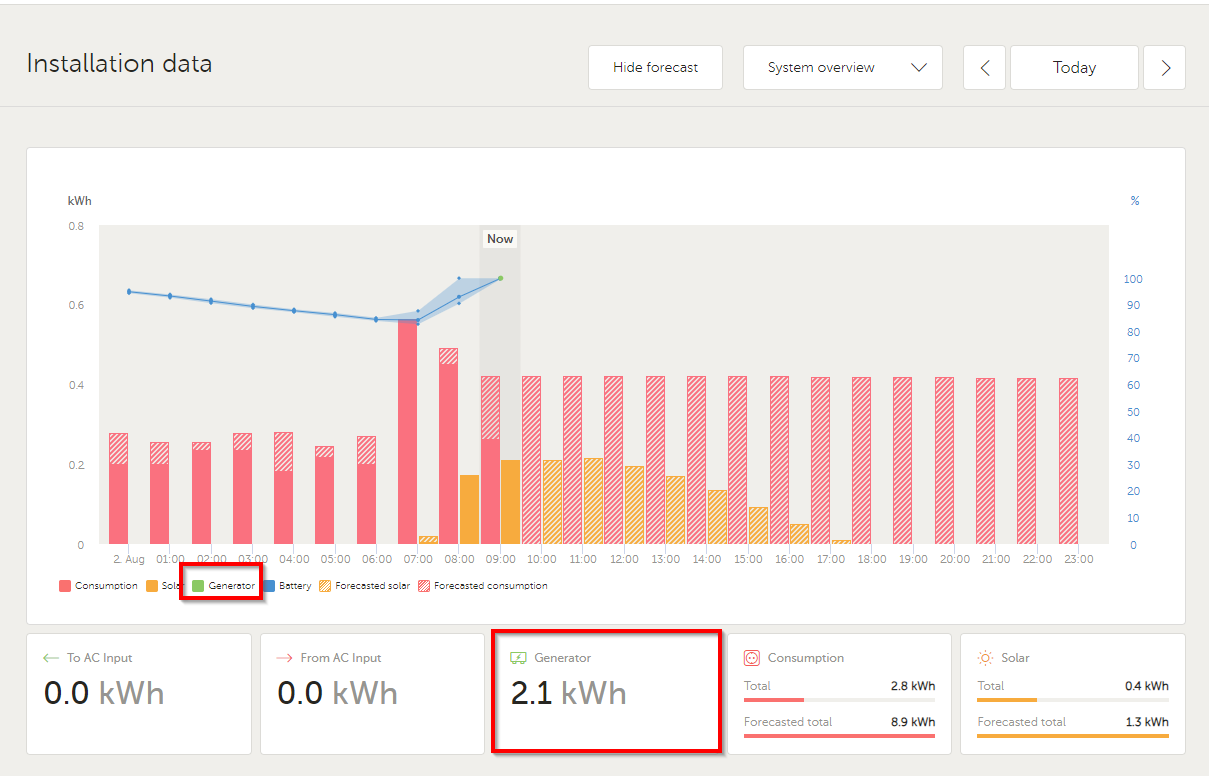
2024-08-02-09-48-52-franklin-power-vrm-portal.png

VRMGeneratoroffgrid
2 |3000

Up to 8 attachments (including images) can be used with a maximum of 190.8 MiB each and 286.6 MiB total.

6 Answers
Guy Stewart (Victron Community Manager) avatar image
Guy Stewart (Victron Community Manager) answered ·

Hi @Andreas Åström,

The team think they have found the bug, it is now undergoing beta testing before production release.

Can you please test it again here - https://betavrm.victronenergy.com and report back?

1 comment
2 |3000

Up to 8 attachments (including images) can be used with a maximum of 190.8 MiB each and 286.6 MiB total.

Andreas Åström avatar image Andreas Åström commented ·
That's working now. Well done to the team! Thank you
0 Likes 0 ·
Andreas Åström avatar image
Andreas Åström answered ·

Another interesting observation...

The generator data is shown in the historical view (but not in the "today" view when data is being actively collected).

2024-08-02-10-55-20-franklin-power-vrm-portal.png


2 |3000

Up to 8 attachments (including images) can be used with a maximum of 190.8 MiB each and 286.6 MiB total.

Andreas Åström avatar image
Andreas Åström answered ·

...and some more details on behaviour. The battery bars are shown when disabling forecast.1722574649786.png


1722574649786.png (58.7 KiB)
2 |3000

Up to 8 attachments (including images) can be used with a maximum of 190.8 MiB each and 286.6 MiB total.

Guy Stewart (Victron Community Manager) avatar image
Guy Stewart (Victron Community Manager) answered ·

Hi @Andreas Åström,

Thanks for the detailed report, I'll pass it on to the VRM team.

2 |3000

Up to 8 attachments (including images) can be used with a maximum of 190.8 MiB each and 286.6 MiB total.

Andreas Åström avatar image
Andreas Åström answered ·

Hey @Guy Stewart (Victron Community Manager) thanks for picking this up. Can I then add in a suggestion... Why not use stacked bar graph for the input (PV, battery and generator) next to consumption for each time aggregation? It would make it intuitive to visually compare input with output.

2 |3000

Up to 8 attachments (including images) can be used with a maximum of 190.8 MiB each and 286.6 MiB total.

Andreas Åström avatar image
Andreas Åström answered ·

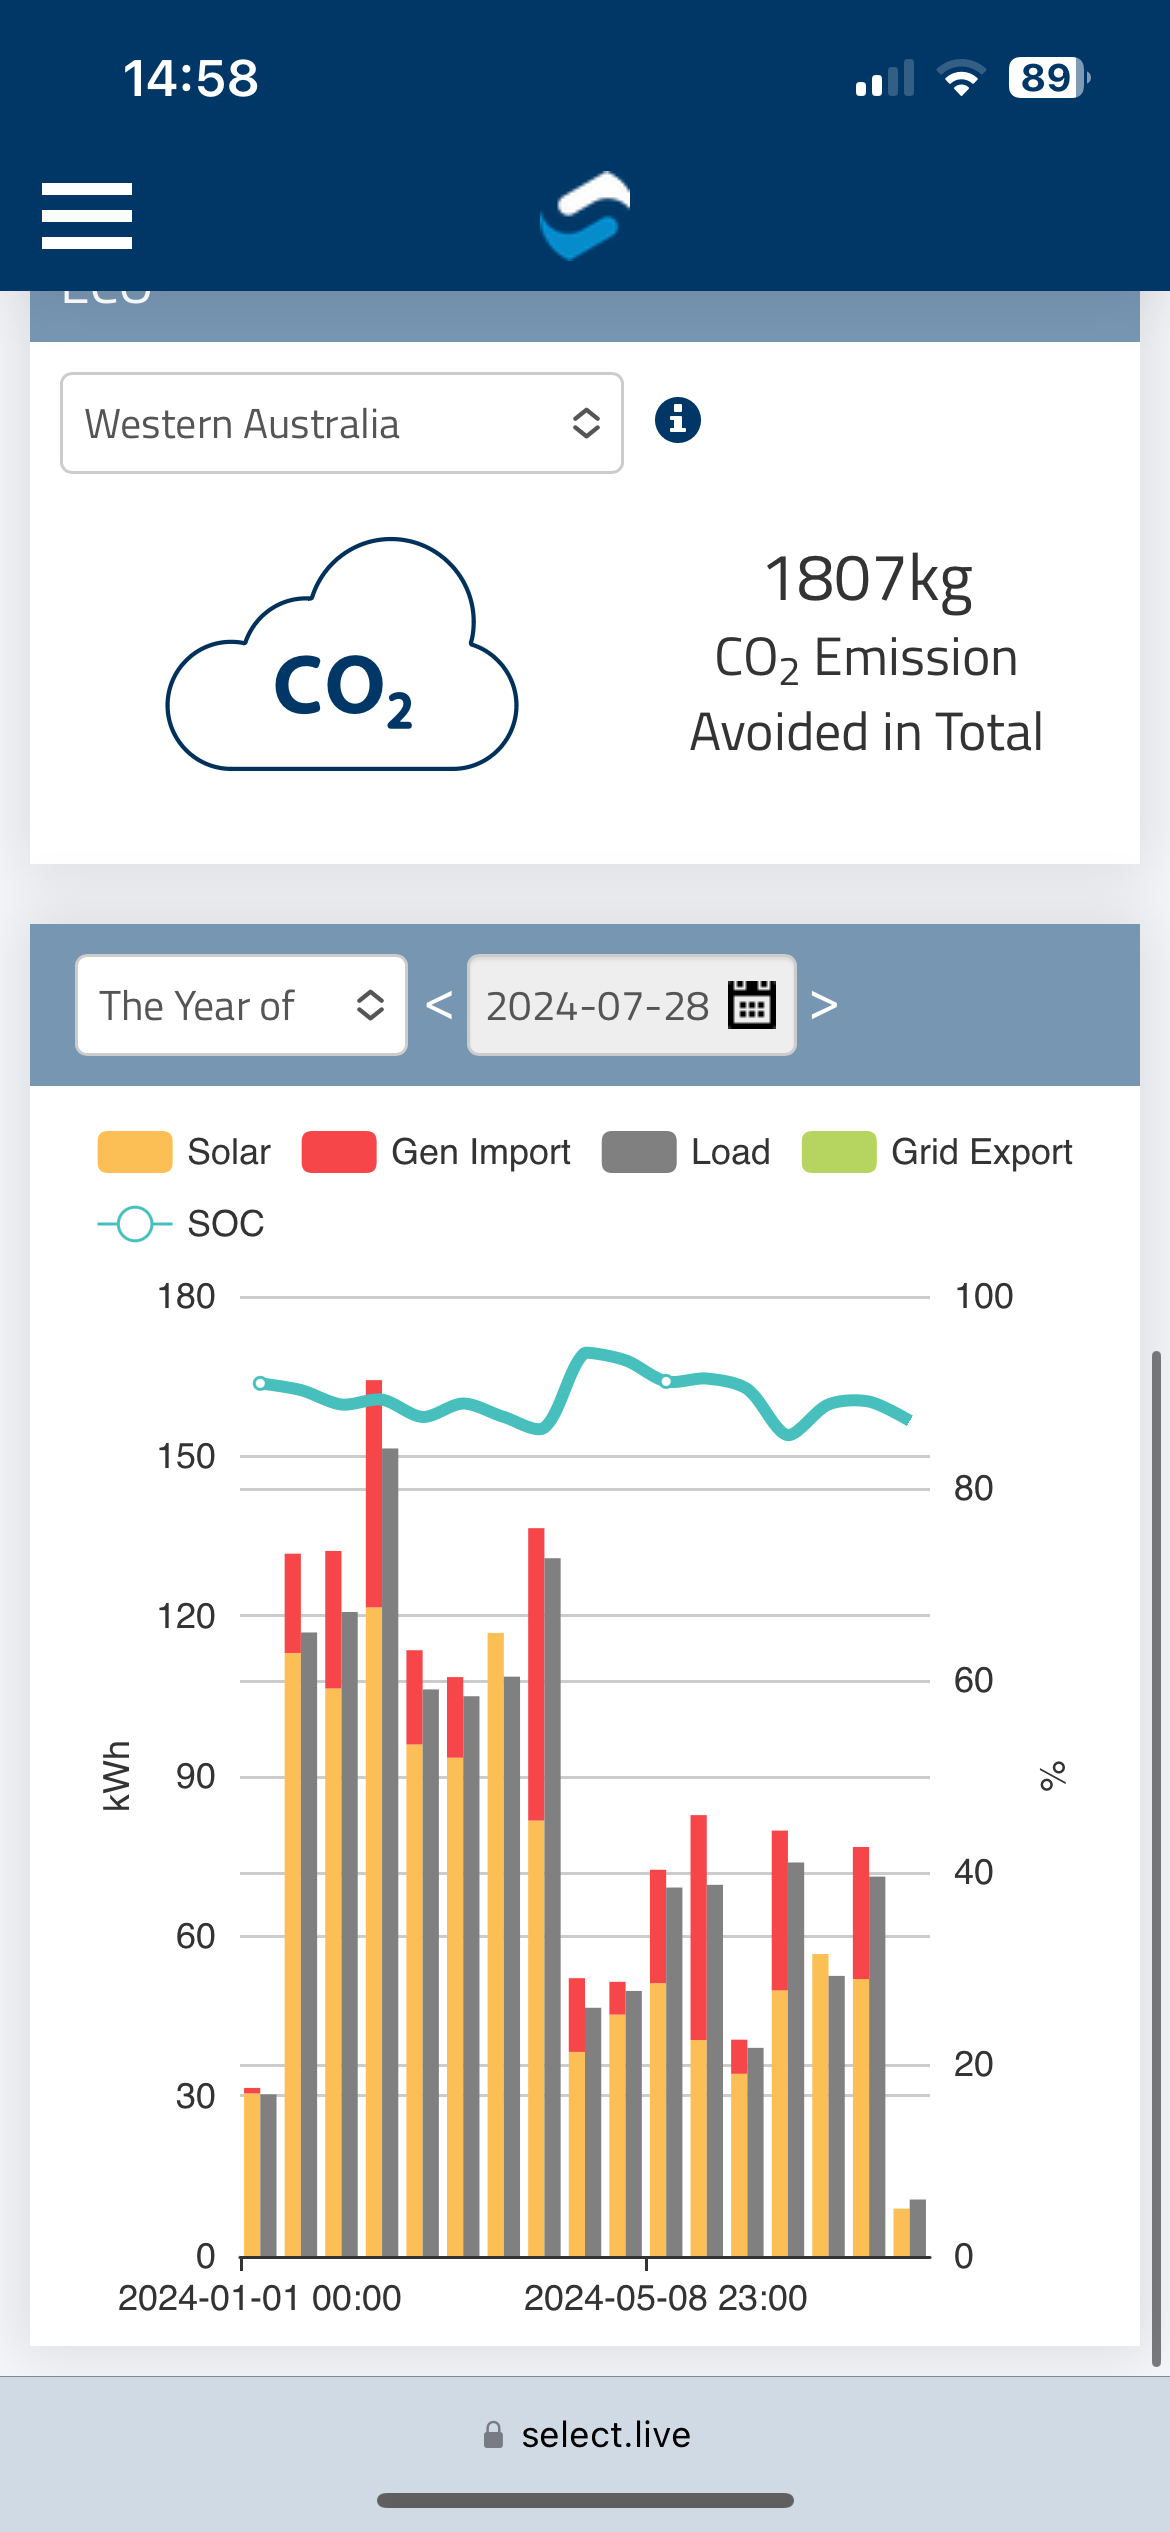
Victron is miles ahead of Selectronics when it comes to observability, interoperability and integration capabilities in general but this is how they visualise the system overview since a picture says more than a thousand words.


img-6331.png


img-6331.png (187.9 KiB)
1 comment
2 |3000

Up to 8 attachments (including images) can be used with a maximum of 190.8 MiB each and 286.6 MiB total.

I've passed on the suggestion to the VRM design team

0 Likes 0 ·