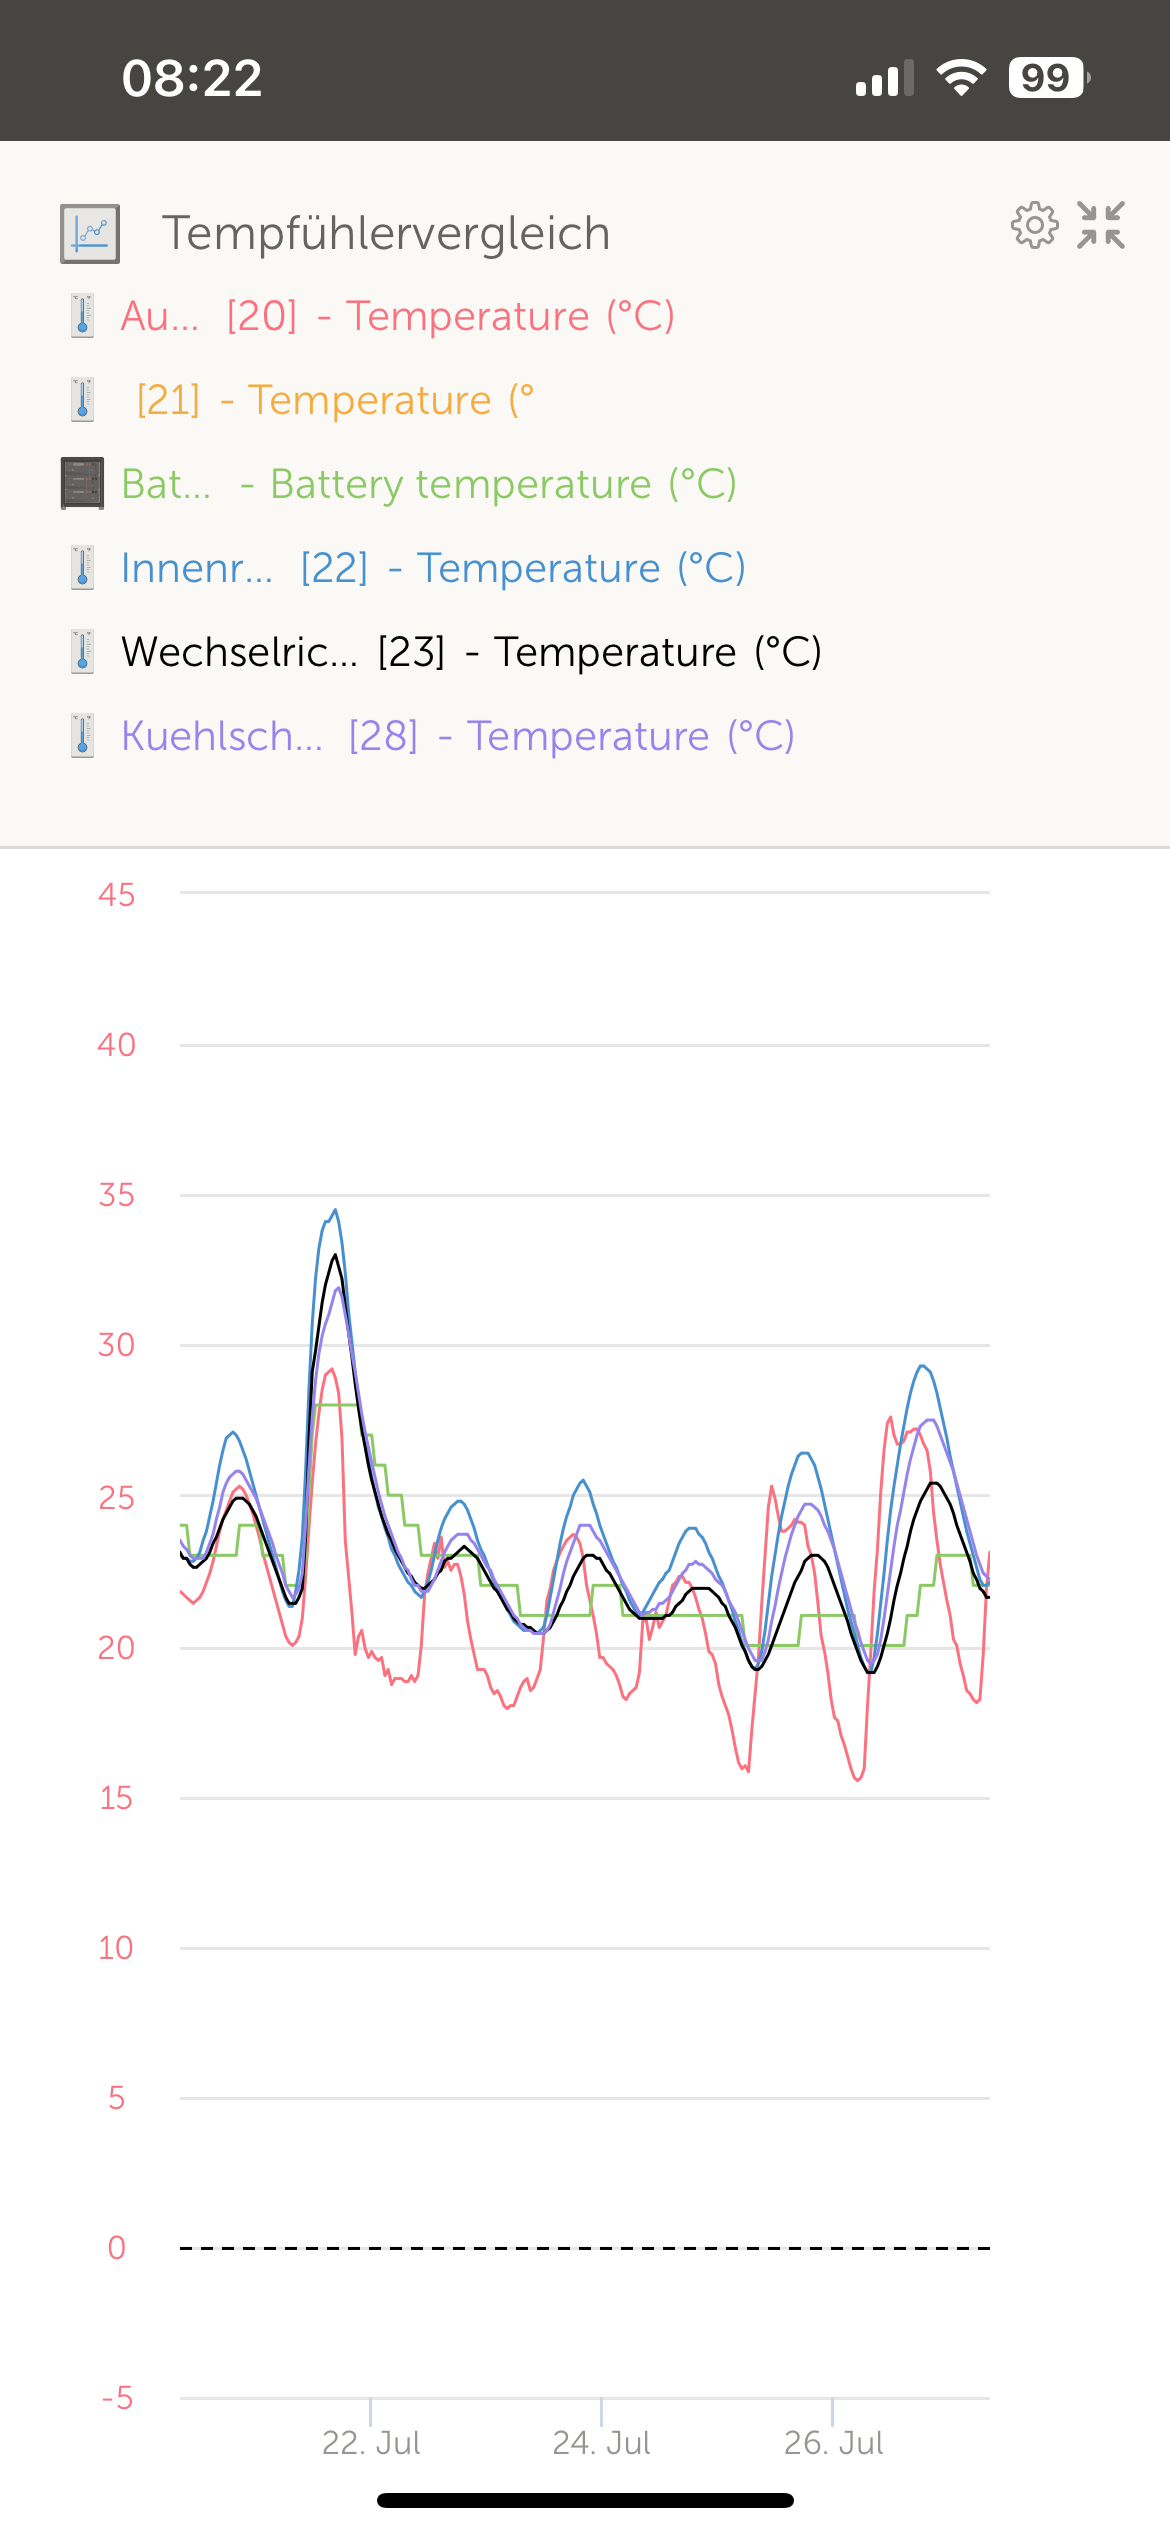
I beleive I am having some issues with my fridge. I would like to plot the temperatures on a graph much like the solar is tracked so I have data oveer a period of days or weeks to see when the fridge is fluctuating. It currently goes from 1c to 8c, seems to stop working for 4 to 6 hours judging by the AC loads.
- Home
- Anonymous
- Sign in
- Create
- Spaces
- Grafana
- Node-Red
- Unsupported topics
- Questions & Answers
- Modifications
- Communauté francophone
- Deutschsprachiger Bereich
- Preguntas en Español
- Explore
- Topics
- Questions
- Ideas
- Articles
- Badges
question
Related Resources
Additional resources still need to be added for this topic
question details
44 People are following this question.

