question

abeness avatar image
abeness asked

BMV-712 historical data is inaccurate in latest FW

I recently upgraded my battery box, and reset my BMV-712 (FW 4.16, latest) historical data for the new prismatic cells. I then ran an inverter test with 1500W heat gun to see how it went (great; approx. 136A draw). Unfortunately, I neglected to save live screenshots at the time, and I was disappointed to discover on attempting to view the Trends data later, that a full day covering the period I wanted to explore, had been lost from history:
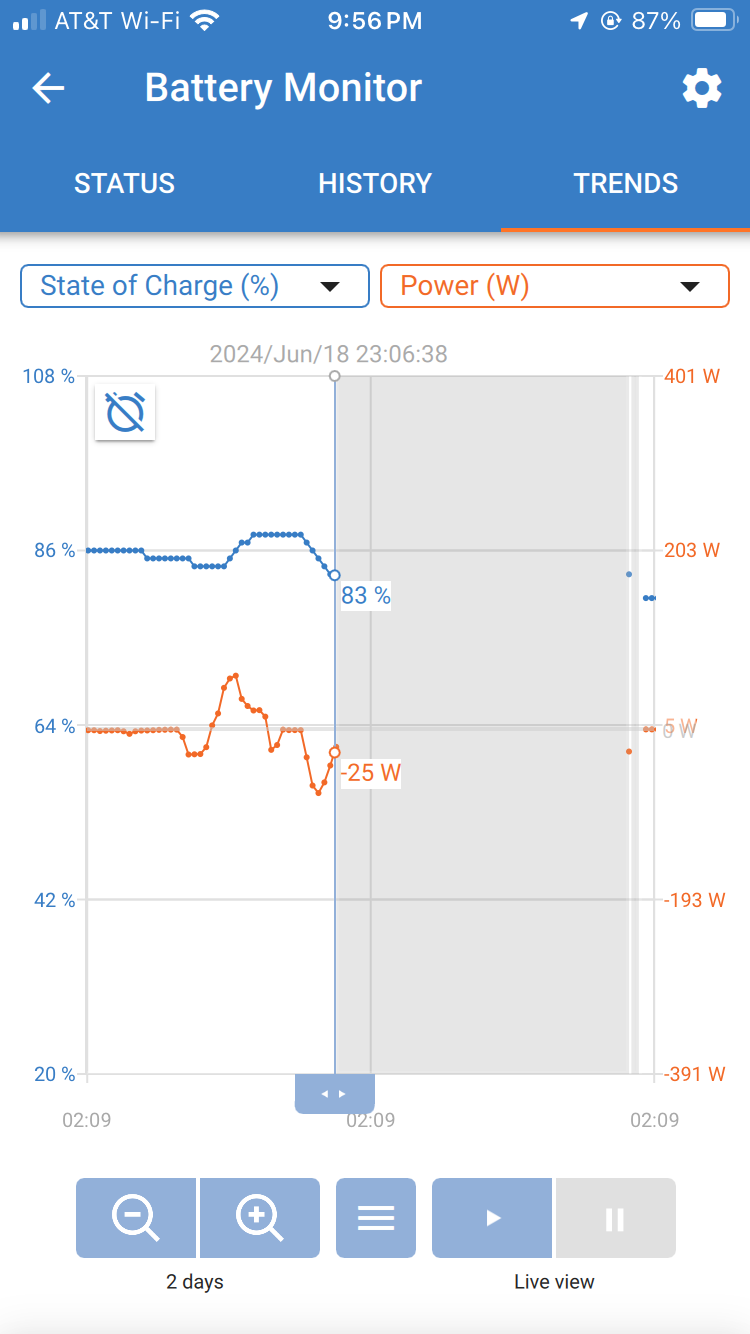
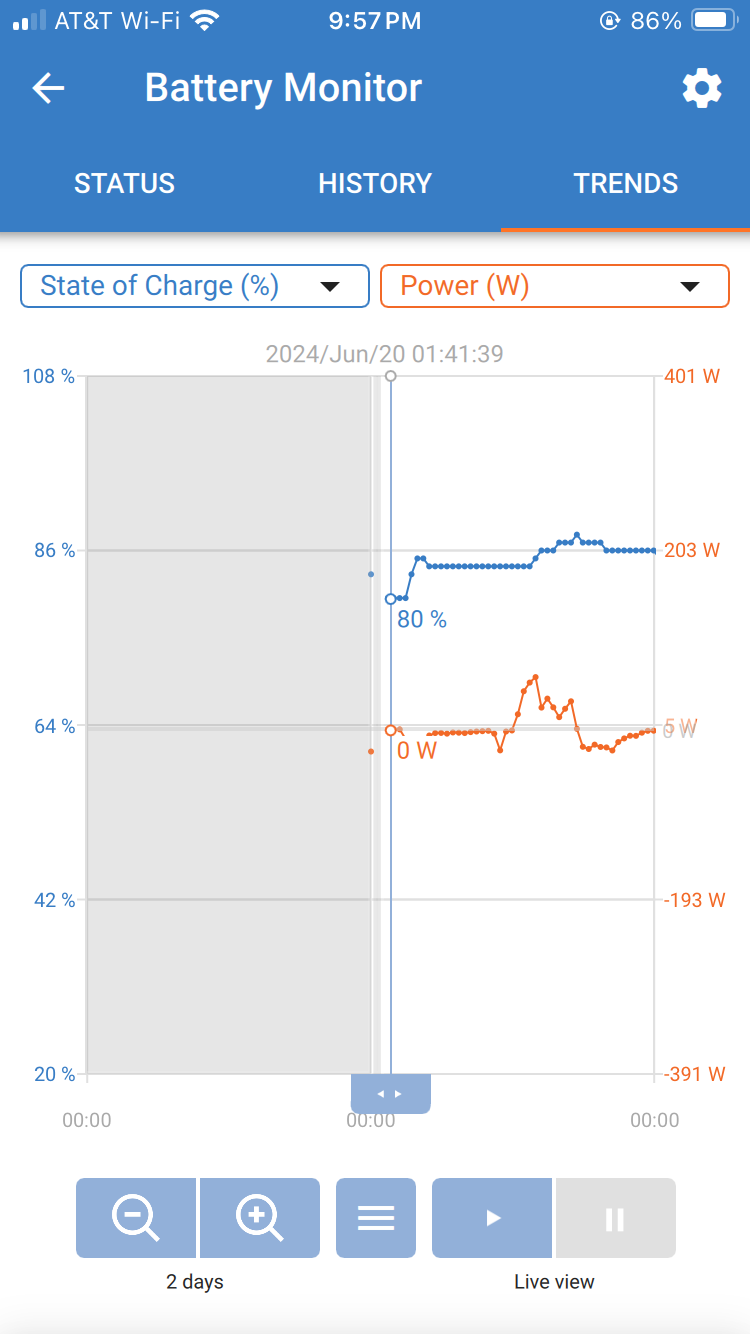
bmv-712-historical-data-loss1.png

bmv-712-historical-data-loss2.png

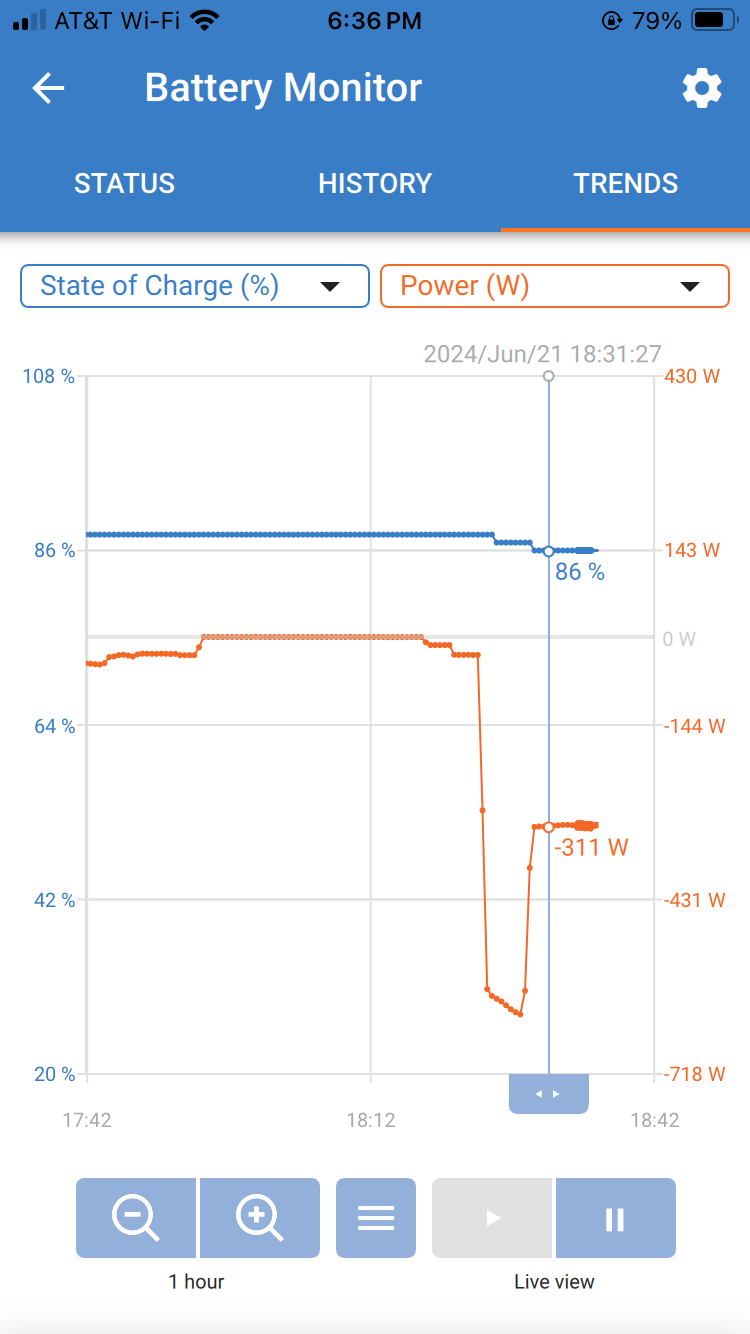
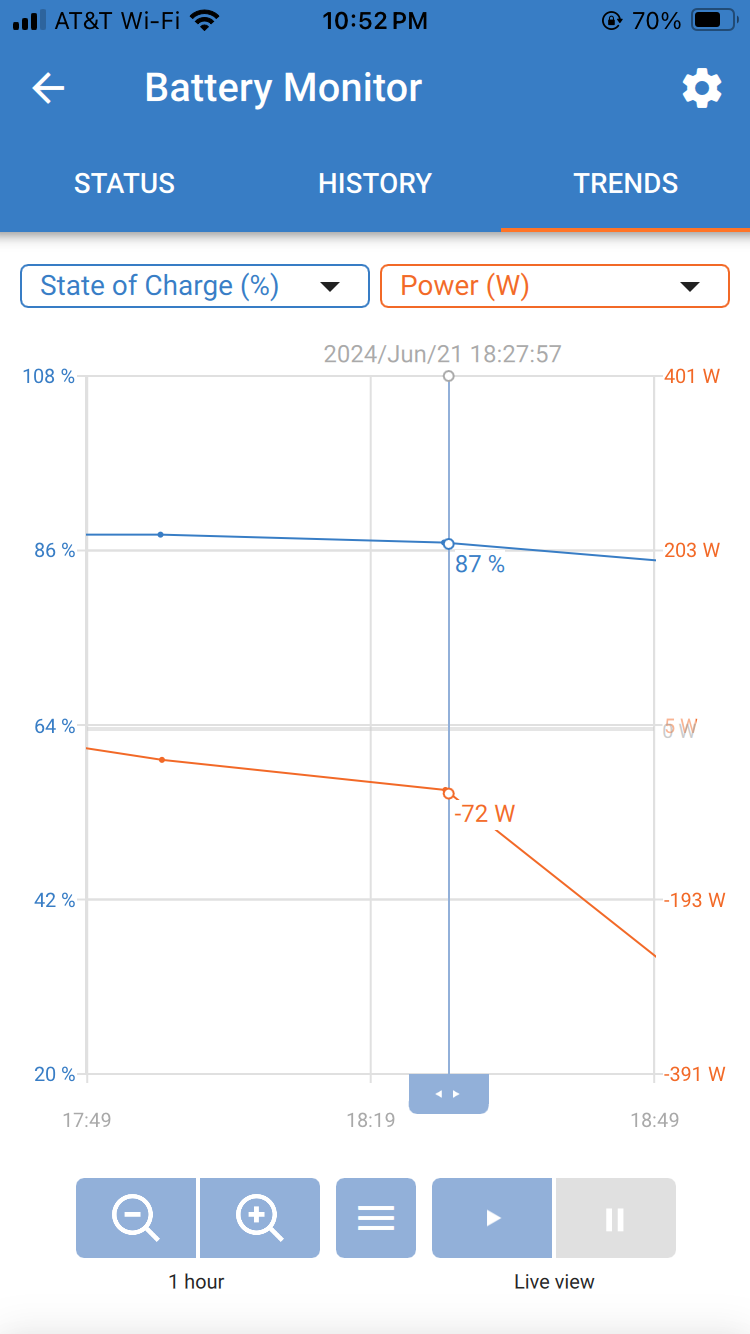
I subsequently ran another test on Friday eve over the course of an hour, with several rounds of ~300-ish and 600-ish watt draws, and saved live screenshots. I then returned tonight to review the trend over time, and discovered that the historical data shows a completely different curve than I had saved at the time:

Live:
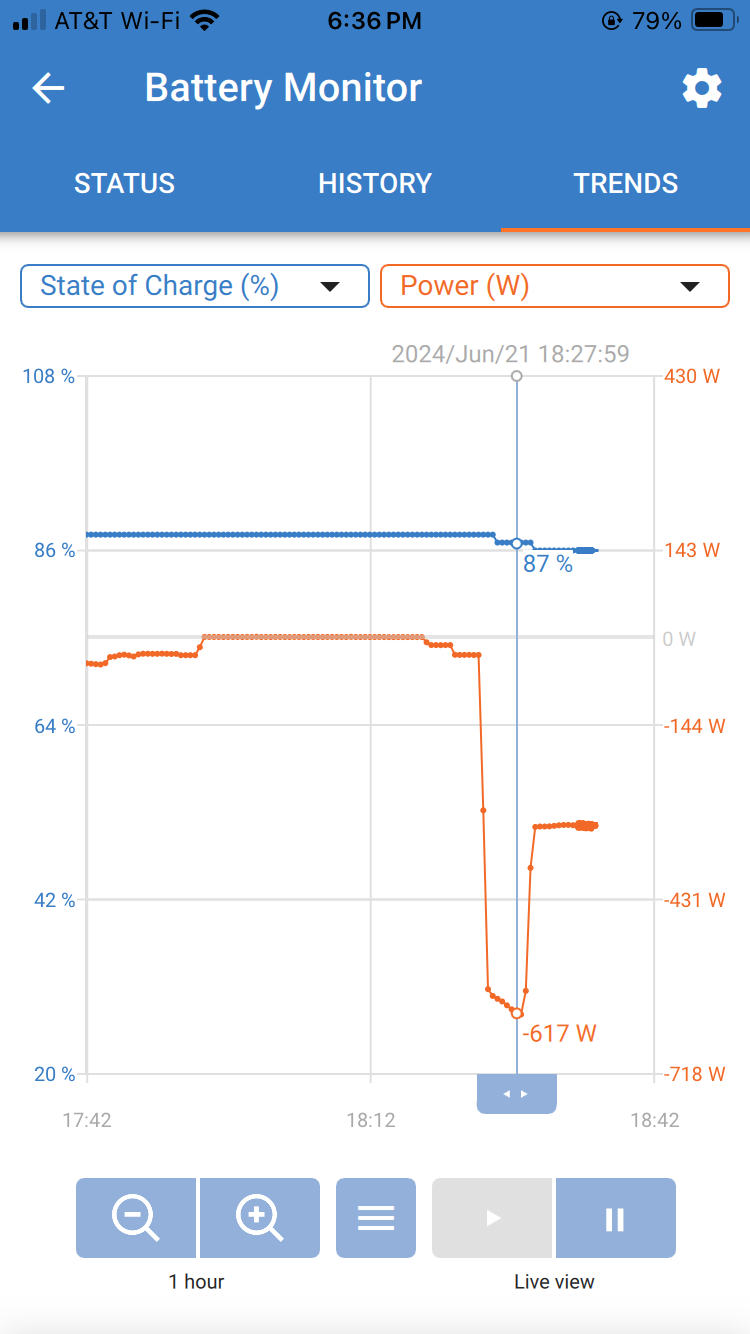
bmv-712-live-on-date1.png

bmv-712-live2-on-date1.png

Historical, and wholly inaccurate:

bmv-712-historical-on-date1.png

This seems to be a FW bug in 4.16, as I don't remember such wildly inaccurate data in the past. I'm using VictronConnect 6.07, latest for iOS. I created a service report, but it is not human-readable. How best to report this to the developers? Surely not only through a local dealer.

BMV Battery MonitorVictronConnect
7 comments
2 |3000

Up to 8 attachments (including images) can be used with a maximum of 190.8 MiB each and 286.6 MiB total.

abeness avatar image abeness commented ·
Sorry, it seems that the image size editor does not work. I had set all of these to 300px wide before posting. One for the forum developers.
0 Likes 0 ·

Hi @abeness

You can attach the service report to a comment or answer here.

It would be really helpful when you can create a service report each day for a few days and post them here.

Kind regards,

Thiemo van Engelen

0 Likes 0 ·
abeness avatar image abeness Thiemo van Engelen (Victron Energy staff) ♦ commented ·

Thanks, Thiemo. Adding the report from June 22 from iOS, one from just now on macOS, and will do some additional tests this week with "high" draw. Normally our usage is below 10A for charging laptops and phones.

I noticed that the Trends data did not reset when I reset History, and it goes all the way back to May 6. There doesn't seem to be any way to reset that. (I would have expected that to reset with History.)

questions299491_service_reports01.zip

0 Likes 0 ·
abeness avatar image abeness abeness commented ·

Hi, @Thiemo van Engelen (Victron Energy staff). Adding an additional two service reports from June 25 and this morning.

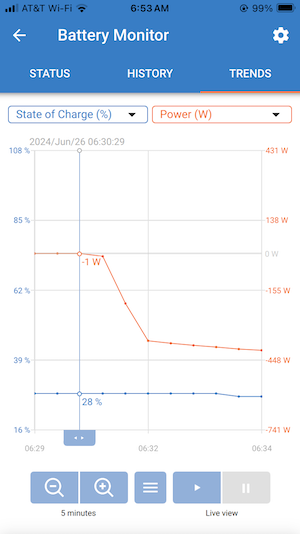
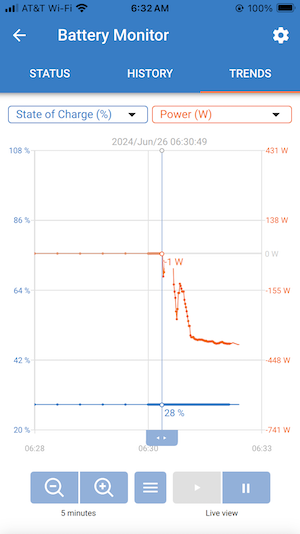
Here is another example of discrepancy between live trend:

time2-live.png

and historical (loaded 20 mins later):

time2-historical.png

Note the loss of granularity. I'm guessing that this one is the result of number of data points retained over a short period, as the overall Power and SOC trend numbers are still accurate in this one. I'm much more concerned with the larger issues in my OP.

What level of granularity is retained in stored data? And how is it pruned over time? I'd love to know the logic.

Thanks!

questions299491_service_reports02.zip

0 Likes 0 ·
time2-live.png (55.6 KiB)

Hi @abeness

In the days around the 1500W load test, was the battery monitor disconnected for approx a day? The data does indicate that it is missing a full day somewhere between 17th june 9:53 pm and 20th june 0:22 am.

Kind regards,

Thiemo van Engelen

0 Likes 0 ·
abeness avatar image abeness Thiemo van Engelen (Victron Energy staff) ♦ commented ·

Hi, @Thiemo van Engelen (Victron Energy staff)

Yes, the BMV was indeed disconnected for some time while I upgraded my DIY build and replaced the battery, I believe June 18-19, but I didn't record precisely. It is the period late June 19 into June 20 that I was surprised to miss, after BMV reconnection. It is possible that I overestimated the extent of the missing period.

It is the period between June 20 00:22 and June 20 01:41:39 that included the 1500W load test, that appears to have been lost.

Thanks for adding the averaging details in your other post (Answer section). Would you be able to expand on "as the data ages, it is averaged over an increasing period"? Specifically, what are the averaging change steps between 2 mins (1-second averaging) and the oldest data (30-min averaging)? That would help me better understand the limits of review. Yes, I'm a data geek. ;-)

I'm preparing to add VRM with Venus OS on a Raspberry Pi; I understand this will offer much better logging for later review.

0 Likes 0 ·

Hi @abeness

This makes it clear what we see in the data. We see a startup at around 20 june 00:22 pm and a startup at approx 3:07 pm. This makes me believe that you disconnected the BMV again after the test? So I believe that the single data point between the two grey bars (the disconnections) in the first screenshot is the data from the test, but then a 30 minute average and perhaps only a limited time of the test. The other duration of the test would fall in the sample in which the BMV was rebooted, invalidating the sample.

Currently the averaging intervals are the following:
the last 2 minutes, sampled every second,
the 2 hours before that, averaging every 30 seconds,
the 24 hours before that, averaging every 5 minutes,
the 45 days before that, averaging every 30 minutes,

I would like to add that these might change in a future update and they might not be the same for every product.


Kind regards,

Thiemo van Engelen

0 Likes 0 ·
2 Answers
kevgermany avatar image
kevgermany answered ·

I'll pass it on for you.

1 comment
2 |3000

Up to 8 attachments (including images) can be used with a maximum of 190.8 MiB each and 286.6 MiB total.

abeness avatar image abeness commented ·
Thank you!
0 Likes 0 ·
Thiemo van Engelen (Victron Energy staff) avatar image
Thiemo van Engelen (Victron Energy staff) answered ·

Hi @abeness

Thank you for the service reports. We are still investigating, but they do seem to hint in an error somewhere in the software, which might explain the day of testing that was lost.

Then regarding all the other charts. The loss in precision is indeed caused by averaging that is done to limit the number of samples for older data. The most recent 2 minutes is stored with an interval of 1 second, but as the data ages, it is averaged over an increasing period. The oldest data has an averaging period of 30 minutes. So a test of a few minutes will not show up anymore in that data.

Kind regards,

Thiemo van Engelen

2 |3000

Up to 8 attachments (including images) can be used with a maximum of 190.8 MiB each and 286.6 MiB total.