question

logic28 avatar image
logic28 asked

Widget dual graph meaning

I asked this question two days ago but had no conclusive reply.

I do not understand the meaning of the two graphs accompanied by the two values of my twin Multi in-parallel widget, at any one point, there are different representations and current values.
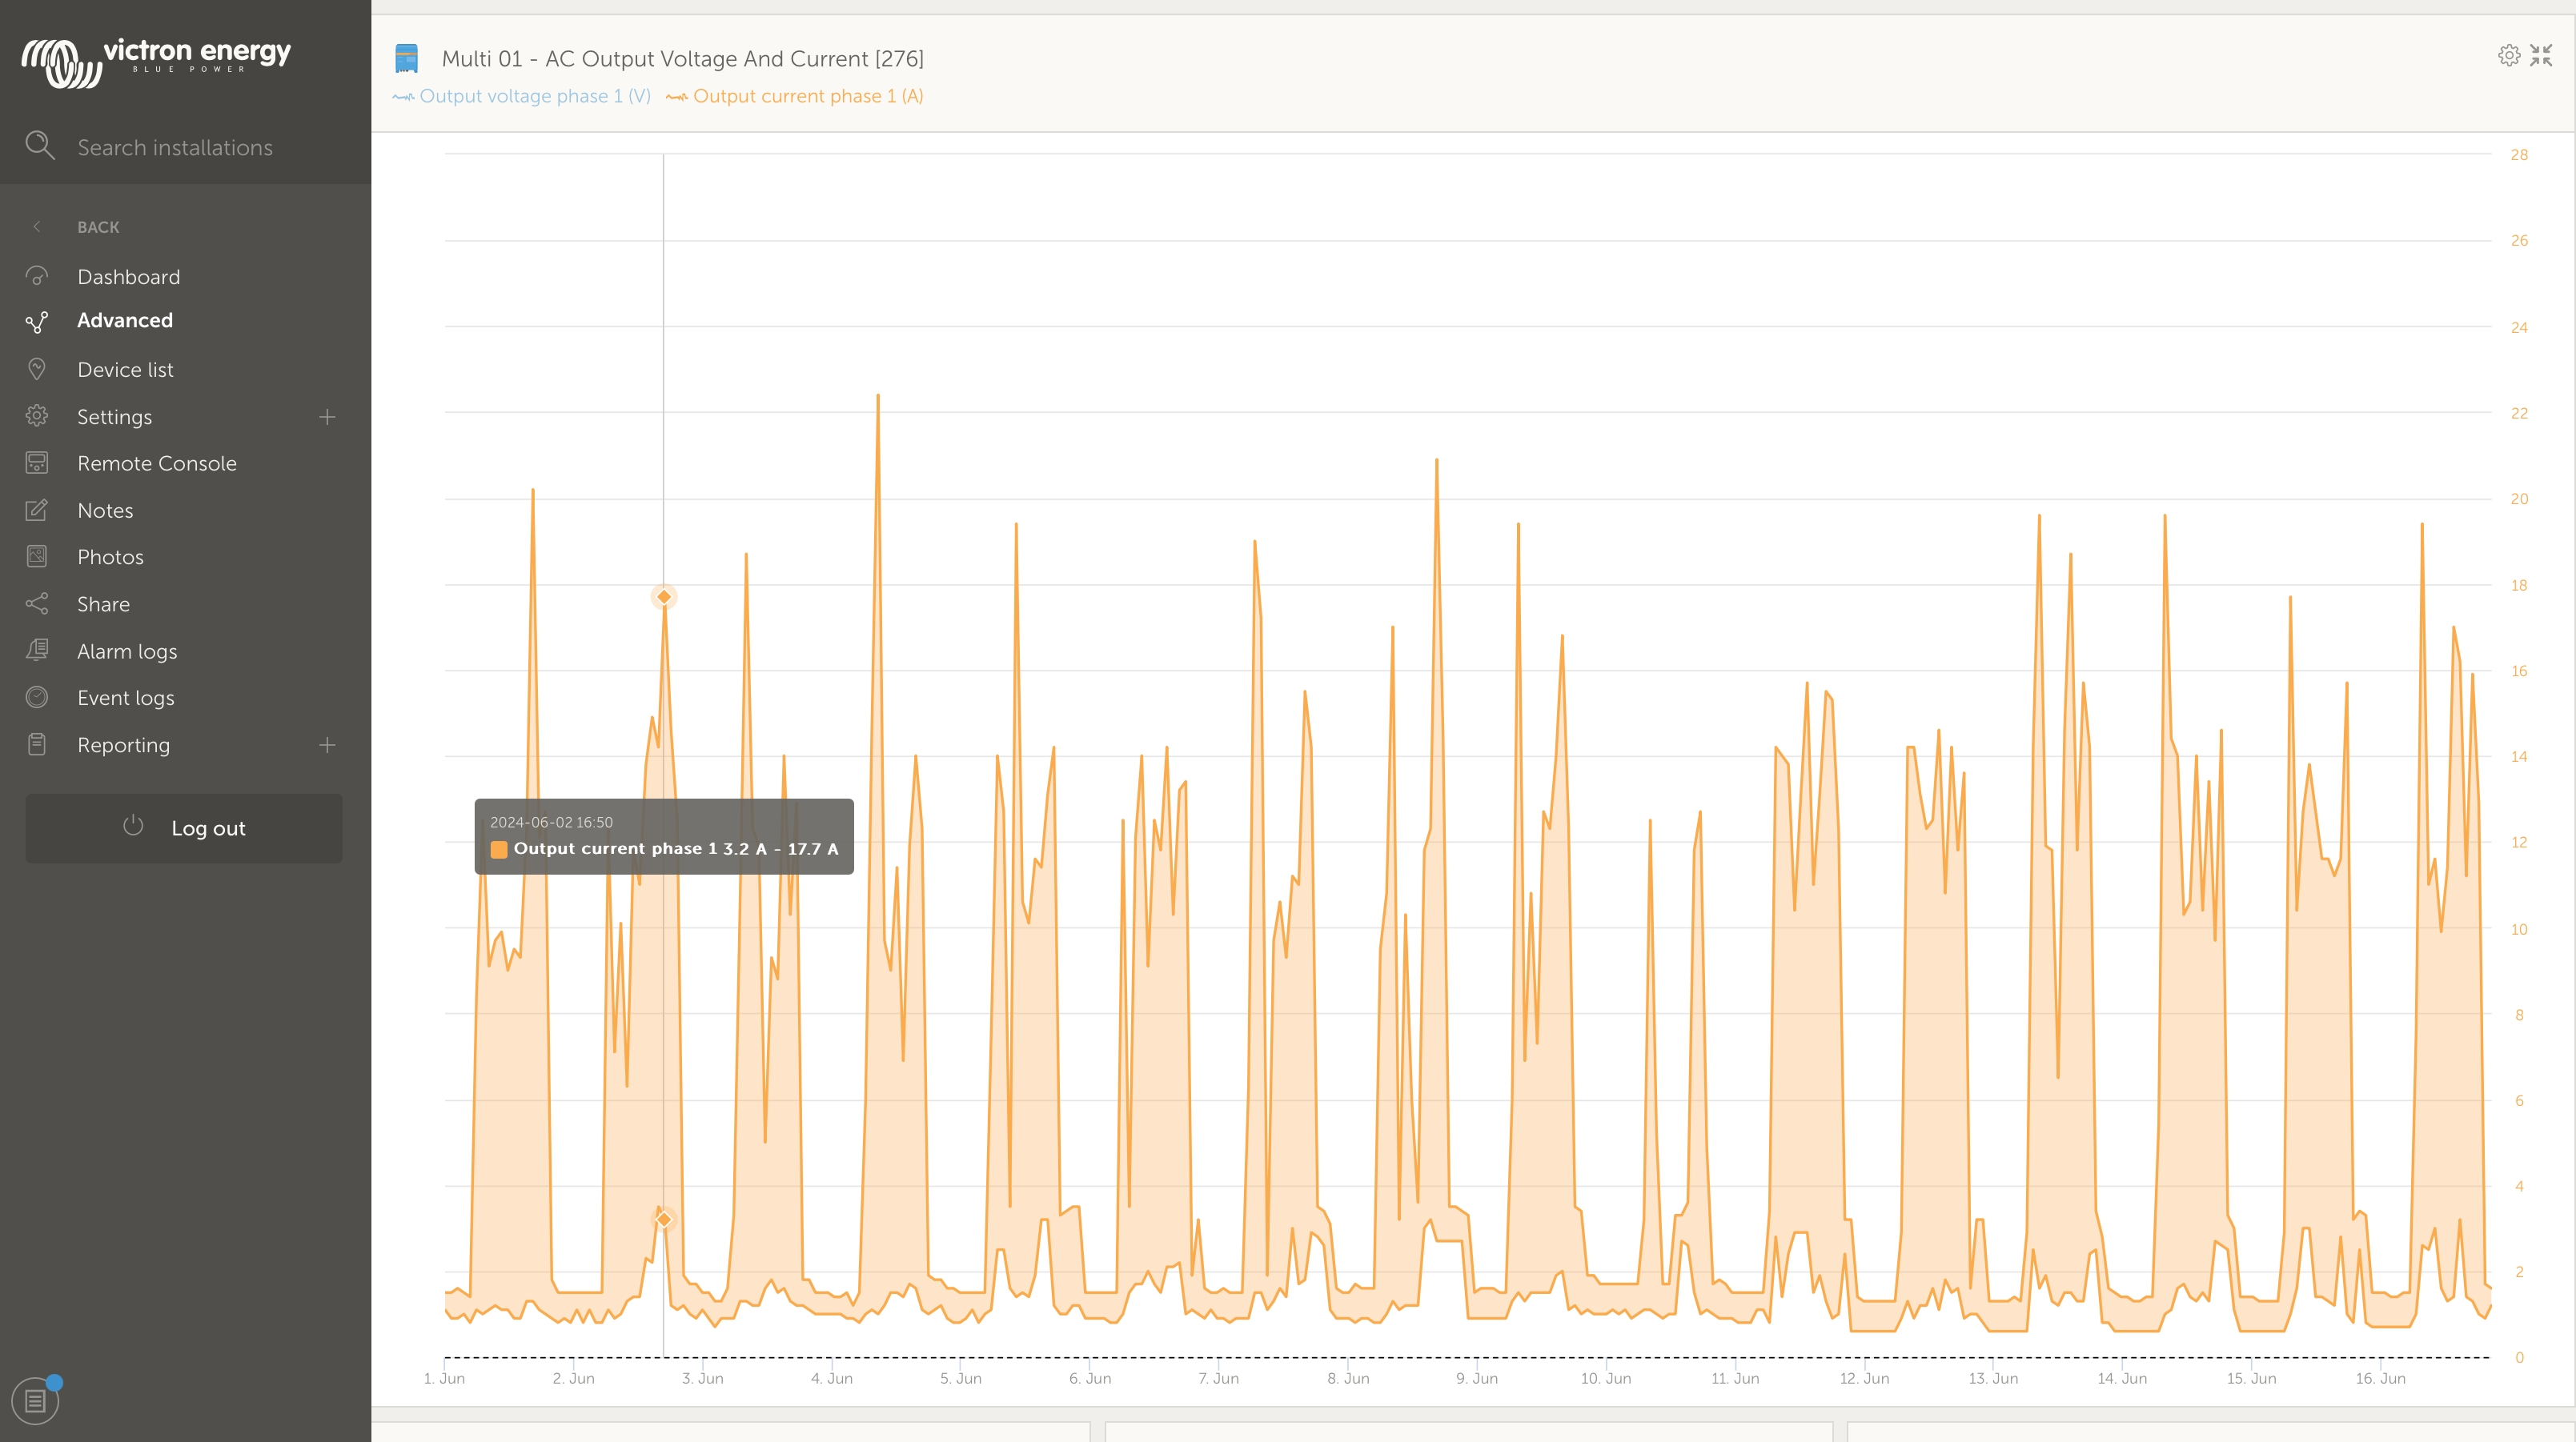
screenshot-2024-06-16-at-203918.png

Can someone please explain or tell me where I can find the information?


vrm advanced
2 |3000

Up to 8 attachments (including images) can be used with a maximum of 190.8 MiB each and 286.6 MiB total.

1 Answer
kevgermany avatar image
kevgermany answered ·

It appears you have turned on Show Range Values. This plots the highest and lowest values recorded during the individual time points shown.

Check using the cogwheel icon top right of the graph.

5 comments
2 |3000

Up to 8 attachments (including images) can be used with a maximum of 190.8 MiB each and 286.6 MiB total.

logic28 avatar image logic28 commented ·
It appears you have turned on Show Range Values. This plots the highest and lowest values recorded during the individual time points shown.

Thanks, I'm not sure I understand, how can there be two different values at the same time? I was worried that it could be the values of the two inverters but it seems not.


0 Likes 0 ·
Show more comments

Related Resources

Additional resources still need to be added for this topic