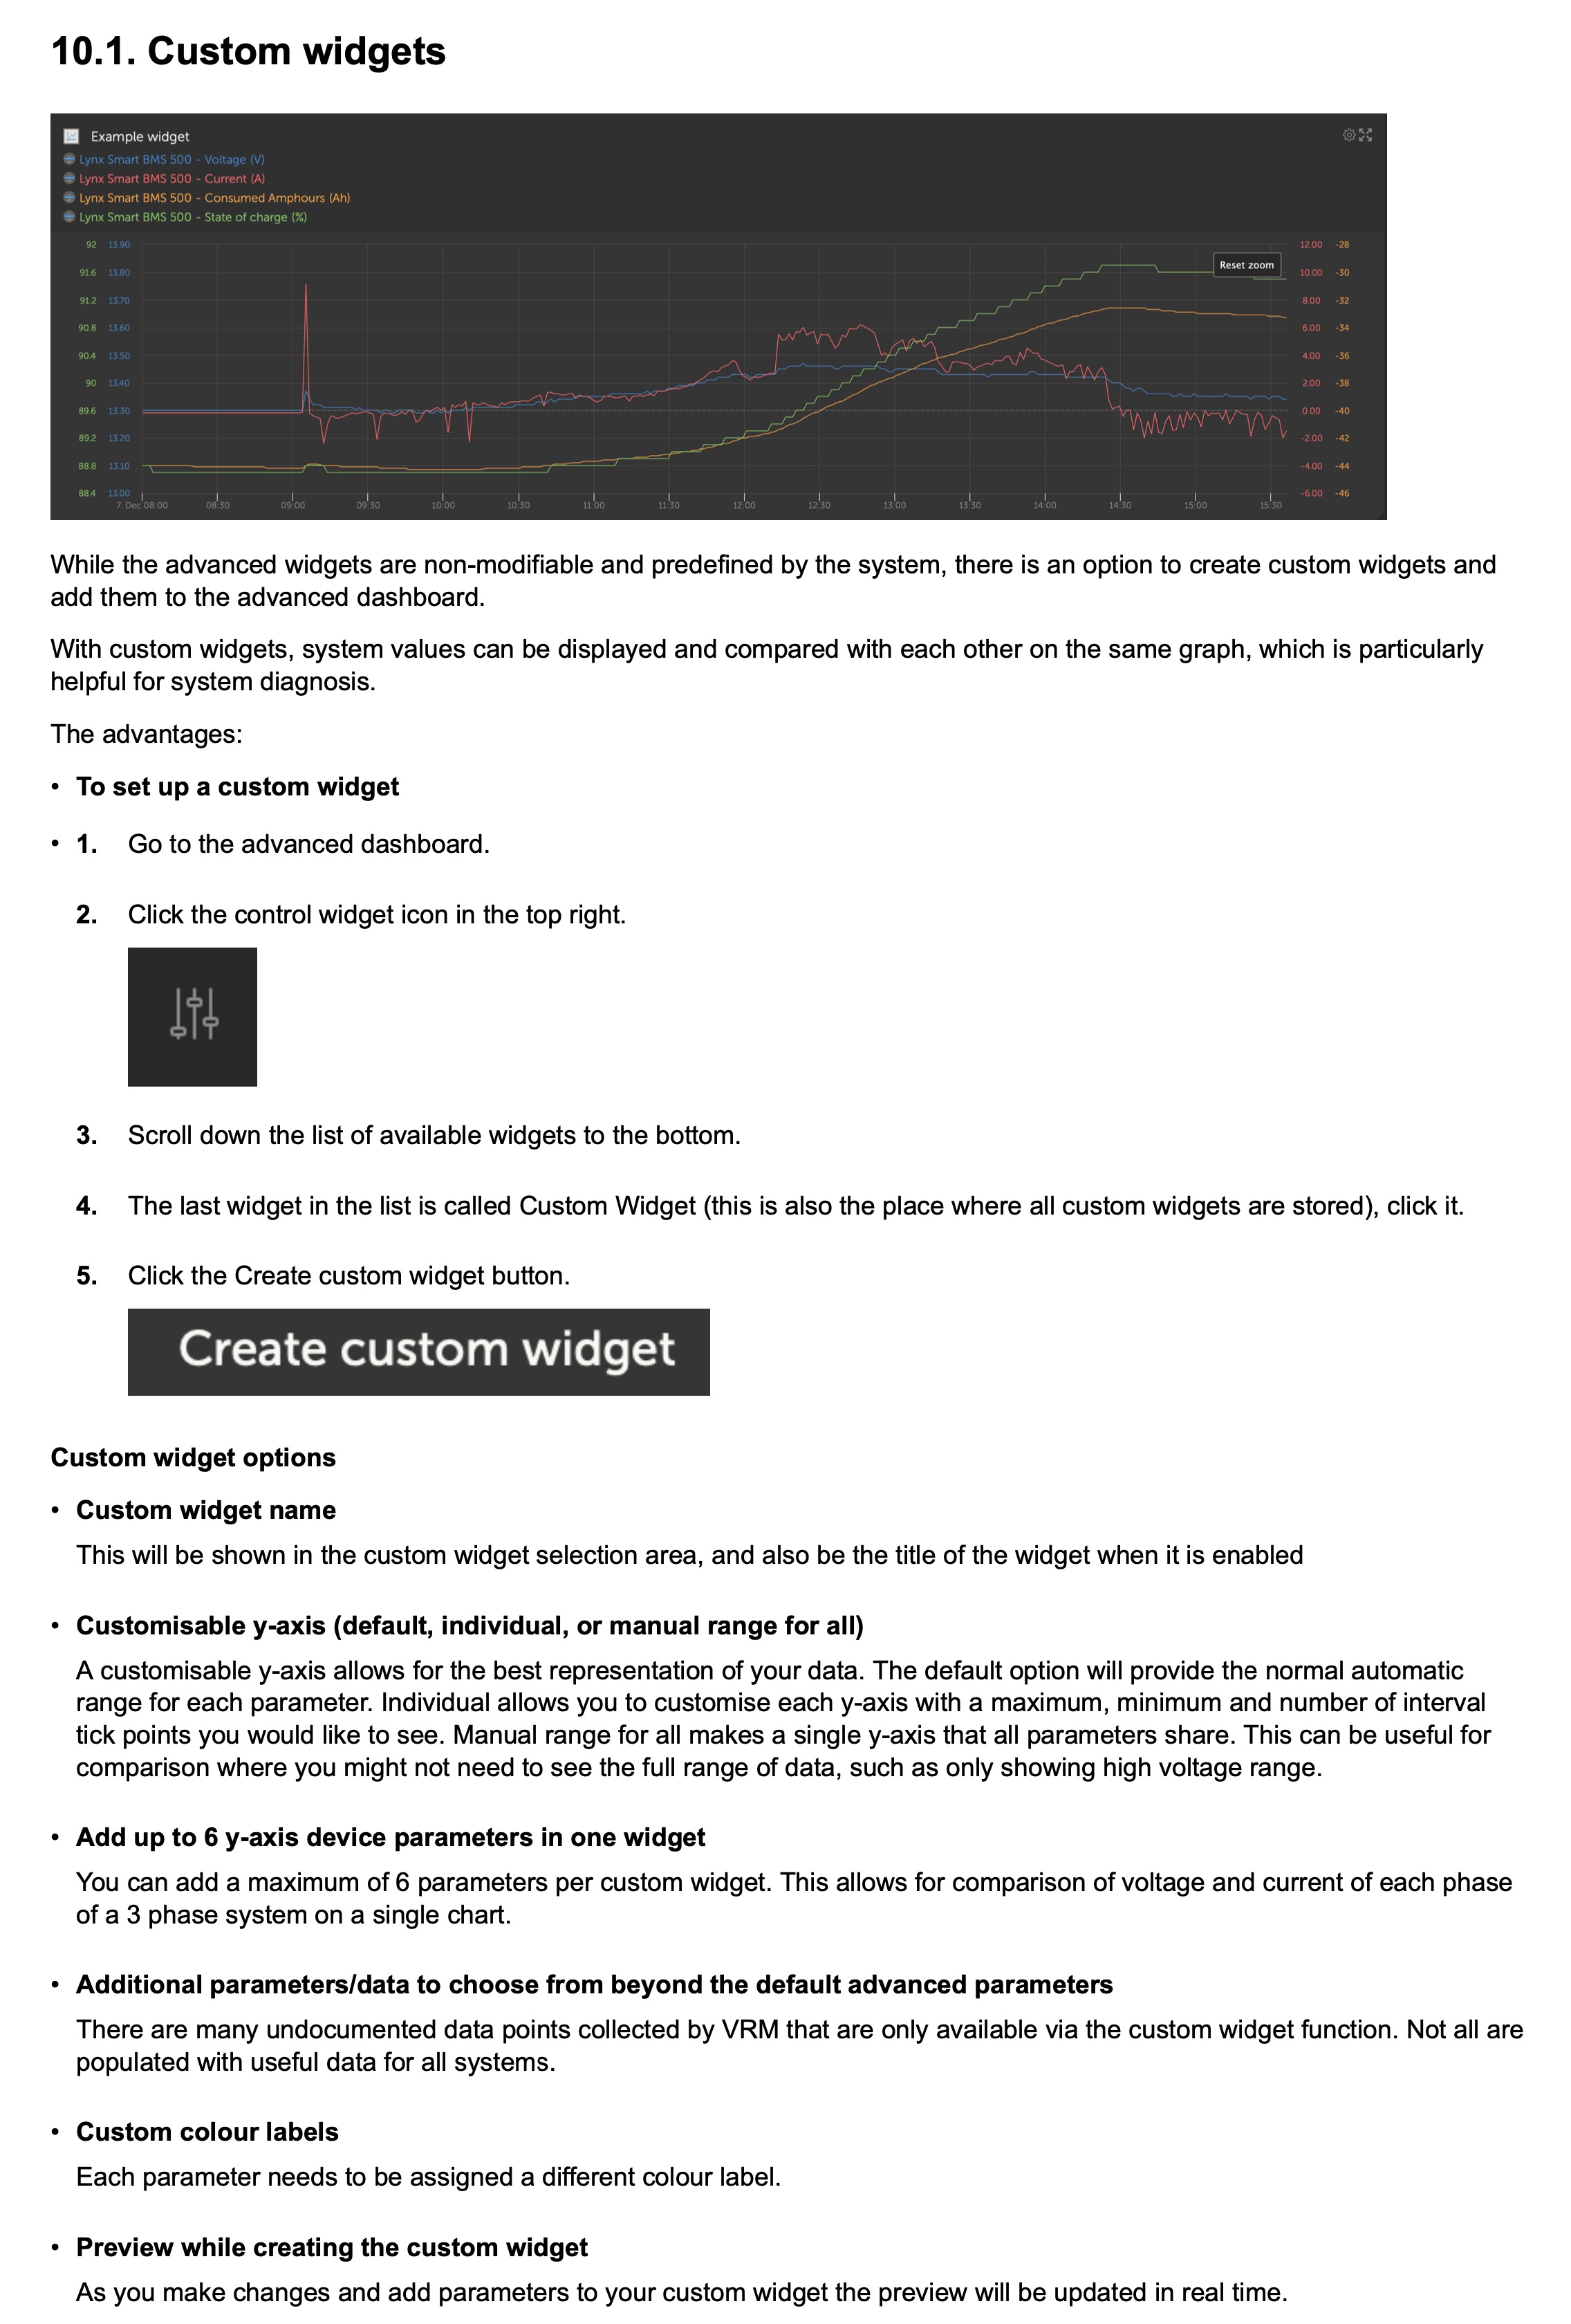
Something seems to have changed recently on the VRM display. For the BMS widget Min/max cell Voltage are now on two separate scaling on left the other right. This was not the case before. Both used the Same scale which seems to me the better choice.
We care to have all the cell at the same Voltage. So the Ability to quickly identify when and how cell voltage diverge is critical.
Now the two sets of data appear on two different scaling that are very different from each other which makes analysis difficult. The graph below first made my heart jump until I realized the two curves are on different scales. If easier for you to have left and right scales, at least make then use the same limits.

This seems to be a new issue. I never noticed it before.


