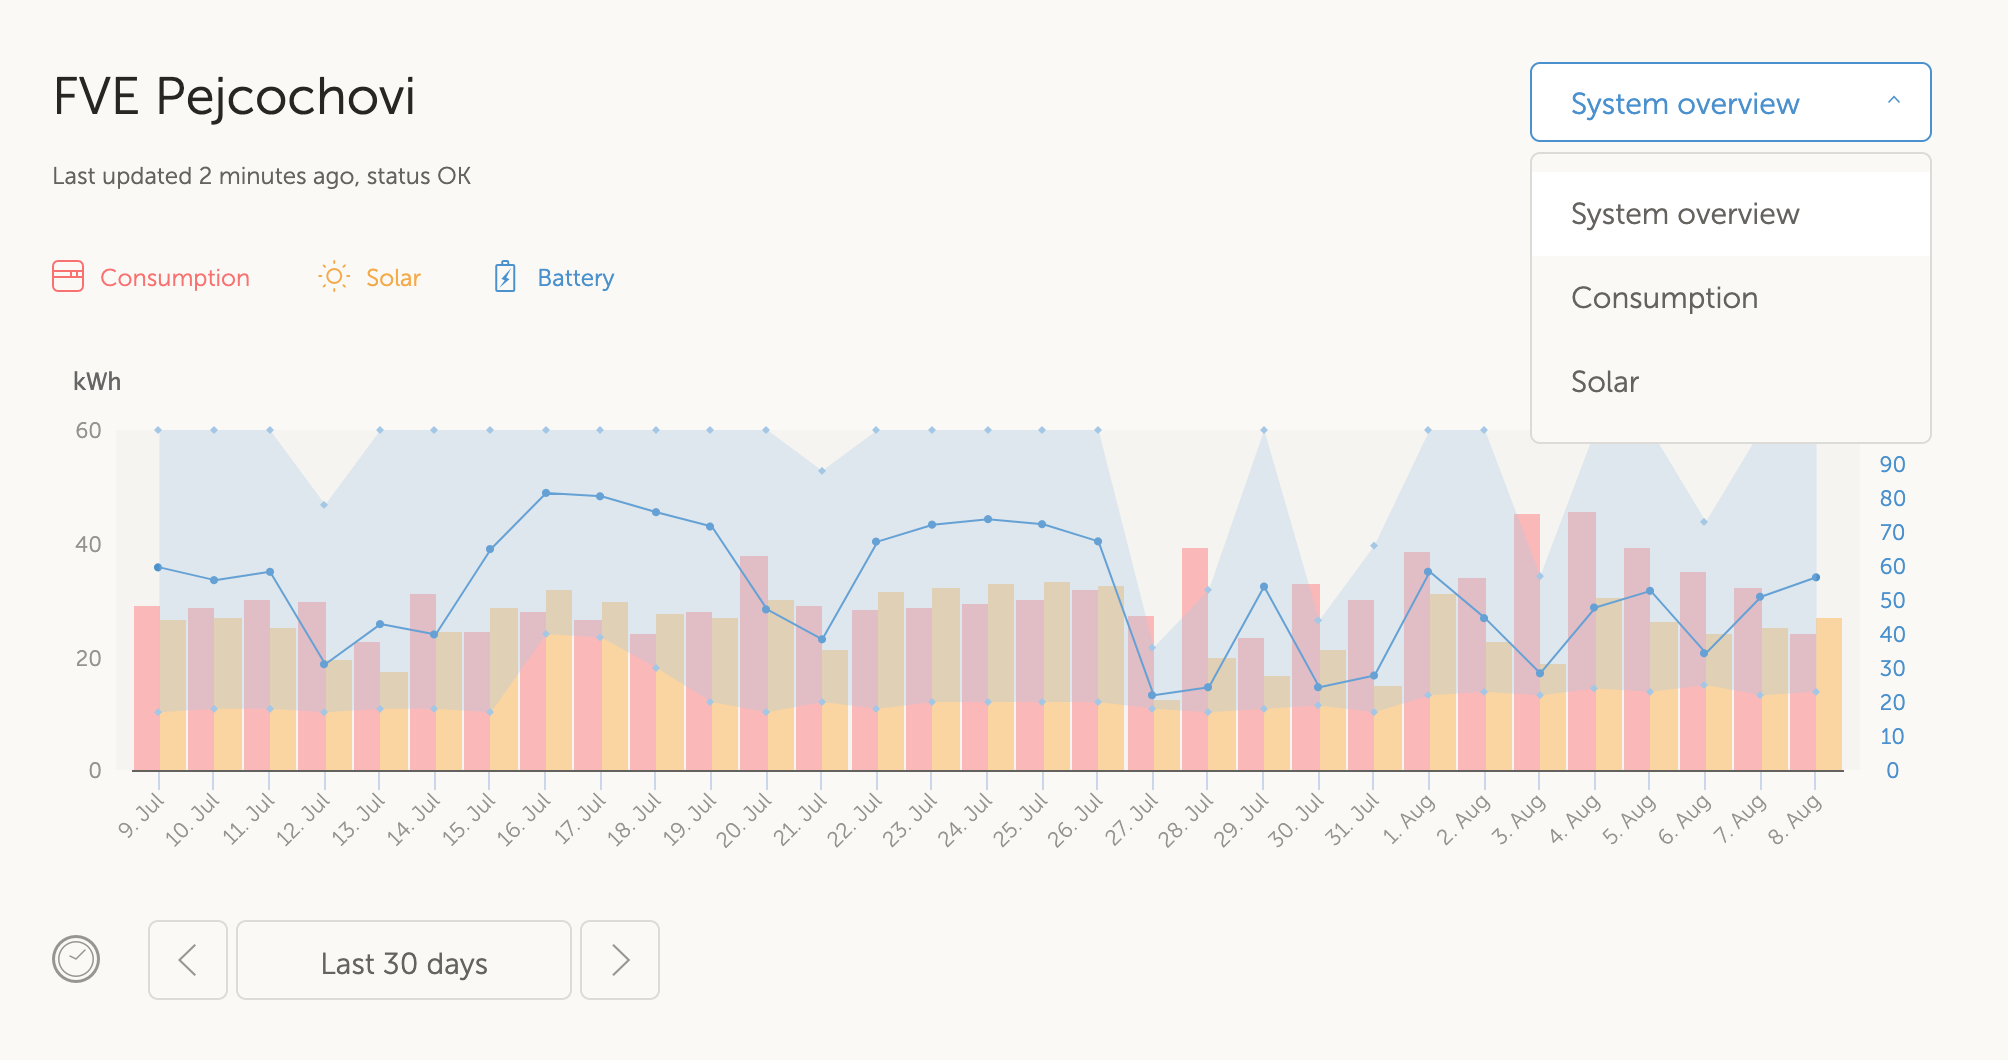
Hi, Im trying to replicate the graph, which is available at vrm portal. I want to implement it in my total house dashboard in Grafana, toghether with water, gas and other consumptions.
I was successfull in catching mqtt stream and filtering out ACTUAL data for battery SoC, AC load, PV yield etc..., which is great! Its a very nice substitute for remote console. Path for the actual data looks like this for example: N/<myid>/system/0/Ac/ConsumptionOnOutput/L1/Power
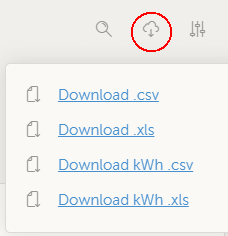
Its very difficult to replicate the historical data though. Could you share, how you compile the graph and how you get the data? It would be a great help.
If I subscribe to this message, N/<myid>/solarcharger/256/History/Daily/0/Yield, I get slightly different numbers then in vrm graph. Even if I check some days back (Daily 1, Daily 2 etc) its always different. Also, I cant find data for the total AC consuption of the installation, total power to battery, from battery, direct use....
Thanks!
Vit


