I have been working with Victron and we have built an experimental Venus OS large image that includes Grafana, InfluxDB and a loader to capture data and feed it into Influx. This is very experimental at this stage and anyone willing to test and feedback would be welcome.
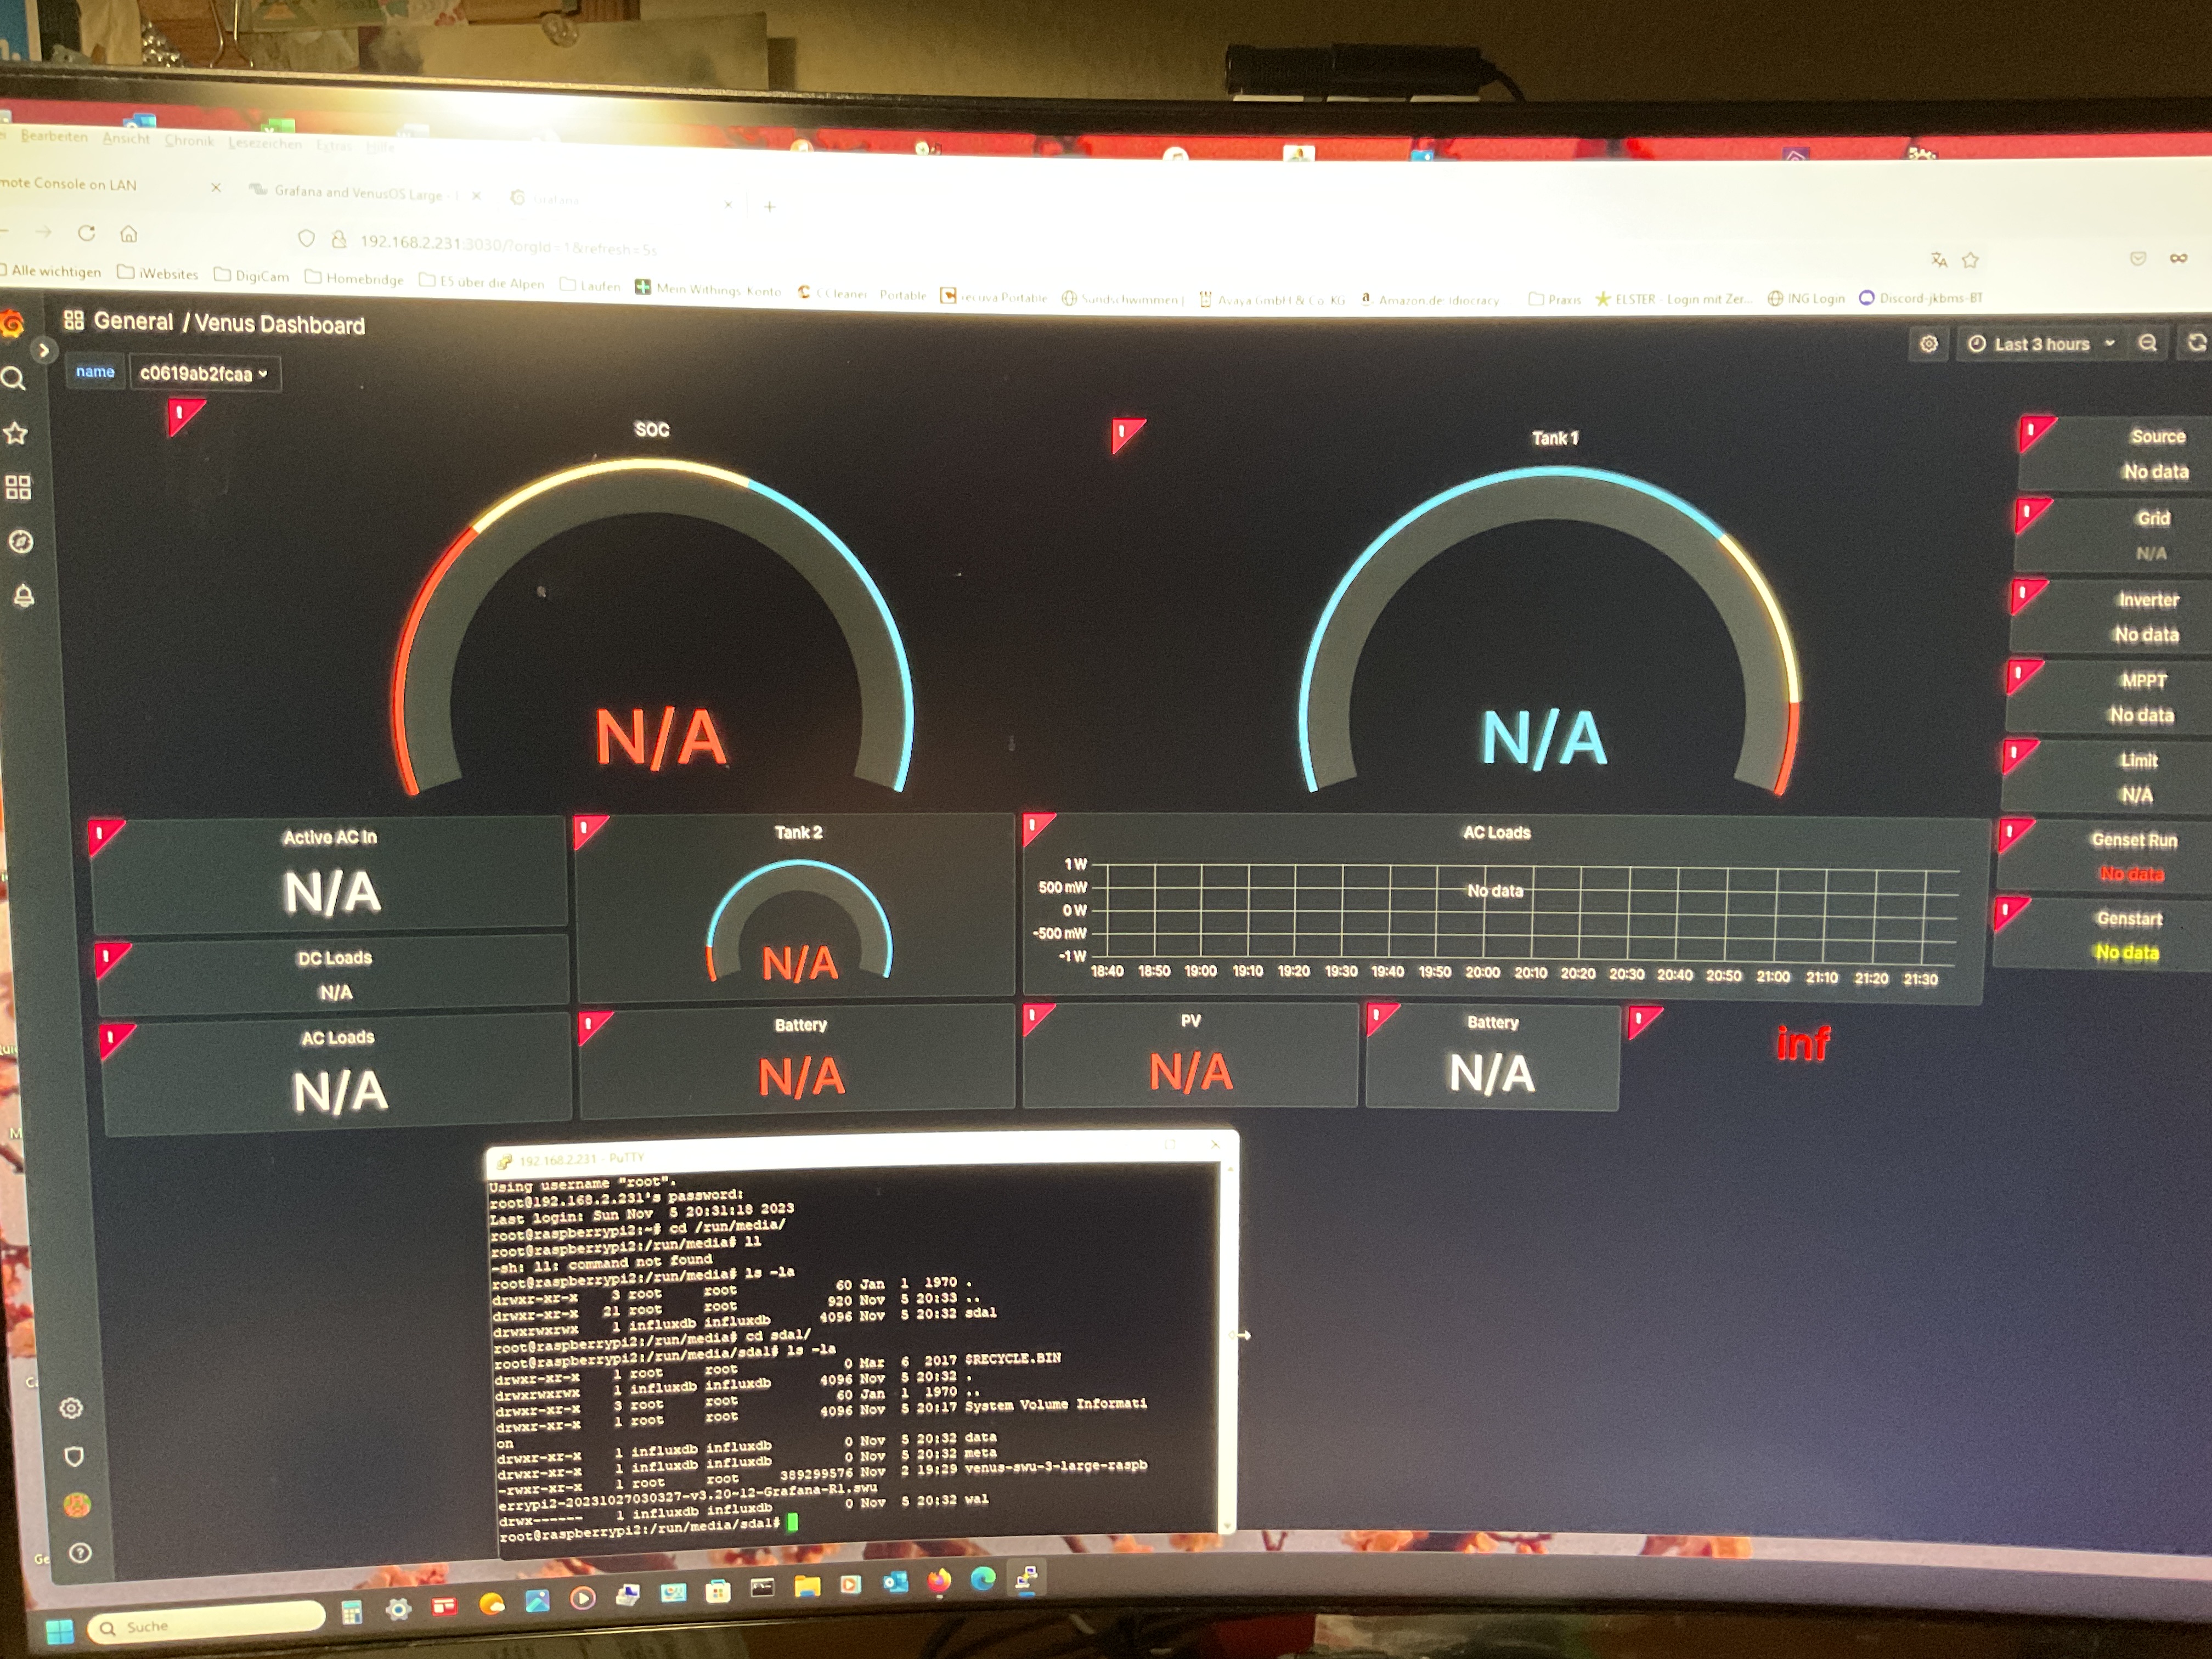
There is a very basic dashboard and anyone wanting to supply some dashboard for including please share what you have and your ideas. No promises, but as a community we can make this as extensive as we see fit.
Venus OS Large Grafana Image is available here
This is based on:
- Venus OS v3.20~12
- Grafana 9.4.3
- InfluxDB 1.8.10
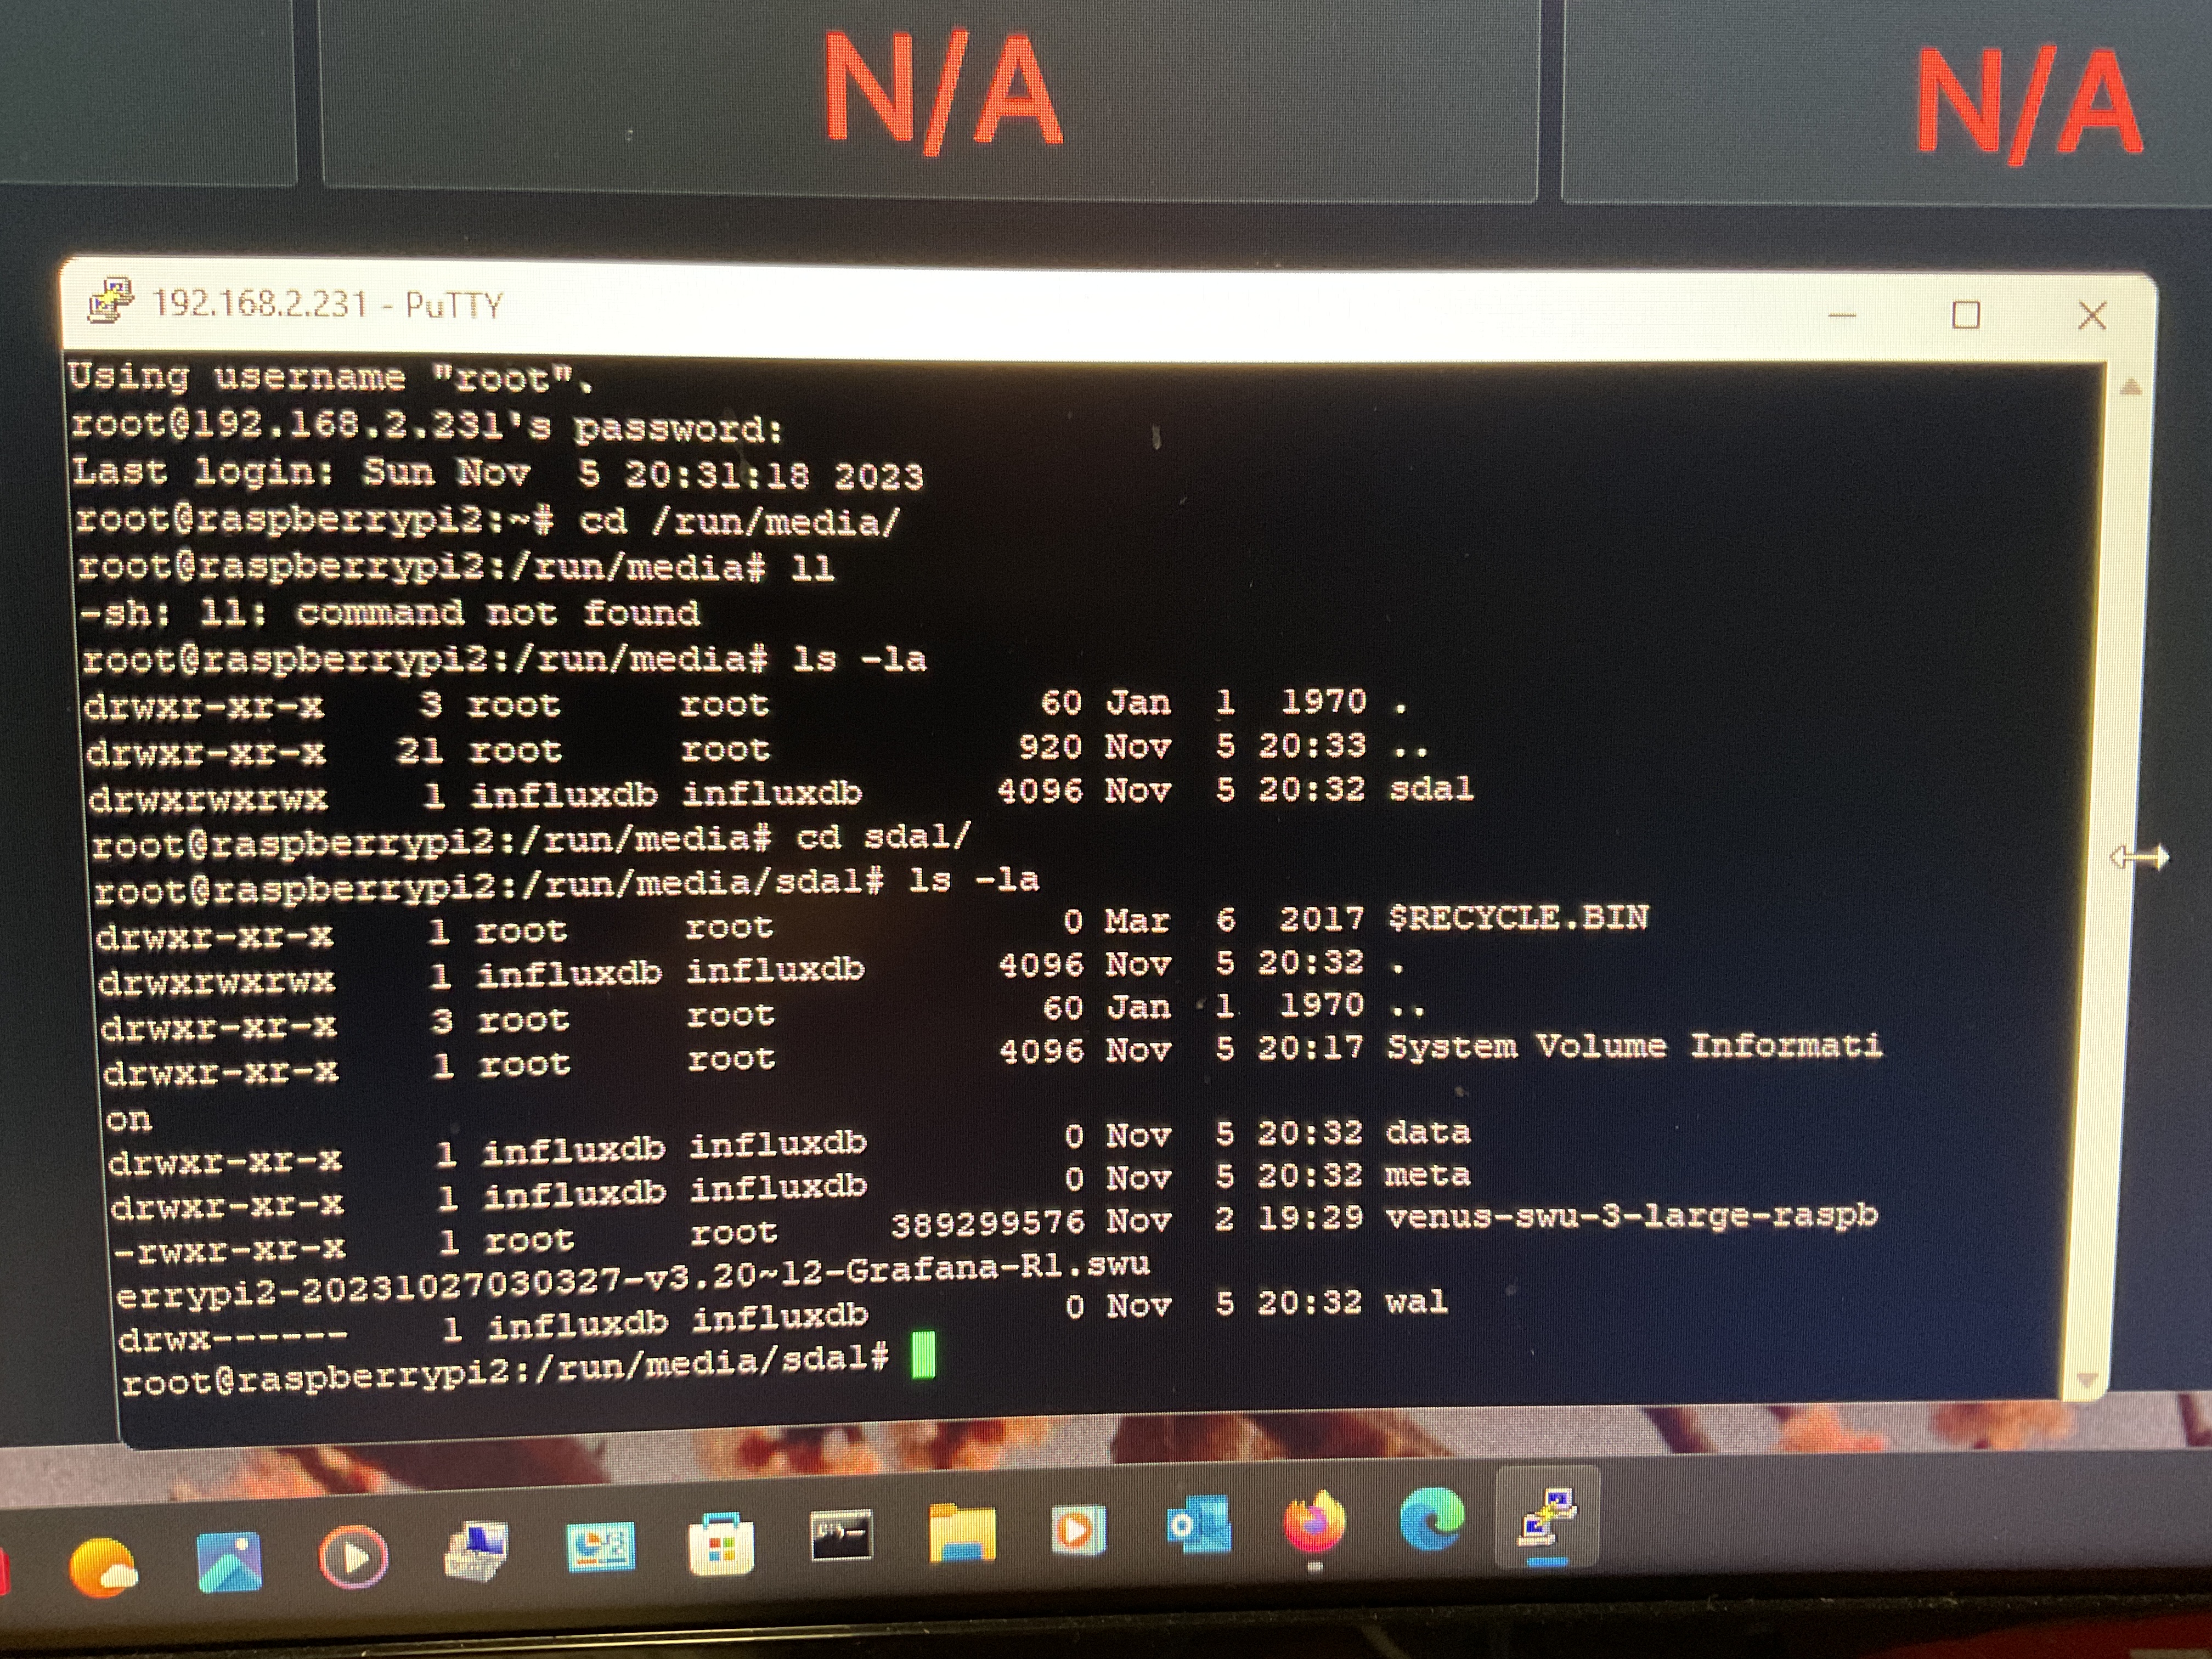
Before starting the Grafana stack though the settings / Venus OS Large features / Grafana Stack option log in with ssh and setup the storage location for influxdb.
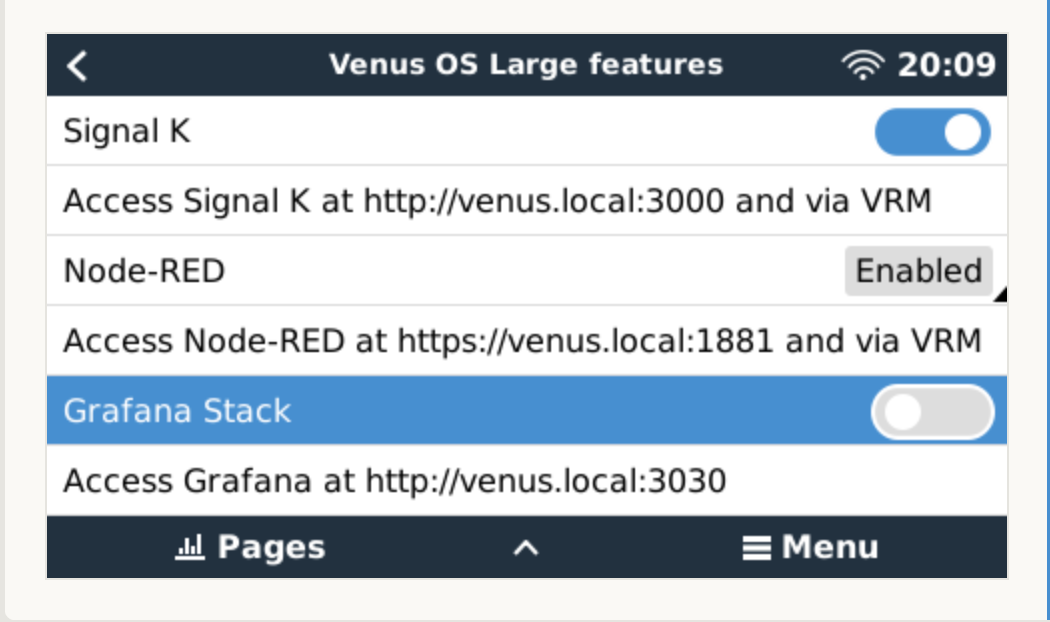
Influx DB Setup
- Log into VenusOS via ssh
- Insert an SDCard or USB storage medium into the system
- Locate the medium’s mount point in /run/media
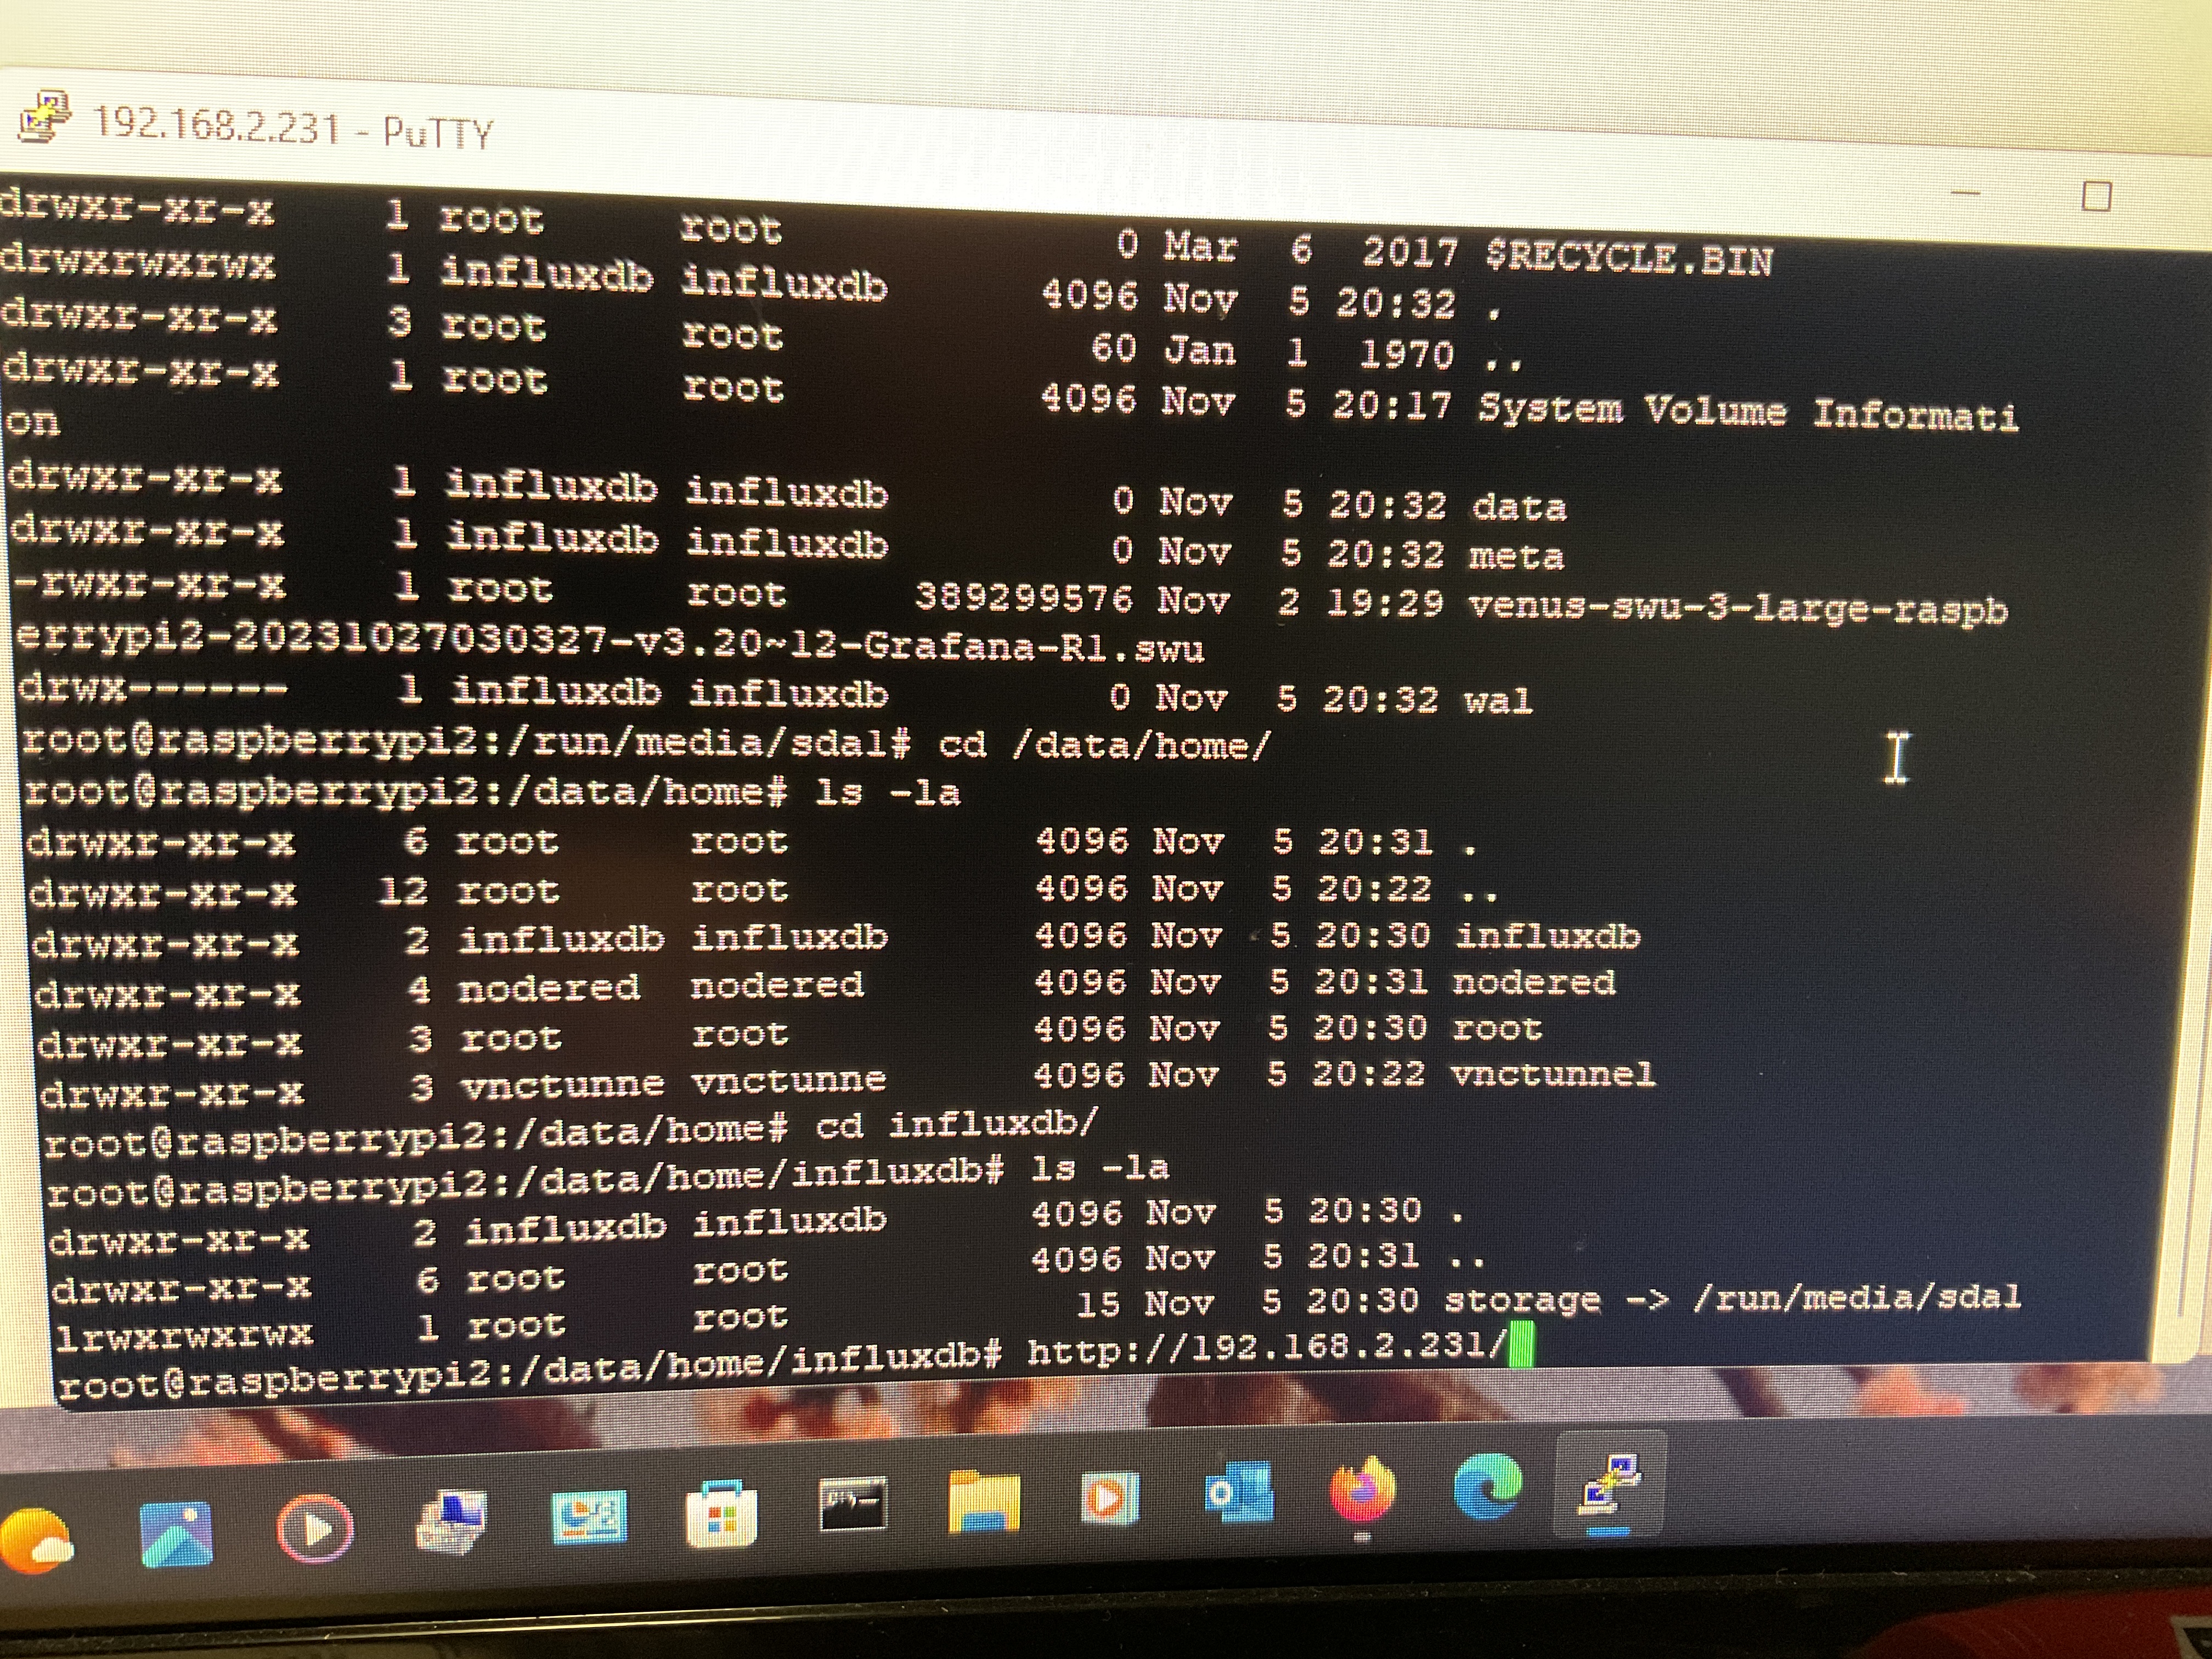
- mkdir /data/home/influxdb
- ln -s /run/media/DEVICE /data/home/influxdb/storage
Basic Grafana dashboard is available at venus.local:3030 with username of admin and password of admin
The data loader which loads data into the InfluxDB is set to a retention period of 30 days. This on my system generates a DB that is roughly 250Mb. It would be good to get feedback from others on their DB size after a month of running.
NOTE: At this stage the image will not run on a CerboGX, it is limited to RPI only.

