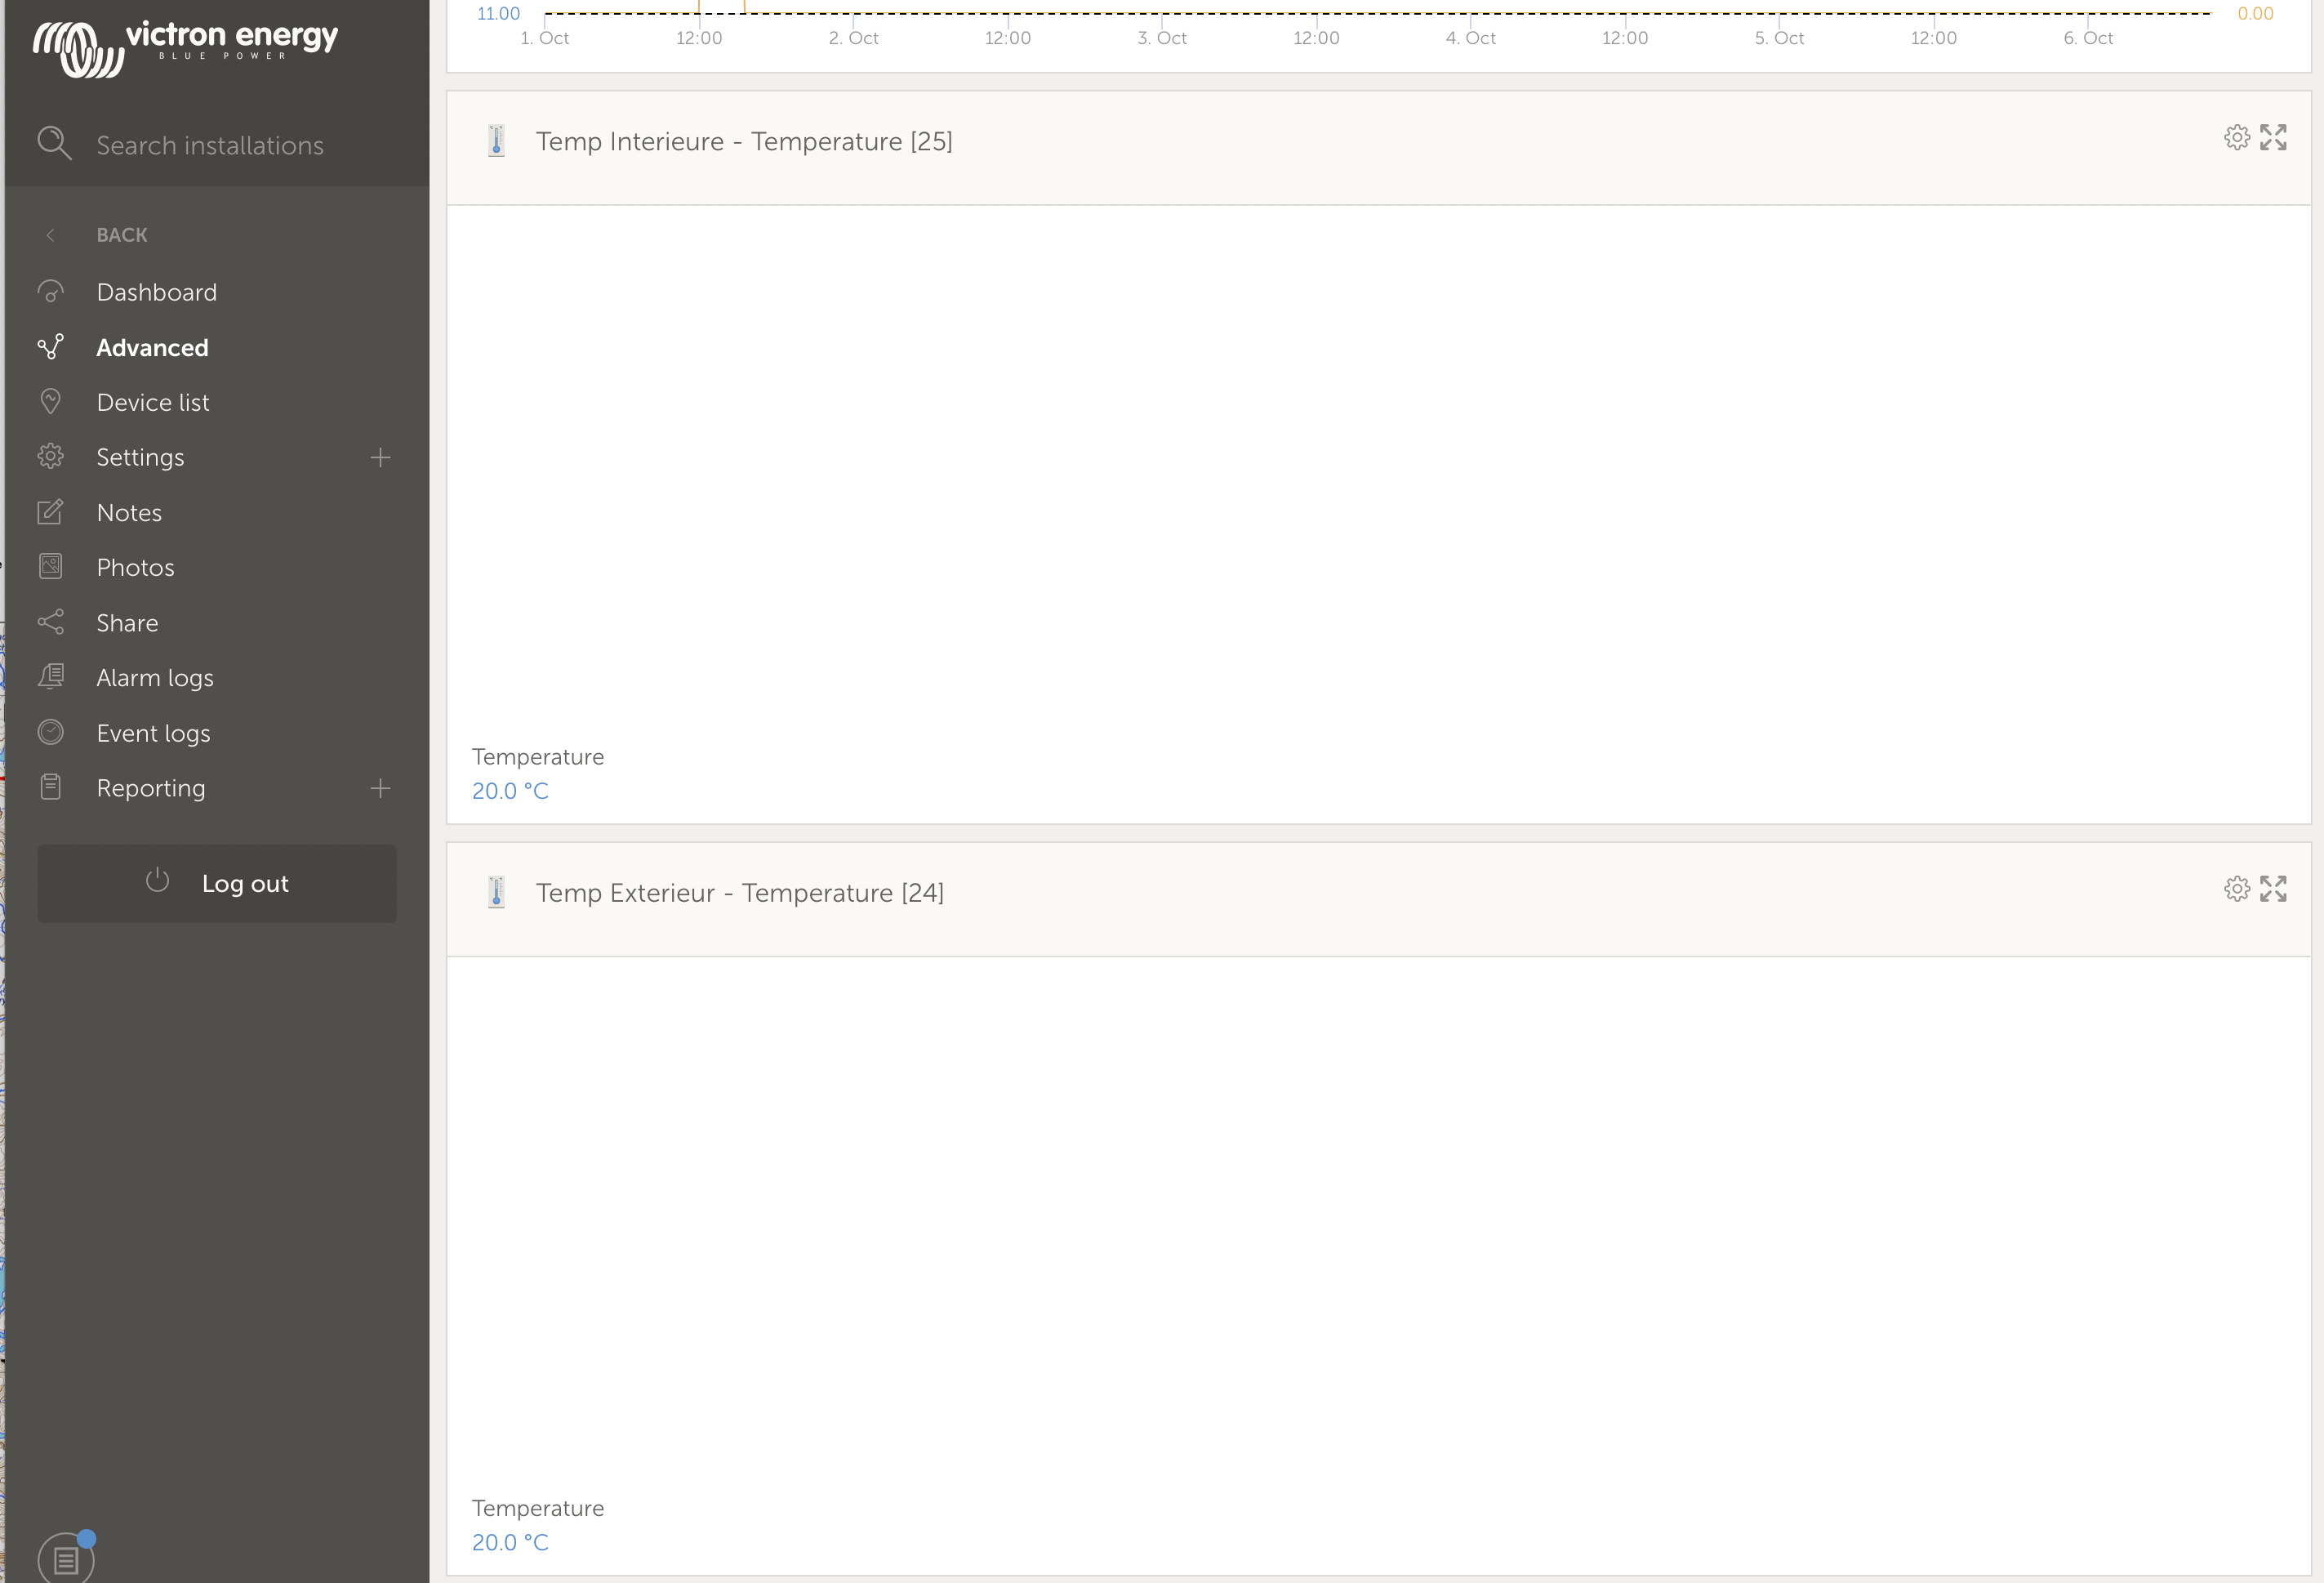
I have 4 temperature probes, displaying ok in VRM dashboard tab but no graph in VRM advanced tab
Used to work, but today nothing appear
Cerbo 3.10
thank you for your help
This site is now in read-only archive mode. Please move all discussion, and create a new account at the new Victron Community site.
I have 4 temperature probes, displaying ok in VRM dashboard tab but no graph in VRM advanced tab
Used to work, but today nothing appear
Cerbo 3.10
thank you for your help
It was reported a few days ago
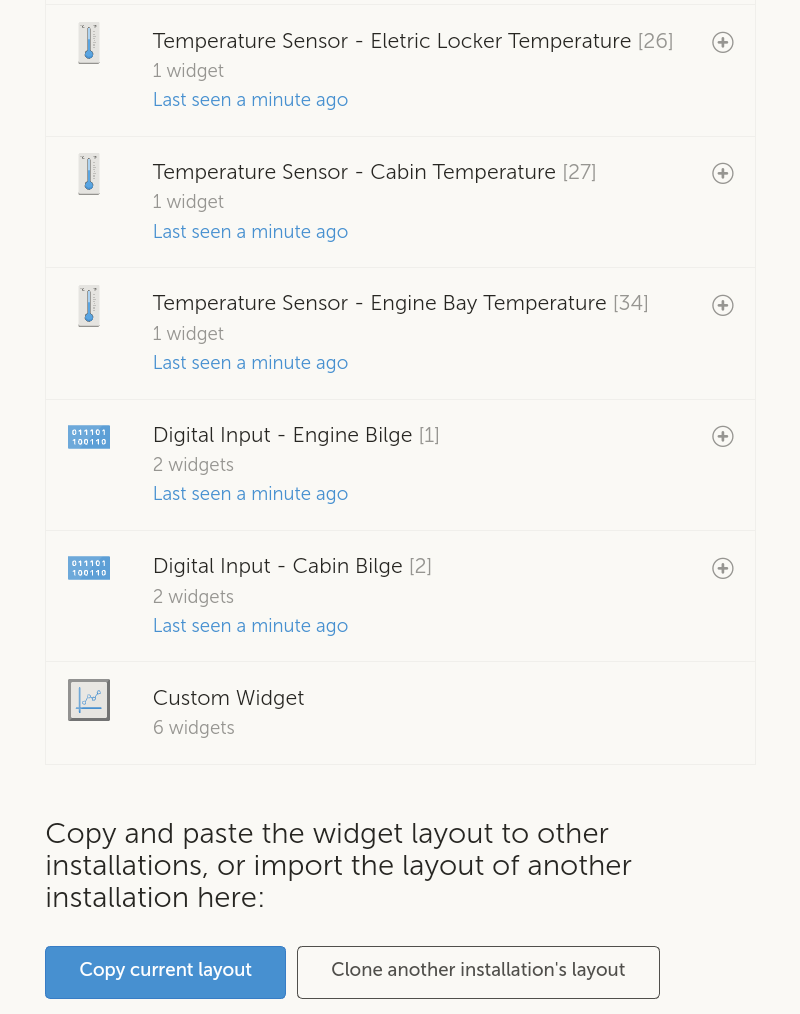
A work around right now is make a custom graph and the information appears there.
Not the custom date range, the actual custom chart, called a custom widget. If you select the settings button to add a new chart, right down at the bottom of the list is an option for custom widget. My Ruuvi is working in a custom chart.

Additional resources still need to be added for this topic
42 People are following this question.