question

Guy Stewart (Victron Community Manager) avatar image

New VRM feature - solar forecast

Hi Victron Community,

We've just launched a new solar forecast feature for VRM.
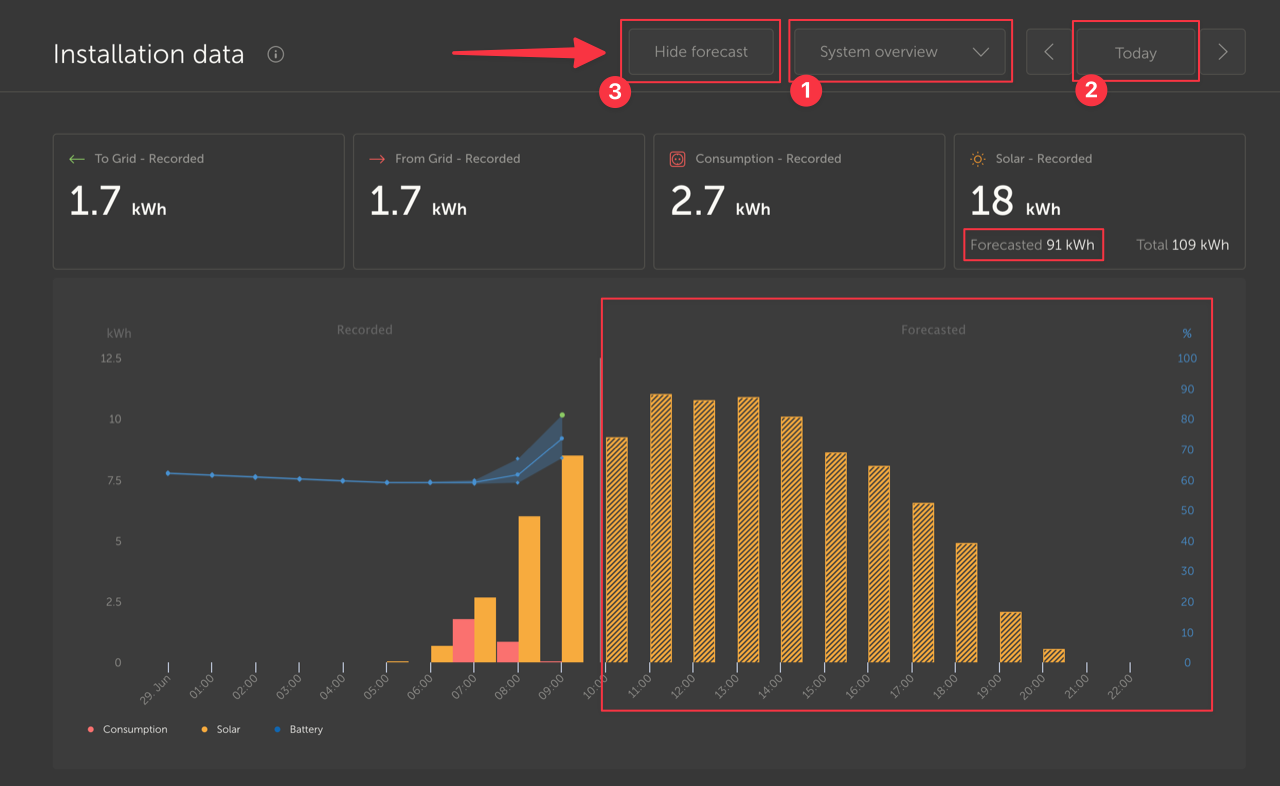

solar-estimate.png


To use this, make sure you fulfil all the requirements:

  • Your installation has a location set
  • Your site is recording hourly solar yield
  • You are on the ‘today’ view

The major changes include:

  • Calculate the forecast based on forecasted solar irradiance
  • Change layout of the installation data graphs to have more space for the forecast
  • Show the recorded, forecasted and expected total production for today
  • Include the forecast per hour until 24:00 in the system overview graph
  • Add a ‘solar irradiance’ widget on the advanced page


All the information you should need is here at the Victron Blog article about it.


We'd love to hear any feedback. Encouragement for the team, issues with the user interface, either suggestions for improvement or bugs. We are still improving the estimation algorithm, so are interested in reports of any unusual or impossible estimates.


We hope you enjoy this new feature :)

VRM
solar-estimate.png (207.7 KiB)
7 comments
2 |3000

Up to 8 attachments (including images) can be used with a maximum of 190.8 MiB each and 286.6 MiB total.

nachtsonne72 avatar image nachtsonne72 commented ·
Der All,

great feature for cost optimization, tx. Could you please extend the Modbus TCP.xls with "forecasted" accordingly? The Arduino micro controller community might appreciate that a lot.

Regards,

G

1 Like 1 ·
regman54 avatar image regman54 commented ·
Okay, I have to ask. It looks like an interesting project but I'm wondering what benefit it will bring me knowing the solar forecast? Is this just different twist on a common weather forecast that says it's going to cloudy, partly cloudy, or sunny today? Armed with that solar forecast knowledge what am I supposed to do with it? Not trying to be cheeky but what am I not understanding? Must be something. Thank you.
0 Likes 0 ·
Peter avatar image Peter regman54 commented ·
You can charge battery with cheap power (eg. during the night) to such level than you have place for power from PV during the day. This is what my program does.
0 Likes 0 ·
Craig Chamberlain avatar image Craig Chamberlain regman54 commented ·
I find it useful to know how much generation I’m likely to get in the next 24-48 hours so that I can choose to export more or less of my battery power to the grid. But if it’s going to be a bad day for generation tomorrow then I’m more inclined to keep my batteries at a higher state of charge to ensure I don’t need to import grid energy.

Another way to think of it is as follows, for my Octopus Go Faster tariff:

Peak rate grid import is ~40p/kWh

Off-peak grid import is ~8p/kWh

Export is ~4p/kWh

So if I export too much at 4p, and then have to import again the next day at either 8p or worse still 40p, then I will lose either 4p or 36p per kWh. But on the other hand, if I don’t export the power and the next day is really sunny then my batteries end up full by 10am and I don’t get the full benefit of my PV generation.

HTH

0 Likes 0 ·
regman54 avatar image regman54 regman54 commented ·
Ah, Okay. Now I see where you're coming from. I'm new to all this so thanks for the clarification. Cheers.
0 Likes 0 ·
daniel-feist avatar image daniel-feist commented ·
Love the PV forecast. Are these values available via RS485 registers?


A few questions/ideas:

- Will you be supporting the battery level forecast for ESS and not just DESS?
- Will the "grid" installation summary be enhanced to include export and not just import? (I see the beta has the totals, but nothing on the graph yet)
- The summary graphs for grid/consumption/solar are fantastic, but something battery centric seems to be missing and would be really useful.

0 Likes 0 ·
graham-willsher avatar image graham-willsher commented ·

Hi @Guy Stewart (Victron Community Manager),

Firstly, congratulations on a fantastic product, and the taking of a big step to try and get forecasting working.

Please excuse the simple question.

I have currently got my Victron Multiplus to be set up using node red to force discharge my batteries at a specified time - everything is working well. I also have manged to set the charging schedule within Victron to charge my batteries within the cheap electricity window that Octopus offer.

I have looked at the DESS but the current version did not seem to give the results that I expected so I have turned it off for the moment, I know that forecasting energy usage and the weather is a nightmare to get right especially with your market being worldwide and the different regulations that you must try and please.

I now want to try and modify my schedule charging window to reflect the forecast solar for the next day so that I use my batteries more efficiently.

So to my question.

I have used node red (using the VRM API) to get the forecast invertor yields to see what the coming forecast is, but I can't find a node red function that will get me the installation historical data for my site. Is there such a thing or is it something that I have to write my own functions to carry out the necessary HTTP calls? I have spent the day trying to find such a thing but to no avail.

If you could point me in the right direction that would be much appreiciated.

Thanks,

Graham.

0 Likes 0 ·
87 Answers
essah avatar image
essah answered ·

Thanks for the new feature!

2 |3000

Up to 8 attachments (including images) can be used with a maximum of 190.8 MiB each and 286.6 MiB total.

valerion avatar image
valerion answered ·

Currently the forecast works quite well for my system.

Since this is machine-learning based on past trends, how long would it takefor the system to adapt to changes in the panels themselves? I am getting a new MPPT charge controller soon to resolve a panel facing problem, and would likely in a year's time add quite a few panels. In that case the historic values should tend to lower the forecast for at least some time.

2 comments
2 |3000

Up to 8 attachments (including images) can be used with a maximum of 190.8 MiB each and 286.6 MiB total.

Hi @Valerion,

Given it's a machine learning model, it's still a little bit of mystery to me how long (and exactly how) the system adapts to changes. The idea is that no matter what you do with the system though, every day the forecast will get more accurate based on the results of the past.

With no basis but my own expectations - I would hope that after a week it should be quite good.

It would be great to keep an eye on it and report back to let us know.


0 Likes 0 ·
mvader (Victron Energy) avatar image mvader (Victron Energy) ♦♦ Guy Stewart (Victron Community Manager) ♦♦ commented ·
Hi both, it looks 28 days back.
0 Likes 0 ·
Rory Powis avatar image
Rory Powis answered ·

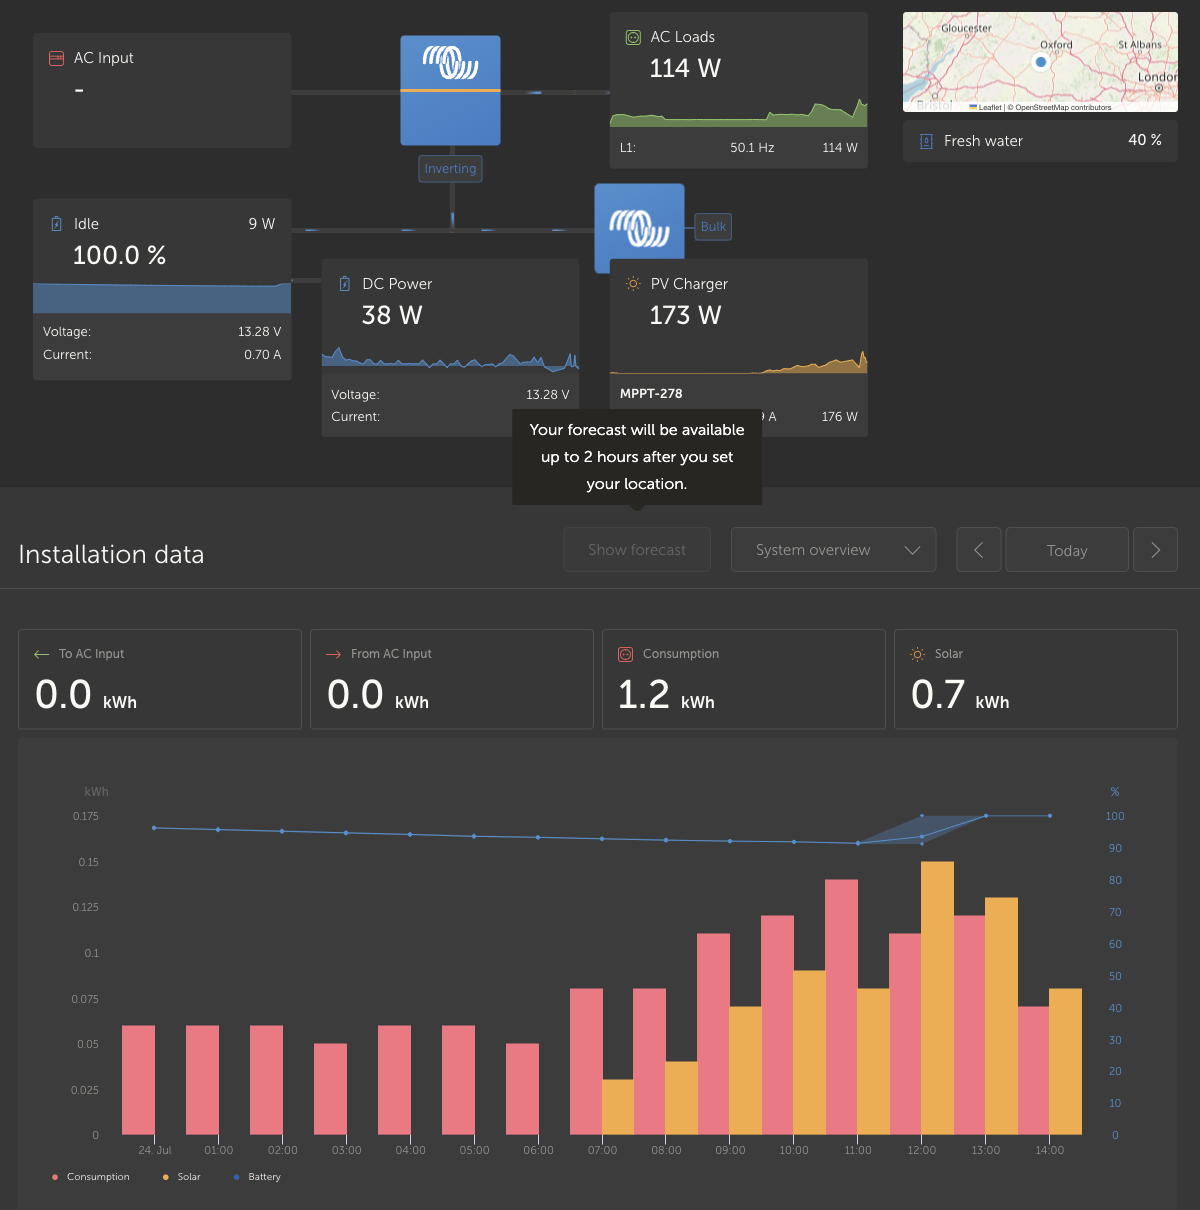
Really looking forward to this feature, but when I hover over the "Show forecast" button I'm shown a tooltip saying "Your forecast will be available up to 2 hours after you set your location".

As you can see from my screenshot, my location is set and has been for much longer than 2 hours (I last set it over 24 hours ago).

Is the tooltip message poorly worded and it's a case of waiting for longer? Or should I be seeing the forecast by now?

Thanksvrm-no-forecast.png


vrm-no-forecast.png (211.5 KiB)
4 comments
2 |3000

Up to 8 attachments (including images) can be used with a maximum of 190.8 MiB each and 286.6 MiB total.

Barbara (Victron Energy) avatar image Barbara (Victron Energy) ♦ commented ·
2 hours is a conservative estimate, so you should be seeing it already. Let me check why you don't!
0 Likes 0 ·
Rory Powis avatar image Rory Powis Barbara (Victron Energy) ♦ commented ·
Thanks! Let me know if you need more information to help with the investigation.
0 Likes 0 ·
Barbara (Victron Energy) avatar image Barbara (Victron Energy) ♦ Barbara (Victron Energy) ♦ commented ·
Hi, it seems like your installation has no realtime connection anymore. Without recent data, we cannot show the forecast. Let me know if we can anything to help you get the installation up and running.
0 Likes 0 ·
Rory Powis avatar image Rory Powis Barbara (Victron Energy) ♦ commented ·
Our system was turned off while we were away for a few days but I checked this morning and we seem to have forecasting! Thanks for your help
0 Likes 0 ·
m5115 avatar image
m5115 answered ·

Hi,

I set location 3 days ago, the forecast is not working. The button is greyed out.

Thanks for your help

forecast copy.png

2 |3000

Up to 8 attachments (including images) can be used with a maximum of 190.8 MiB each and 286.6 MiB total.

Masquelier Pierre avatar image
Masquelier Pierre answered ·

Wow amazing: This functionality is very usefull. I am in the North of France and the results are bluffing.
I use this feature to estimate the rest of the power availability of the installation. manually!

Is automation planned to switch ON non-priority loads off-grid?
The efficiency of the installation should be greatly increased!
Pierre

2 |3000

Up to 8 attachments (including images) can be used with a maximum of 190.8 MiB each and 286.6 MiB total.

mane avatar image
mane answered ·

It worked great for a few days. Since a week or so the prognosis bars in the chart disapeared. Is there any clou or hint ?vrm-prognosis.png


vrm-prognosis.png (59.1 KiB)
2 comments
2 |3000

Up to 8 attachments (including images) can be used with a maximum of 190.8 MiB each and 286.6 MiB total.

mvader (Victron Energy) avatar image mvader (Victron Energy) ♦♦ commented ·
Hi! Has this been solved for you in the meantime? There were some issues in the past days
0 Likes 0 ·
m5115 avatar image m5115 mvader (Victron Energy) ♦♦ commented ·

yes, I got it to work by switching on two-way communication VRM Portal options, see also neighbor thread

https://community.victronenergy.com/questions/215684/early-preview-of-new-vrm-solar-production-forecast.html?childToView=221091#answer-221091


0 Likes 0 ·
Masquelier Pierre avatar image
Masquelier Pierre answered ·

hello, very good functionality.
My station Off Grid is in the north of France and the predictions are very accurate.

I use this function to increase the efficiency of my station .And I estimate the remaining power available by hand to activate non-priority loads.

If the communication hardware is able to receive information in the Venus OS, do you plan to automate a function to switch a relay if the instantaneous power consumed locally is lower than predicted?.
Pierre

1 comment
2 |3000

Up to 8 attachments (including images) can be used with a maximum of 190.8 MiB each and 286.6 MiB total.

mvader (Victron Energy) avatar image mvader (Victron Energy) ♦♦ commented ·
Hi Pierre, most likely at some point - yes.


Until then, for anything like that, look for “Victron Venus OS Large” and “Victron Node-RED” in google. That is the most flexible tool we have and allows automations based on forecast now

0 Likes 0 ·
mr-manuel avatar image
mr-manuel answered ·

Is this feature only working for solar chargers or should it also work for PV inverters connected on the AC side?

I read all the comments but did not find this info.

2 comments
2 |3000

Up to 8 attachments (including images) can be used with a maximum of 190.8 MiB each and 286.6 MiB total.

mvader (Victron Energy) avatar image mvader (Victron Energy) ♦♦ commented ·
Hi @mr-manuel , yes. It also works for PV Inverters
0 Likes 0 ·
mr-manuel avatar image mr-manuel mvader (Victron Energy) ♦♦ commented ·

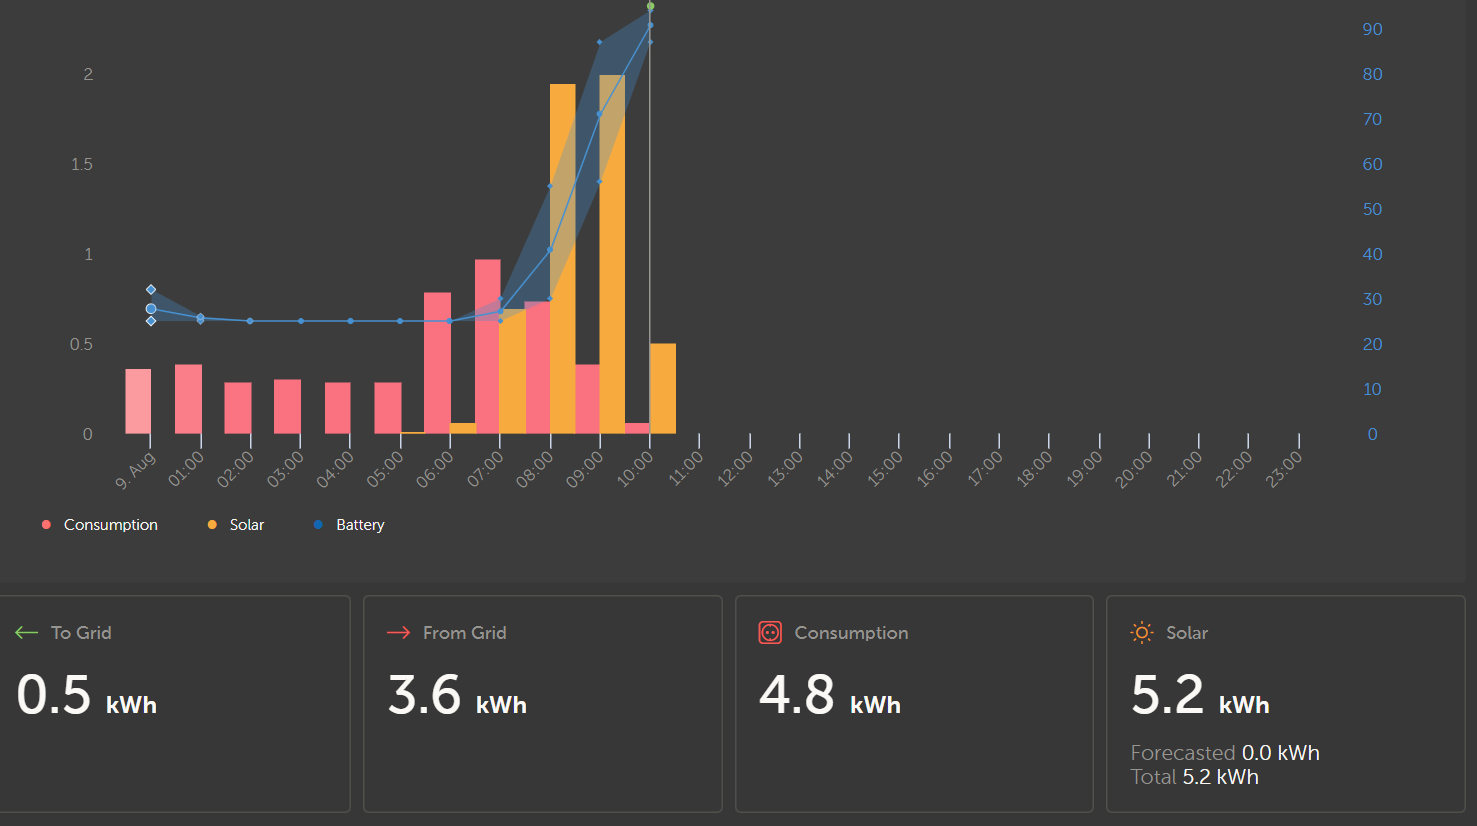
Unfortunately the graph is not shown, but somehow in the bottom right a forecast value is shown:
1690624418199.png

0 Likes 0 ·
1690624418199.png (64.4 KiB)
Masquelier Pierre avatar image
Masquelier Pierre answered ·

hello, Good job. even in rainy weather. Forecast is overestimated by 10%

What is the next step?
Give a min, nom, max forecast power?
The forecats are correct if you manage to make the real may be just near the predicted min and max.

pierre

3 comments
2 |3000

Up to 8 attachments (including images) can be used with a maximum of 190.8 MiB each and 286.6 MiB total.

mvader (Victron Energy) avatar image mvader (Victron Energy) ♦♦ commented ·
Hi! There are a few things we’ll be looking at to see if we can further improve accuracy.


And one thing is, for offgrid, or zero feed-in sites, available solar power over the whole day (if battery is never full) versus realistic solar power which once battery is full drops and is no longer at its max. Which is also a factor when checking how “accurate” the algorithm is. If the battery was full in the morning, and forecast shows 20kW. But loads were only 5 so total yield was 5: is now the algorithm a factor 4 wrong?

Things like that will be detailed more by us.

0 Likes 0 ·
ako avatar image ako mvader (Victron Energy) ♦♦ commented ·

I also noticed that , my forecast is mostly around 7kw but my input at the end of day is only 25% to 50% of that as my batteries are fully charged by mid day so the greater my consumption is after that the less the disparity between forecast and actual . For the forecast to be anywhere near accurate the batteries should remain in Bulk charge all day as once in Absorption a percentage of the forecasted input is lost .

0 Likes 0 ·
seb71 avatar image seb71 ako commented ·

For the forecast to be anywhere near accurate the batteries should remain in Bulk charge all day as once in Absorption a percentage of the forecasted input is lost .

Does not have to be in Bulk. They can be in any stage (even in Float) if all the available power (any extra power not used for battery charging) is consumed by some loads.

0 Likes 0 ·
larsea-dk avatar image
larsea-dk answered ·

Hi

Really great and useful feature, which I prior to this have visualized in my NodeRed. Great to have it in one place and really well made by the design team!

But is the “weather widget” needed anymore? For me it only take up space and the forecast is much more useful.

Thank you for the great VRM app!! Really appreciated and one of the reasons I choose Victron.

BR,

Lars (Denmark)

2 |3000

Up to 8 attachments (including images) can be used with a maximum of 190.8 MiB each and 286.6 MiB total.

janosch avatar image
janosch answered ·

Thanks for this great feature,
it is already pretty useful.

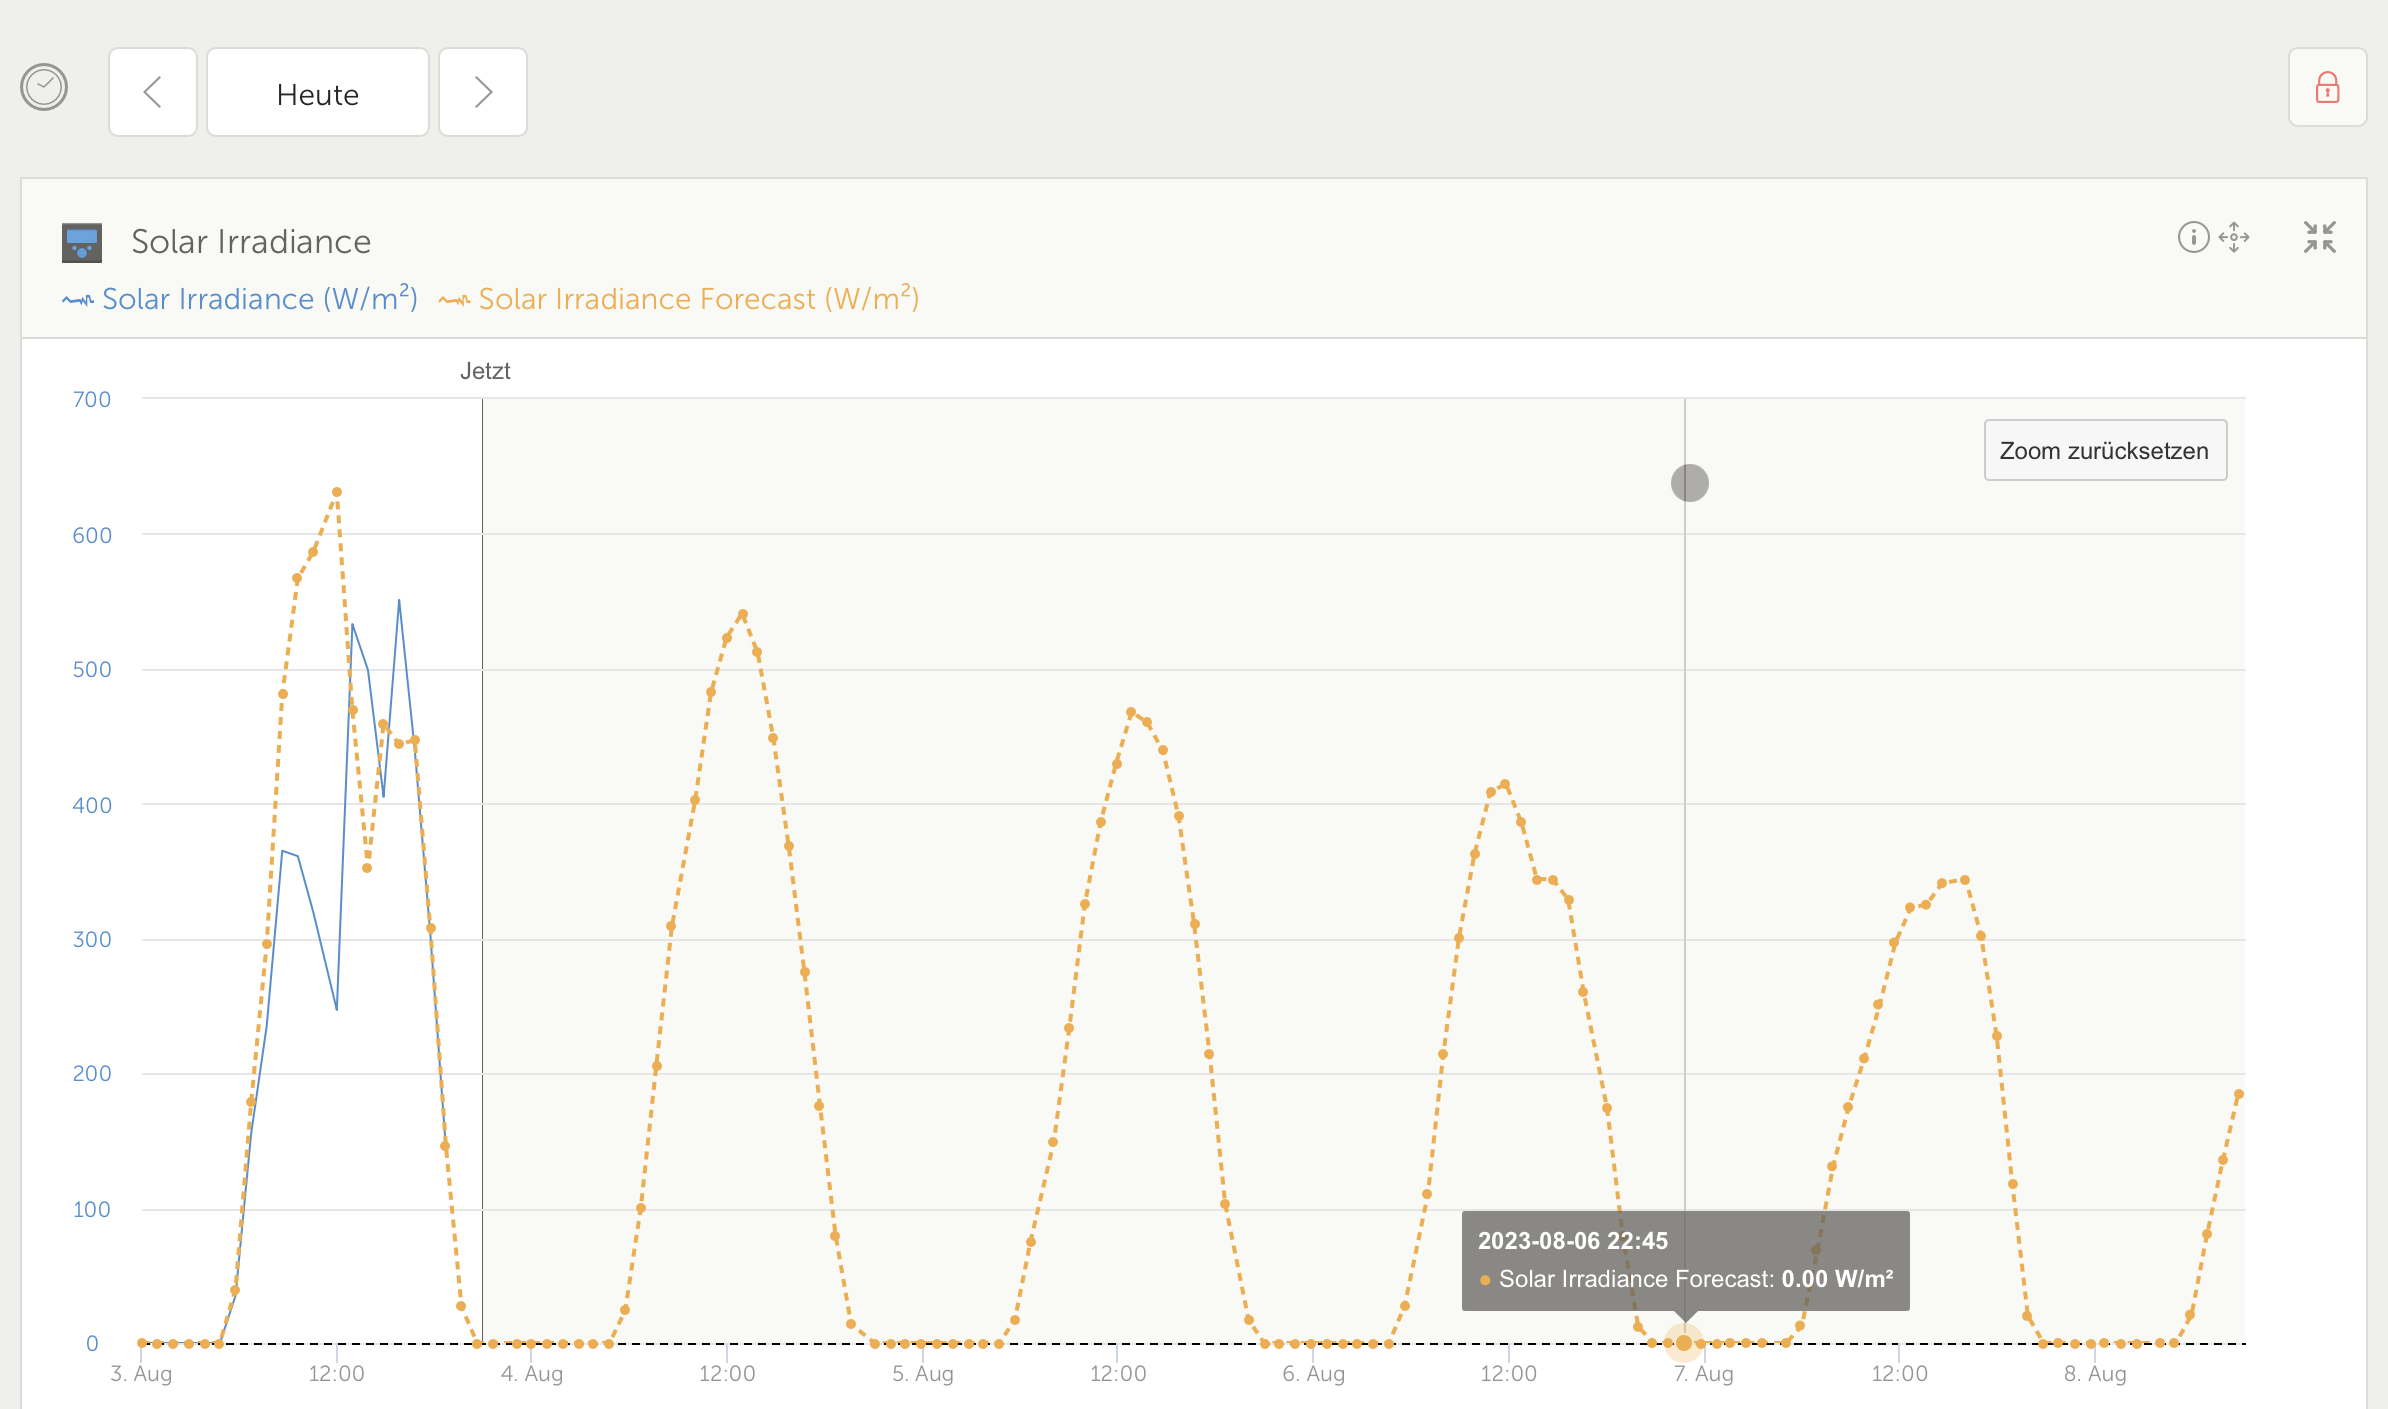
As it seems like the forcast is already for more than 4 days in advance (with and move in the Solar Irradiance view) , it would be great to t have information available in other views in VRM or be able to access the next day(s) with “>”. For me It would also help to have an estimated sum (per day) .

img-1965.jpeg


As you are already dealing with forcasts - it would also help to see the (price per kWh/hour (forecasted and history) from the ”ENTSO-E Transparency Platform”

Really Great to see yo u advancing into this direction!!!!!


img-1965.jpeg (585.7 KiB)
2 |3000

Up to 8 attachments (including images) can be used with a maximum of 190.8 MiB each and 286.6 MiB total.

mo75 avatar image
mo75 answered ·

Hi and thanks for the great feature!


How does the system react if I change my solar configuration eg number /orientation of panels/MPPT/connection?

Can I reset something by myself or have I to wait until the system is learning the new configuration?


Best regards,

Mario

1 comment
2 |3000

Up to 8 attachments (including images) can be used with a maximum of 190.8 MiB each and 286.6 MiB total.

mo75 avatar image mo75 commented ·
No ideas how the self learning algorithm works?
0 Likes 0 ·
wolferl avatar image
wolferl answered ·

Hi

great feature and will replace my Solcast Implementation. Node Red works well also.


Are there any plans to extend the forecast to 3 days?

KR

wohlfeil

5 comments
2 |3000

Up to 8 attachments (including images) can be used with a maximum of 190.8 MiB each and 286.6 MiB total.

Peter avatar image Peter commented ·
Forecast is for 7 days
0 Likes 0 ·
wolferl avatar image wolferl Peter commented ·

Hi


Thank you for your answer. In my VRM portal, the forecast is only displayed for 1 day. Is there any setting to change that?

I plan to use the forecast as well in Node Red. For that reason I set up a test flow. Doing that, I use the VRM API node. In that node you can only choose +24h as forecast for the inverter yield.

Do I use the wrong node?

bildschirmfoto-2023-08-09-um-130259.png


0 Likes 0 ·
Show more comments
pavol-rehak avatar image
pavol-rehak answered ·

Hello

I have setup the forecast feature 4 days ago but still shows 0 as forecast. Not sure what else to change as per the discussion this should already be working without hassle. Could you please have a look and help me to setup this correctly?


1691569039463.png


1691569039463.png (67.0 KiB)
3 comments
2 |3000

Up to 8 attachments (including images) can be used with a maximum of 190.8 MiB each and 286.6 MiB total.

Hi @Pavol Rehak,


Apologies, we are still working on the exact wording for how long it takes for solar forecast data to appear under different circumstances. It varies depending on a few different factors.

I am quite sure that your forecast will appear in the next 48 hours - if it does not - please report back.

Also worth noting that it can take up to 28 days to reach maximum accuracy, so do not be surprised if the next few days are a bit strange, it will gradually improve as it learns.

Then in a future update we will make a change to the user interface to make it clearer for each site.

1 Like 1 ·
rotevery avatar image rotevery Guy Stewart (Victron Community Manager) ♦♦ commented ·

I have solar production forecasting configured and working on two virtually identical sites (same suite of Victron equipment and networking). On one of the sites everything is working as expected. On the other site, though solar forecasts are showing on the main VRM page, there is no ‘solar irradiance’ widget on the advanced page. None of the widgets that were introduced with the release of the solar production forecasting feature is showing on the advance page. This has been so for weeks now. Please what is the solution to this issue?

0 Likes 0 ·
rotevery avatar image rotevery rotevery commented ·

Now resolved. Didn't know I had to manually select the widgets that will display on the advanced tab. Now done and everything I want is showing. Did not do that for the other side. Have now rationalized the widgets for the other site that I had had no issue with as well.

0 Likes 0 ·
ips-ad avatar image
ips-ad answered ·

Hi, this looks like a really great feature, thanks a lot! We'll certainly use it to optimize heat pumps and more.

But I think something may be wrong with my two sites, I set locations approx. 4 days ago and still see zero forecast (0 kWh). The "Solar Irradiance" widget is present though and also showing plausible values and forecast. Did I miss some setting maybe, do I just have to wait longer?

2 comments
2 |3000

Up to 8 attachments (including images) can be used with a maximum of 190.8 MiB each and 286.6 MiB total.

ips-ad avatar image ips-ad commented ·

I'm still getting 0 kWh - location has been set almost a week ago now. @mvader (Victron Energy) or someone from your team, could you have a look please?

1691762777958.png 1691762755252.png

0 Likes 0 ·
1691762755252.png (59.1 KiB)
1691762777958.png (24.9 KiB)
ips-ad avatar image ips-ad ips-ad commented ·
Hey again, it started working now, first forecast appeared (but it took 1 whole week instead of 48 hours). Forecast does look a little rough so far, but I guess it's learning now, maybe even started to learn only from today on... I'll observe it with much interest :-D
0 Likes 0 ·
Peter avatar image
Peter answered ·

My test of VRM forecast:


58963-1691318781987.png


"Corrected" is corrected forecast based on average hour differents from last 28 days.


2 |3000

Up to 8 attachments (including images) can be used with a maximum of 190.8 MiB each and 286.6 MiB total.

JohannesGross avatar image
JohannesGross answered ·

Congratualtions for your great approach! :-) This makes Victron even more valuable apart from great product quality.

Several contributors requested to see the forecast data for past hours. This seem valuable for me too but it is tricky as the forecast changes over the day. My suggestion is to generate a graph pretty similar to SOC graph. There you can show the course and variance in a very clear manner, while preventing occupation of much space inside the overall display.

2 |3000

Up to 8 attachments (including images) can be used with a maximum of 190.8 MiB each and 286.6 MiB total.

para756 avatar image
para756 answered ·

Using this new feature lately. Worked great until I had to replace my pv meter. Now I get double the prognosos, also the old meter is not present anymore. Someone knows hot to fix that?

4 comments
2 |3000

Up to 8 attachments (including images) can be used with a maximum of 190.8 MiB each and 286.6 MiB total.

Hi @para756,


It can take up to 28 days for the system to automatically recalibrate if you have made a change to the configuration.

0 Likes 0 ·
mo75 avatar image mo75 Guy Stewart (Victron Community Manager) ♦♦ commented ·
Thanks for that information.

It might be useful to implement a manual reset function for that.

1 Like 1 ·
para756 avatar image para756 mo75 commented ·

Thanks for the reply @Guy Stewart (Victron Community Manager) @Mo75

It's now about 23 days. Ive got a data correction is still in place. This makes it kind of usable. A manual reset would be great.

This seems to give some hint to the internal workings and the cause of the problem. I guess the removed meter still gets predicted while the new meter is added. So there is a prediction per meter and not on the whole system.

If the meter is removed the prediction shall be removed too.

1693644990460.png


if (time >= currentTimestamp - oneHourInMilliseconds) power /= 2
if (power > peakPv ) power = peakPv
1 Like 1 ·
1693644990460.png (253.4 KiB)
Guy Stewart (Victron Community Manager) avatar image Guy Stewart (Victron Community Manager) ♦♦ para756 commented ·
There has been a manual reset function added in the set location menu of VRM.


If you reset your location it should start again.
0 Likes 0 ·
vicfan avatar image
vicfan answered ·

Thanks a lot for this great feature! :-)

Currently I am using SolCast API in my own Perl application to integrate forecast data into home automation.

Is there already an endpoint in the VRM API to retrieve the forecast data of the own PV system? I didn't find it in the API documentation.

I would like to replace the native SolCast API with the forecast from VRM.

2 comments
2 |3000

Up to 8 attachments (including images) can be used with a maximum of 190.8 MiB each and 286.6 MiB total.

Peter avatar image Peter commented ·
https://vrmapi.victronenergy.com/v2/installations/<instalation id>/stats?type=forecast&interval=hours&start=<start date and time>&end=<end date and time>
2 Likes 2 ·
vicfan avatar image vicfan Peter commented ·

Thank you very much for the hint. I will try it out :-)

0 Likes 0 ·
rotevery avatar image
rotevery answered ·

I have solar production forecasting configured and working on two virtually identical sites (same suite of Victron equipment and networking). On one of the sites everything is working as expected. On the other site, though solar forecasts are showing on the main VRM page, there is no ‘solar irradiance’ widget on the advanced page. None of the widgets that were introduced with the release of the solar production forecasting feature is showing on the advance page. Please what is the solution to this issue?

2 comments
2 |3000

Up to 8 attachments (including images) can be used with a maximum of 190.8 MiB each and 286.6 MiB total.

mo75 avatar image mo75 commented ·
Maybe your browser has cached an old version of the web page? Try to reload or delete cache.
0 Likes 0 ·
rotevery avatar image rotevery commented ·

Now resolved. Didn't know I had to manually select the widgets that will display on the advanced tab. Now done and everything I want is showing. Did not do that for the other side. Have now rationalized the widgets for the other site that I had had no issue with as well.

0 Likes 0 ·
spajor avatar image
spajor answered ·

Very nice and interessting feature!
Would it be possible to state the estimated daily / weekly / monthly/ yearly performance in comparrisson the real performance? (due to grid feed regulations / orientation / system losses) and on a long-term basis for degradation of the installation?

2 |3000

Up to 8 attachments (including images) can be used with a maximum of 190.8 MiB each and 286.6 MiB total.

semlohnhoj avatar image
semlohnhoj answered ·

Just want to say thank you to Victron for the latest update of the widget on Android to show the forecasted solar for the day. Got this on my home page on my phone, FANTASTIC!

screenshot-20230831-095609-one-ui-home.jpg


2 |3000

Up to 8 attachments (including images) can be used with a maximum of 190.8 MiB each and 286.6 MiB total.

urs4-2008 avatar image
urs4-2008 answered ·

Could you please also put in an option to add future SoC based on the last days consumtion and current SoC? That way it will be very easy to see if batteries will be full before next use of cabin, or similar.

1 comment
2 |3000

Up to 8 attachments (including images) can be used with a maximum of 190.8 MiB each and 286.6 MiB total.

Hi @urs4_2008,

I've passed this feature request onto the team.

2 Likes 2 ·
martin-morava avatar image
martin-morava answered ·

předpověď je skvělá a pro nás i karavany velmi přínosná. Zkusil jsem změnit lokalitu, abych viděl předpověď v místě, kam jedu nebo abych se podíval na místa, která znám, abych porovnal, jak to tam teď vypadá. Změna místa však předpověď vůbec nezměnila a předpověď je stále stejná pro Malagu i Stockholm.

2 |3000

Up to 8 attachments (including images) can be used with a maximum of 190.8 MiB each and 286.6 MiB total.

wdh123 avatar image
wdh123 answered ·

Why are the VRM Dashboard solar forecast and the API forecast different ?

VRM dashboard forecasts 8.5 kWh.

vrm_solar_irradiance_fc forecasts only 2369 Watts for the same interval.

Below some screenshots of forecast for 16 Oct generated on 15 Oct

Dashboard:

1697383016006.png


API query: https://vrmapi.victronenergy.com/v2/installations/xxxxxx/stats?type=custom&attributeCodes[]=vrm_solar_irradiance_fc&interval=hours&start=1697432400&end=1697475600"

1697384327174.png


1697383016006.png (142.1 KiB)
1697384327174.png (132.2 KiB)
2 |3000

Up to 8 attachments (including images) can be used with a maximum of 190.8 MiB each and 286.6 MiB total.

wdh123 avatar image
wdh123 answered ·

Burried deep in this blog there is an answer from Peter stating that the URL is https://vrmapi.victronenergy.com/v2/installations/<instalation id>/stats?type=forecast&interval=hours&start=<start date and time>&end=<end date and time> .

Indeed, with that URL the results from the API match the data displayed in the Dashboard.

Maybe someone could update the VRM API documentation and add 'forecast' on page https://vrm-api-docs.victronenergy.com/#/operations/installations/idSite/stats


1697469209283.png


1697469209283.png (63.8 KiB)
1 comment
2 |3000

Up to 8 attachments (including images) can be used with a maximum of 190.8 MiB each and 286.6 MiB total.

Thanks for that @wdh123

I have passed on the suggestion to the VRM team.

0 Likes 0 ·
samuel-brucksch avatar image
samuel-brucksch answered ·

Hi @Guy Stewart (Victron Community Manager)

Thanks for this awesome feature, I'm currently trying to utilize it for a lookahead in combination with cheap grid prices. However I noticed, that the forecast became pretty inaccurate recently. It worked fine during (end of) summer, but now that it gets more cloudy and the sun is lower, it is quite off most of the time. Like predicting 11kWh, but I only got 3 in the end. Other days are not so much off, but it clearly does not match properly.

As I use an external PV Inverter, Victron actually doesn't have any knowledge about my PV Installation, so I was wondering if it would be possible to specify that somewhere, so the prediction would get more accurate.

As side note: I use a MP-II as AC coupled battery charger and inverter.

Thanks

Samuel

1 comment
2 |3000

Up to 8 attachments (including images) can be used with a maximum of 190.8 MiB each and 286.6 MiB total.

Hi @Samuel Brucksch

A review and adjustment of the prediction algorithm to increase the weight of the weather prediction is on the data scientist's to-do list. No time frame yet sorry.

1 Like 1 ·
kocki avatar image
kocki answered ·

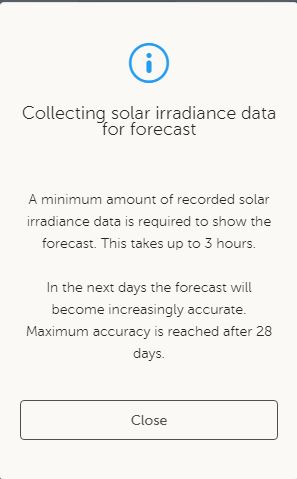
Show forecast in the dashboard tab is not Working on my VRM installation.
collecting-solar-irradiance-data-will-takeup-to-3.jpg

I waited for more than 24 hours, but nothing happend.

The Solar Irradiance widget in the advanced tab shows enough data:

solar-irradiance.jpg

Has somebody any idea how to fix it?

Gerd


2 |3000

Up to 8 attachments (including images) can be used with a maximum of 190.8 MiB each and 286.6 MiB total.

kocki avatar image
kocki answered ·

The problem is a attached GPS mouse, see here:
https://community.victronenergy.com/questions/215684/early-preview-of-new-vrm-solar-production-forecast.html?childToView=243412#answer-243412

Regards,

Gerd

2 |3000

Up to 8 attachments (including images) can be used with a maximum of 190.8 MiB each and 286.6 MiB total.

Duncan Hall avatar image
Duncan Hall answered ·

Please note that forcast operates on the widget on an iphoneshowing

Preview attachment Screenshot 2023-11-19 at 08.02.52.pngScreenshot 2023-11-19 at 08.02.52.png206 KB

but VRM on both an iphone and on a Windows 10 PC gives


1700384245811.png


Note that it worked as expected for a month but has proved problematic singe I added a solar pannel to one om my 2 MPPTs giving it 2 175W Victron mono pannels in series.


1700384245811.png (106.0 KiB)
2 |3000

Up to 8 attachments (including images) can be used with a maximum of 190.8 MiB each and 286.6 MiB total.

dune7 avatar image
dune7 answered ·

I hope I can offer some of my experiences and feedback as requested for the way I’ve been using ESS to help share what is in the field with Victron. I’ve been looking at the forecasting in pre 3.2 version and in beta. Winter forecasting for me is the most important. From November to mid February I’m charging my 10.5kw batteries for 3 hours in Ocotpus Flux( half price charging from 2-5am) peak rate usage 4-7pm, sometimes exporting at very high export reward or zero use reward during peak times from energy grid operator, and using them through peak hours until 7. Daytime solar top ups are crucial and predicting sunshine an important pastime. I used to predict on iOS weather but that turned sour last last year so BBC weather is more accurate for me. I compare the forecast with Victoroms prediction for next day and I have to say VRM is wildly optimistic every time. Estimated of 3-4 kw when actual ware 1.5 or 6kw with 3-4 sometimes. I expected the gap between predicted and actual to slowly close to be more realistic over the last 6 months but not the case. I e resorted in winter to charging to 60% firing 2-5am cheap rate and hoping for good solar from bbc, or if it’s dire then going to 100% on the worst looking day ahead. I’d love to help the predictive learning process by being able to enter my 3.8kw capacity facing SSW at 32° pitch if it would help, or be able to put some feedback in to help the machine learn. My attempts at setting the charge time using the charge timers are based around setting 4 between 0.5 hours and 3 hours in half hours increases and leaving the 5th program as a wildcard. Setting the 4 timers to 90% but never getting there due to my time restrictions seems the best way for me to highly select my charge level based on next day prediction. My wild card 5 program in February is based around setting 60% charge level for 2-5 am at half price and letting it sit at 60% for those 3 hours, I use 4.5kwh daily so this works and allows the sun to contribute to the batteries with the capacity I’ve left empty to make the most of solar over ford charge.

I haven’t felt ready to jump into dynamic ESS from the reports I’ve heard from other users and my experience of the next day predictions first hand being wildly optimistic for solar input.

Also I’ve not jumped into DESS because it seems like use the wizard and set it up or not. I’ve no way of knowing what’s behind the blue button and there’s no emulator for my feel good that it’s not a one way road to DESS that I might regret for the above reasons. If I could have a random access way of dipping a toe in then I might combine my scheduled charging experience with some auto import export trials but I’m way too risk averse currently until the UI / setup a little more visible, for me that is. I run Venus also in a boat on Rpi in all the beta releases but I can’t trial DESS on shore power setup for obvious reasons.

I’d love to have an easier way to import and export using a VRM ui next to “keep batteries charged” rather than turning my iPhone sideways in a pub mid conversation and setting an alarm for 1 hour when my energy provider gives a late message that I can export for £4, £2.50 or £1.25 for an hour, but I’m sure I’ll either leap into DESS or the UI will move from console to VRM in the next few releases maki glide easier.

Thanks for listening and for your team’s relentless dedication programming the best value product range in the world. I’m grateful for every release and bug fix.

2 |3000

Up to 8 attachments (including images) can be used with a maximum of 190.8 MiB each and 286.6 MiB total.

Mark avatar image
Mark answered ·

Hi

This feature was working for me, but it stopped working with the show forecast button, if I click on this it comes up with text about taking up to 28 days. But the forecast does not turn up.

?


img-0670.jpeg


img-0670.jpeg (226.6 KiB)
1 comment
2 |3000

Up to 8 attachments (including images) can be used with a maximum of 190.8 MiB each and 286.6 MiB total.

kocki avatar image kocki commented ·

Are you using a GPS mouse? The forecast is not working, if a GPS mouse is attached, same for me.

Gerd

0 Likes 0 ·
ulfilas avatar image
ulfilas answered ·

In the past the solar forcast lukes qite good but toda is avery rainy day and the forcast on the VRM overview showed a perfect curve. Now at noon the curve is looking closer to realistic values but does not mach to the Solcast Data that are displayed as Solar Irradiance.

1716460320862.png

My thought was that there is a direct relation. But here it is not specially at the morning hours.
1716460251090.png


1716460251090.png (47.7 KiB)
1716460320862.png (21.3 KiB)
2 |3000

Up to 8 attachments (including images) can be used with a maximum of 190.8 MiB each and 286.6 MiB total.

Olaf Krause avatar image
Olaf Krause answered ·

Hello, for me the solar forecast seems absolutely off (factor 2+ wrong)

1722325108205.png

yesterday with same weather forecast (irradiance curve looks good and the same)
1722325135574.png

This leads to charging from the grid and then delivery to the grid since batterie is full too early

1722325252723.png

I was thinking the system should be able to learn from previous days but seems not improving since weeks. Any ideas how I could influence the sun forecast? (location is set correctly)


1722325108205.png (73.1 KiB)
1722325135574.png (62.1 KiB)
1722325252723.png (32.4 KiB)
1 comment
2 |3000

Up to 8 attachments (including images) can be used with a maximum of 190.8 MiB each and 286.6 MiB total.

Olaf Krause avatar image Olaf Krause commented ·

Here again a observation of strange behaviour. It looks like the todays forecast is far more of than the tomorrows (it should be vice versa from a accuracy point of view)
1722410407972.png

Forecast tomorrow is almost double of today

1722410422930.png

where there Irradiance for tomorrow is far lower than for today

1722410436302.png

Yesterday I saw the same, for today ~40-50kWh solar energy - but this morning the forecast dropped to <30 but weather forecast is stable no change. So I would have expected the system to learn from yesterdays data where we produced 62kWh solar with similar weather conditions.
Can I see somewhere what the system uses as basis for this super negative estimations?

0 Likes 0 ·
1722410407972.png (63.0 KiB)
1722410422930.png (51.4 KiB)
1722410436302.png (17.9 KiB)
kocki avatar image
kocki answered ·

I tried it again after a long time and I found this in settings -> location:

Your timezone setting will be updated using the new location only if you do not have it set on the GX device. Forecasts will be unavailable for up to 3 hours after the location change.

When changing the location (more than 10km), your forecast will become available in the next 3 hours.

And it´s working GPS mouse and solar forecast, thanks @Guy Stewart (Victron Community Manager) .

2 |3000

Up to 8 attachments (including images) can be used with a maximum of 190.8 MiB each and 286.6 MiB total.