question

Guy Stewart (Victron Community Manager) avatar image

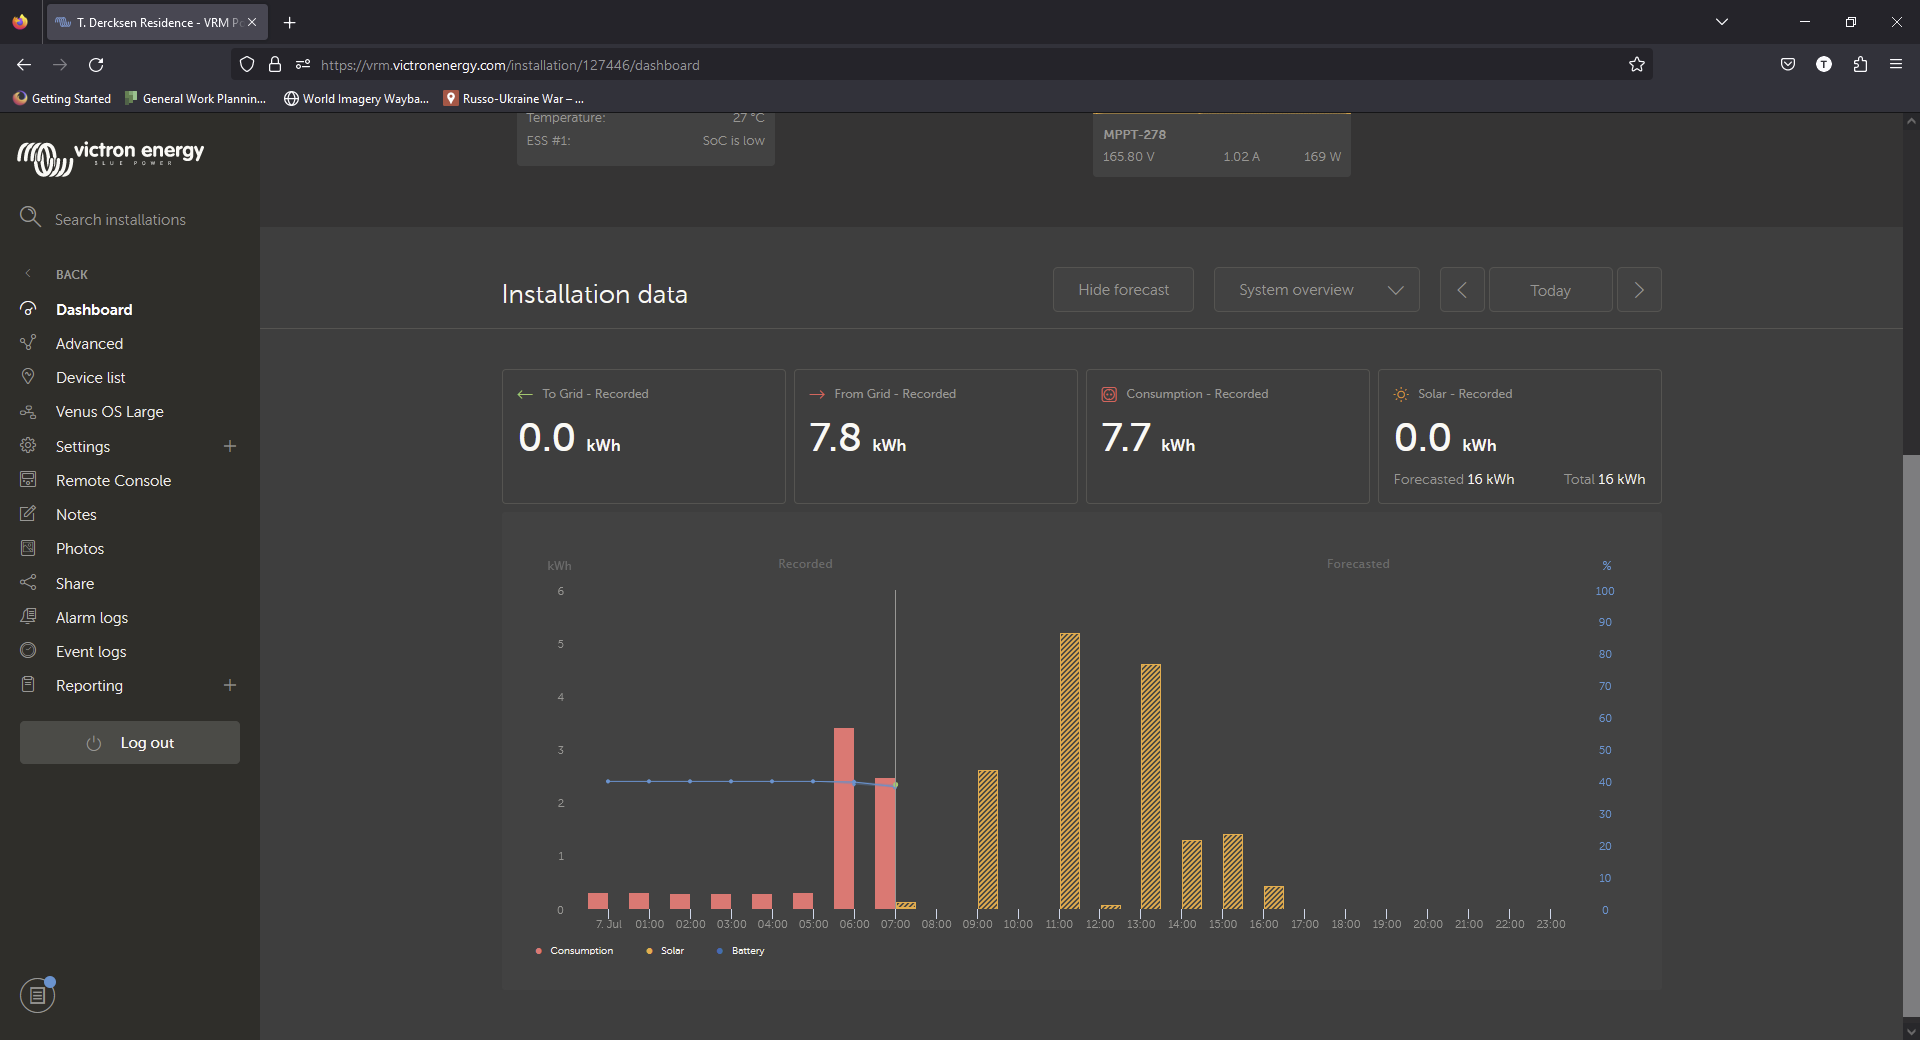
New VRM feature - solar forecast

Hi Victron Community,

We've just launched a new solar forecast feature for VRM.
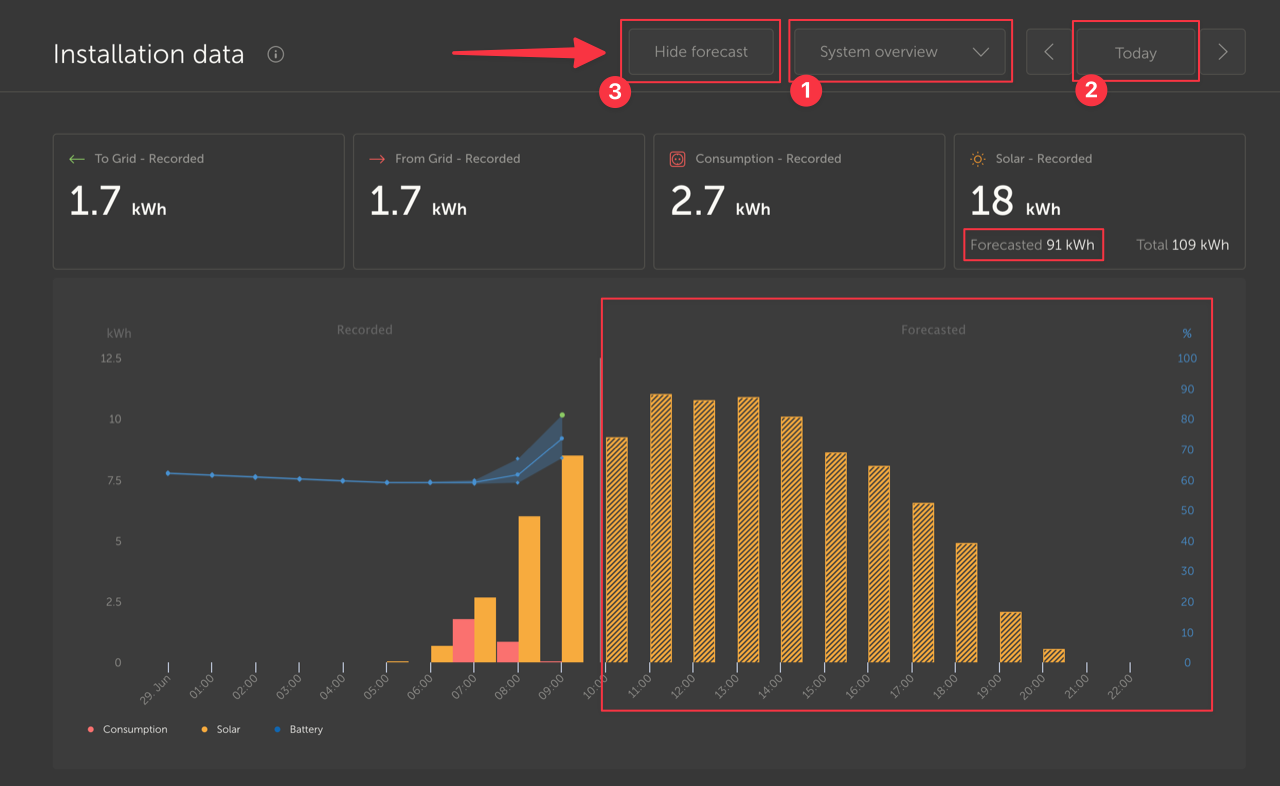

solar-estimate.png


To use this, make sure you fulfil all the requirements:

  • Your installation has a location set
  • Your site is recording hourly solar yield
  • You are on the ‘today’ view

The major changes include:

  • Calculate the forecast based on forecasted solar irradiance
  • Change layout of the installation data graphs to have more space for the forecast
  • Show the recorded, forecasted and expected total production for today
  • Include the forecast per hour until 24:00 in the system overview graph
  • Add a ‘solar irradiance’ widget on the advanced page


All the information you should need is here at the Victron Blog article about it.


We'd love to hear any feedback. Encouragement for the team, issues with the user interface, either suggestions for improvement or bugs. We are still improving the estimation algorithm, so are interested in reports of any unusual or impossible estimates.


We hope you enjoy this new feature :)

VRM
solar-estimate.png (207.7 KiB)
7 comments
2 |3000

Up to 8 attachments (including images) can be used with a maximum of 190.8 MiB each and 286.6 MiB total.

nachtsonne72 avatar image nachtsonne72 commented ·
Der All,

great feature for cost optimization, tx. Could you please extend the Modbus TCP.xls with "forecasted" accordingly? The Arduino micro controller community might appreciate that a lot.

Regards,

G

1 Like 1 ·
regman54 avatar image regman54 commented ·
Okay, I have to ask. It looks like an interesting project but I'm wondering what benefit it will bring me knowing the solar forecast? Is this just different twist on a common weather forecast that says it's going to cloudy, partly cloudy, or sunny today? Armed with that solar forecast knowledge what am I supposed to do with it? Not trying to be cheeky but what am I not understanding? Must be something. Thank you.
0 Likes 0 ·
Peter avatar image Peter regman54 commented ·
You can charge battery with cheap power (eg. during the night) to such level than you have place for power from PV during the day. This is what my program does.
0 Likes 0 ·
Craig Chamberlain avatar image Craig Chamberlain regman54 commented ·
I find it useful to know how much generation I’m likely to get in the next 24-48 hours so that I can choose to export more or less of my battery power to the grid. But if it’s going to be a bad day for generation tomorrow then I’m more inclined to keep my batteries at a higher state of charge to ensure I don’t need to import grid energy.

Another way to think of it is as follows, for my Octopus Go Faster tariff:

Peak rate grid import is ~40p/kWh

Off-peak grid import is ~8p/kWh

Export is ~4p/kWh

So if I export too much at 4p, and then have to import again the next day at either 8p or worse still 40p, then I will lose either 4p or 36p per kWh. But on the other hand, if I don’t export the power and the next day is really sunny then my batteries end up full by 10am and I don’t get the full benefit of my PV generation.

HTH

0 Likes 0 ·
regman54 avatar image regman54 regman54 commented ·
Ah, Okay. Now I see where you're coming from. I'm new to all this so thanks for the clarification. Cheers.
0 Likes 0 ·
daniel-feist avatar image daniel-feist commented ·
Love the PV forecast. Are these values available via RS485 registers?


A few questions/ideas:

- Will you be supporting the battery level forecast for ESS and not just DESS?
- Will the "grid" installation summary be enhanced to include export and not just import? (I see the beta has the totals, but nothing on the graph yet)
- The summary graphs for grid/consumption/solar are fantastic, but something battery centric seems to be missing and would be really useful.

0 Likes 0 ·
graham-willsher avatar image graham-willsher commented ·

Hi @Guy Stewart (Victron Community Manager),

Firstly, congratulations on a fantastic product, and the taking of a big step to try and get forecasting working.

Please excuse the simple question.

I have currently got my Victron Multiplus to be set up using node red to force discharge my batteries at a specified time - everything is working well. I also have manged to set the charging schedule within Victron to charge my batteries within the cheap electricity window that Octopus offer.

I have looked at the DESS but the current version did not seem to give the results that I expected so I have turned it off for the moment, I know that forecasting energy usage and the weather is a nightmare to get right especially with your market being worldwide and the different regulations that you must try and please.

I now want to try and modify my schedule charging window to reflect the forecast solar for the next day so that I use my batteries more efficiently.

So to my question.

I have used node red (using the VRM API) to get the forecast invertor yields to see what the coming forecast is, but I can't find a node red function that will get me the installation historical data for my site. Is there such a thing or is it something that I have to write my own functions to carry out the necessary HTTP calls? I have spent the day trying to find such a thing but to no avail.

If you could point me in the right direction that would be much appreiciated.

Thanks,

Graham.

0 Likes 0 ·
87 Answers
jonathan-drewes avatar image
jonathan-drewes answered ·

When I click on the Show Forecast button, nothing happens and the button disappears.


Location is set but the temp data is wrong.


1688562252244.png


1688562252244.png (40.2 KiB)
6 comments
2 |3000

Up to 8 attachments (including images) can be used with a maximum of 190.8 MiB each and 286.6 MiB total.

mvader (Victron Energy) avatar image mvader (Victron Energy) ♦♦ commented ·
thank you for the report, its being checked.
0 Likes 0 ·
jonathan-drewes avatar image jonathan-drewes mvader (Victron Energy) ♦♦ commented ·
Maybe this has something to do with the weather data (temp) being incorrect.
0 Likes 0 ·
mvader (Victron Energy) avatar image mvader (Victron Energy) ♦♦ jonathan-drewes commented ·
Hi when did you set up the location in VRM?
0 Likes 0 ·
jonathan-drewes avatar image jonathan-drewes mvader (Victron Energy) ♦♦ commented ·
Just right before trying the new feature, today, a few hours ago.
0 Likes 0 ·
nickdb avatar image nickdb ♦♦ jonathan-drewes commented ·
It needs at least a few hours of data to start forecasting, sometimes longer.
1 Like 1 ·
sebastian-walther avatar image sebastian-walther commented ·
Just noticed a similar behavior. Between midnight and 1am, the "show forecast" button disappears when clicked and there is no forecast available.
0 Likes 0 ·
Peter avatar image
Peter answered ·

2 days chart in VRM Android application looks badly... I don't see consumption when solar is bigger...

screenshot-20230705-163633-vrm.jpg


3 comments
2 |3000

Up to 8 attachments (including images) can be used with a maximum of 190.8 MiB each and 286.6 MiB total.

Hi @GbbVictronWeb,

I can reproduce something similar on my iPhone app too, so definitely can be improved. I'll ask the VRM team to have a look.

2 Likes 2 ·
Jakub Ruják avatar image Jakub Ruják Guy Stewart (Victron Community Manager) ♦♦ commented ·
Suhlasim graf nech ostane povodny vyzeral lepsie
0 Likes 0 ·
uguraladag avatar image uguraladag commented ·

I want to see this graph in Vrm application too. What should I do?

0 Likes 0 ·
Jason - UK avatar image
Jason - UK answered ·

Mine is working fine by the looks of it but only checked on my PC. Thanks for the new feature, really helpful as I had been using Node Red and my own calculation to forecast generation with no luck.

@Guy Is there a way to get an API for this? The reason why I ask is, I would like to predict generation vs off peak charge and therefore only charge the minimum required based on the predicted day time generation. My off peak charge period is 0200 - 0500h.


1688567402790.png


1688567402790.png (88.3 KiB)
2 comments
2 |3000

Up to 8 attachments (including images) can be used with a maximum of 190.8 MiB each and 286.6 MiB total.

mvader (Victron Energy) avatar image mvader (Victron Energy) ♦♦ commented ·
Hi, yes, pls see the blog post, linked above, for details such as API; plus tips for how to do it in Node-RED
1 Like 1 ·
Jason - UK avatar image Jason - UK mvader (Victron Energy) ♦♦ commented ·
Thank you!.
0 Likes 0 ·
kevgermany avatar image
kevgermany answered ·

Looks like it's good for me. I like it. Thanks.

There's a persistent warning about being in the past when I go backwards to yesterday/day before. Could drop that.

2 |3000

Up to 8 attachments (including images) can be used with a maximum of 190.8 MiB each and 286.6 MiB total.

vvv avatar image
vvv answered ·

Hi

This is another bug. Can you fix it?capture.png

Thanks


capture.png (166.0 KiB)
1 comment
2 |3000

Up to 8 attachments (including images) can be used with a maximum of 190.8 MiB each and 286.6 MiB total.

Thanks for reporting @VVV,

I'll ask the VRM team to look into getting this fixed.

0 Likes 0 ·
kevgermany avatar image
kevgermany answered ·

Suggestion. Many of us have a mobile location. With a GPS receiver connected to the system.

Current implementation seems to be useful for fixed location.

However after a few days in a fixed location the system can learn the generating power of the panels. Looks from the comments as if it's doing that.

If that's the case, it wouldn't be that hard to read the GPS location and base forecasts on that. Could be done at a variable frequency based of how quickly location changes.

2 comments
2 |3000

Up to 8 attachments (including images) can be used with a maximum of 190.8 MiB each and 286.6 MiB total.

mvader (Victron Energy) avatar image mvader (Victron Energy) ♦♦ commented ·
Hi Kevin, I’m 99% sure that it already works like that:


If you connect a GPS to your GX device, then the location in VRM will be updated automatically; and thats the location which is used for the irradiation forecast.


Best regards, Matthijs

0 Likes 0 ·
kevgermany avatar image kevgermany ♦♦ mvader (Victron Energy) ♦♦ commented ·
Brill, thanks. I'll be travelling next week, I'll watch.
0 Likes 0 ·
PeterM avatar image
PeterM answered ·

For those with a Radiation sensor integrated into the VRM can you please show its live data on the dashboard please !

2 comments
2 |3000

Up to 8 attachments (including images) can be used with a maximum of 190.8 MiB each and 286.6 MiB total.

Hi @PeterM​,

Do you mean like the IMT product?

I don't know of any plans for this right now, so not any time soon, but I'll make a note.

0 Likes 0 ·
PeterM avatar image PeterM Guy Stewart (Victron Community Manager) ♦♦ commented ·
YEs the IMT device , I mentioned this in a webinar previously and one you your team said its a great idea and would look into do it about a year ago.
0 Likes 0 ·
chultquist avatar image
chultquist answered ·

This looks like a neat feature and I’m especially looking forward to trying out the Node-RED integration (to possibly replace what I’m currently doing using Solcast’s rooftop PV API).


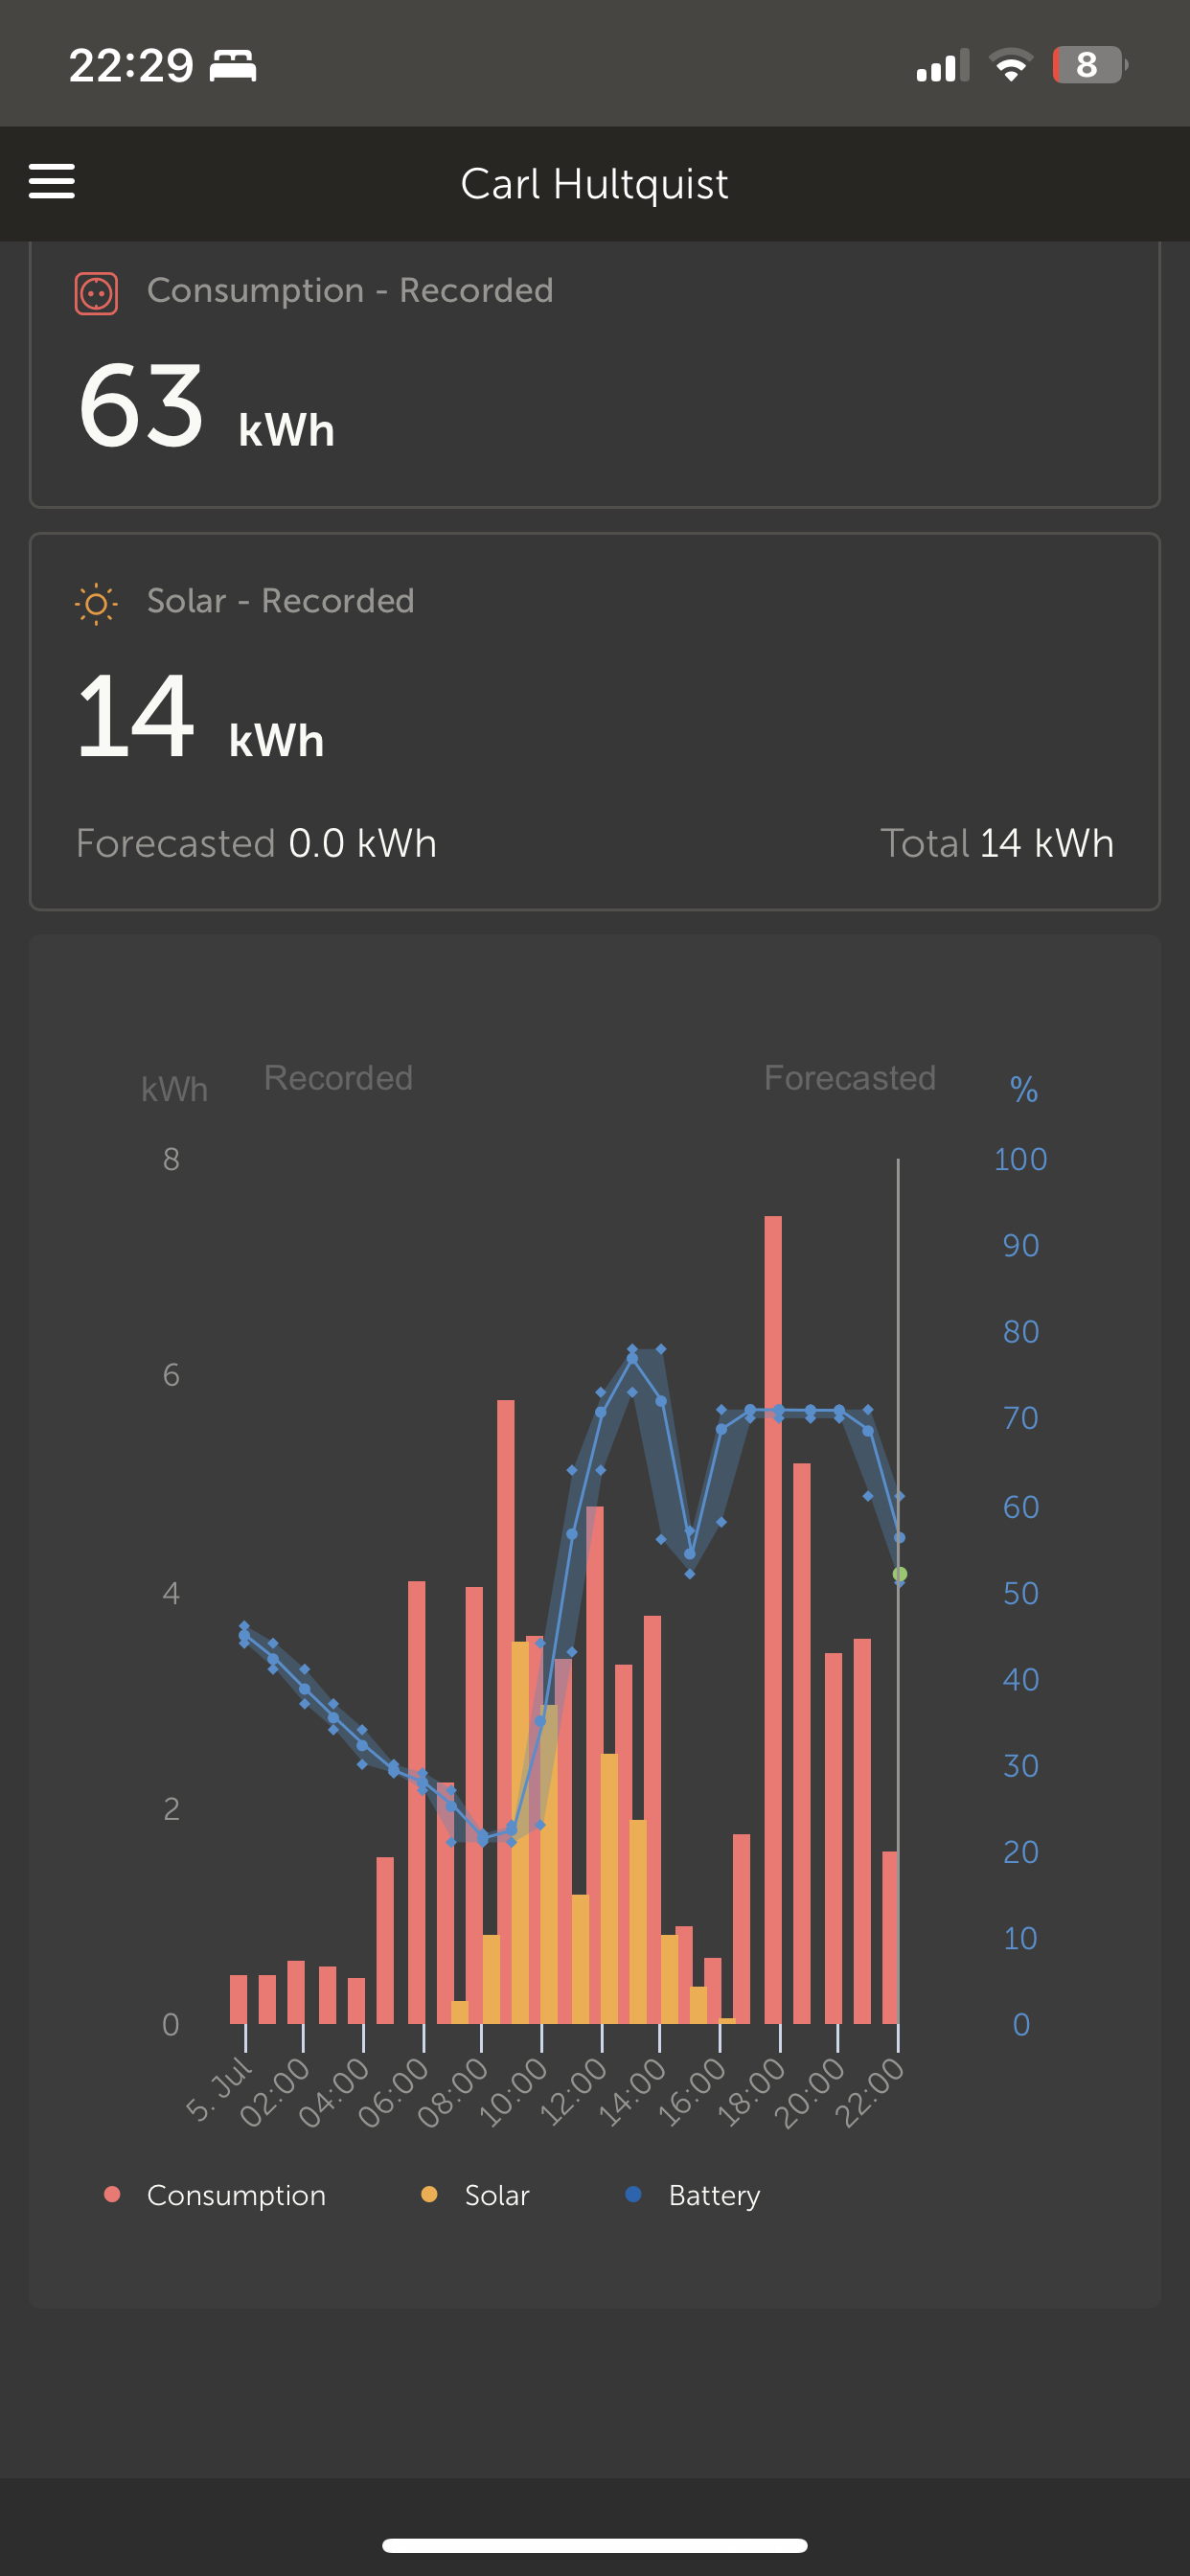
One thing I don’t like is that on iOS this has rearranged the layout to put the chart at the bottom of the page, underneath the summary statistics for the day. Could that be fixed to have the chart appear first with summary stats below it like it used to be (or made configurable to switch layout based on user preference)?


The chart also seems to be much larger in the vertical dimension than before which makes it look stretched. See screenshot below.


945e1426-5faf-4c8a-958b-cce9c26ee778.png


1 comment
2 |3000

Up to 8 attachments (including images) can be used with a maximum of 190.8 MiB each and 286.6 MiB total.

Hi @chultquist,

Good suggestions, looking at your screenshot there could be other efficiency improvements made to the layout as well.

I'll pass them on to the VRM design team, thanks.

2 Likes 2 ·
hominidae avatar image
hominidae answered ·

....this feature worked for me in VRM beta and I also tested yesterday during daytime in production VRM portal just fine.

Now, a few minutes into a new day, the "show forecast" button appears, but after clicking it, the button disappears and no forecast is shown.

1 comment
2 |3000

Up to 8 attachments (including images) can be used with a maximum of 190.8 MiB each and 286.6 MiB total.

Hi @Hominidae,

To look into it further can you please reply with your vrm url and I can ask the team to have a look.

0 Likes 0 ·
Peter avatar image
Peter answered ·

It is 1:30 and forecast is not to the end of day

screenshot-20230706-022811-vrm.jpg


4 comments
2 |3000

Up to 8 attachments (including images) can be used with a maximum of 190.8 MiB each and 286.6 MiB total.

Hi @GbbVictronWeb,

Thanks for the report, I've asked the VRM team to look into it

0 Likes 0 ·
Alex Imbrea (Victron Energy Staff) avatar image Alex Imbrea (Victron Energy Staff) ♦♦ Guy Stewart (Victron Community Manager) ♦♦ commented ·
The forecast should be there by now. There were some issues/delays with the generation which are now fixed.
0 Likes 0 ·
Peter avatar image Peter Alex Imbrea (Victron Energy Staff) ♦♦ commented ·

Confirm. Now is full.


At what o'clock should forecast for current day be available?

0 Likes 0 ·

I think by 1am it should be available for that day. But improvements are coming for that gap situation.

1 Like 1 ·
Peter avatar image
Peter answered ·

Please add forecast in 2-days view also.

1 comment
2 |3000

Up to 8 attachments (including images) can be used with a maximum of 190.8 MiB each and 286.6 MiB total.

We plan to add farther looking forecasting in a future update
-1 Like -1 ·
Graydon avatar image
Graydon answered ·

Saw it on mine today, looks and works great! thank-you for this useful feature

2 |3000

Up to 8 attachments (including images) can be used with a maximum of 190.8 MiB each and 286.6 MiB total.

Duivert NL avatar image
Duivert NL answered ·

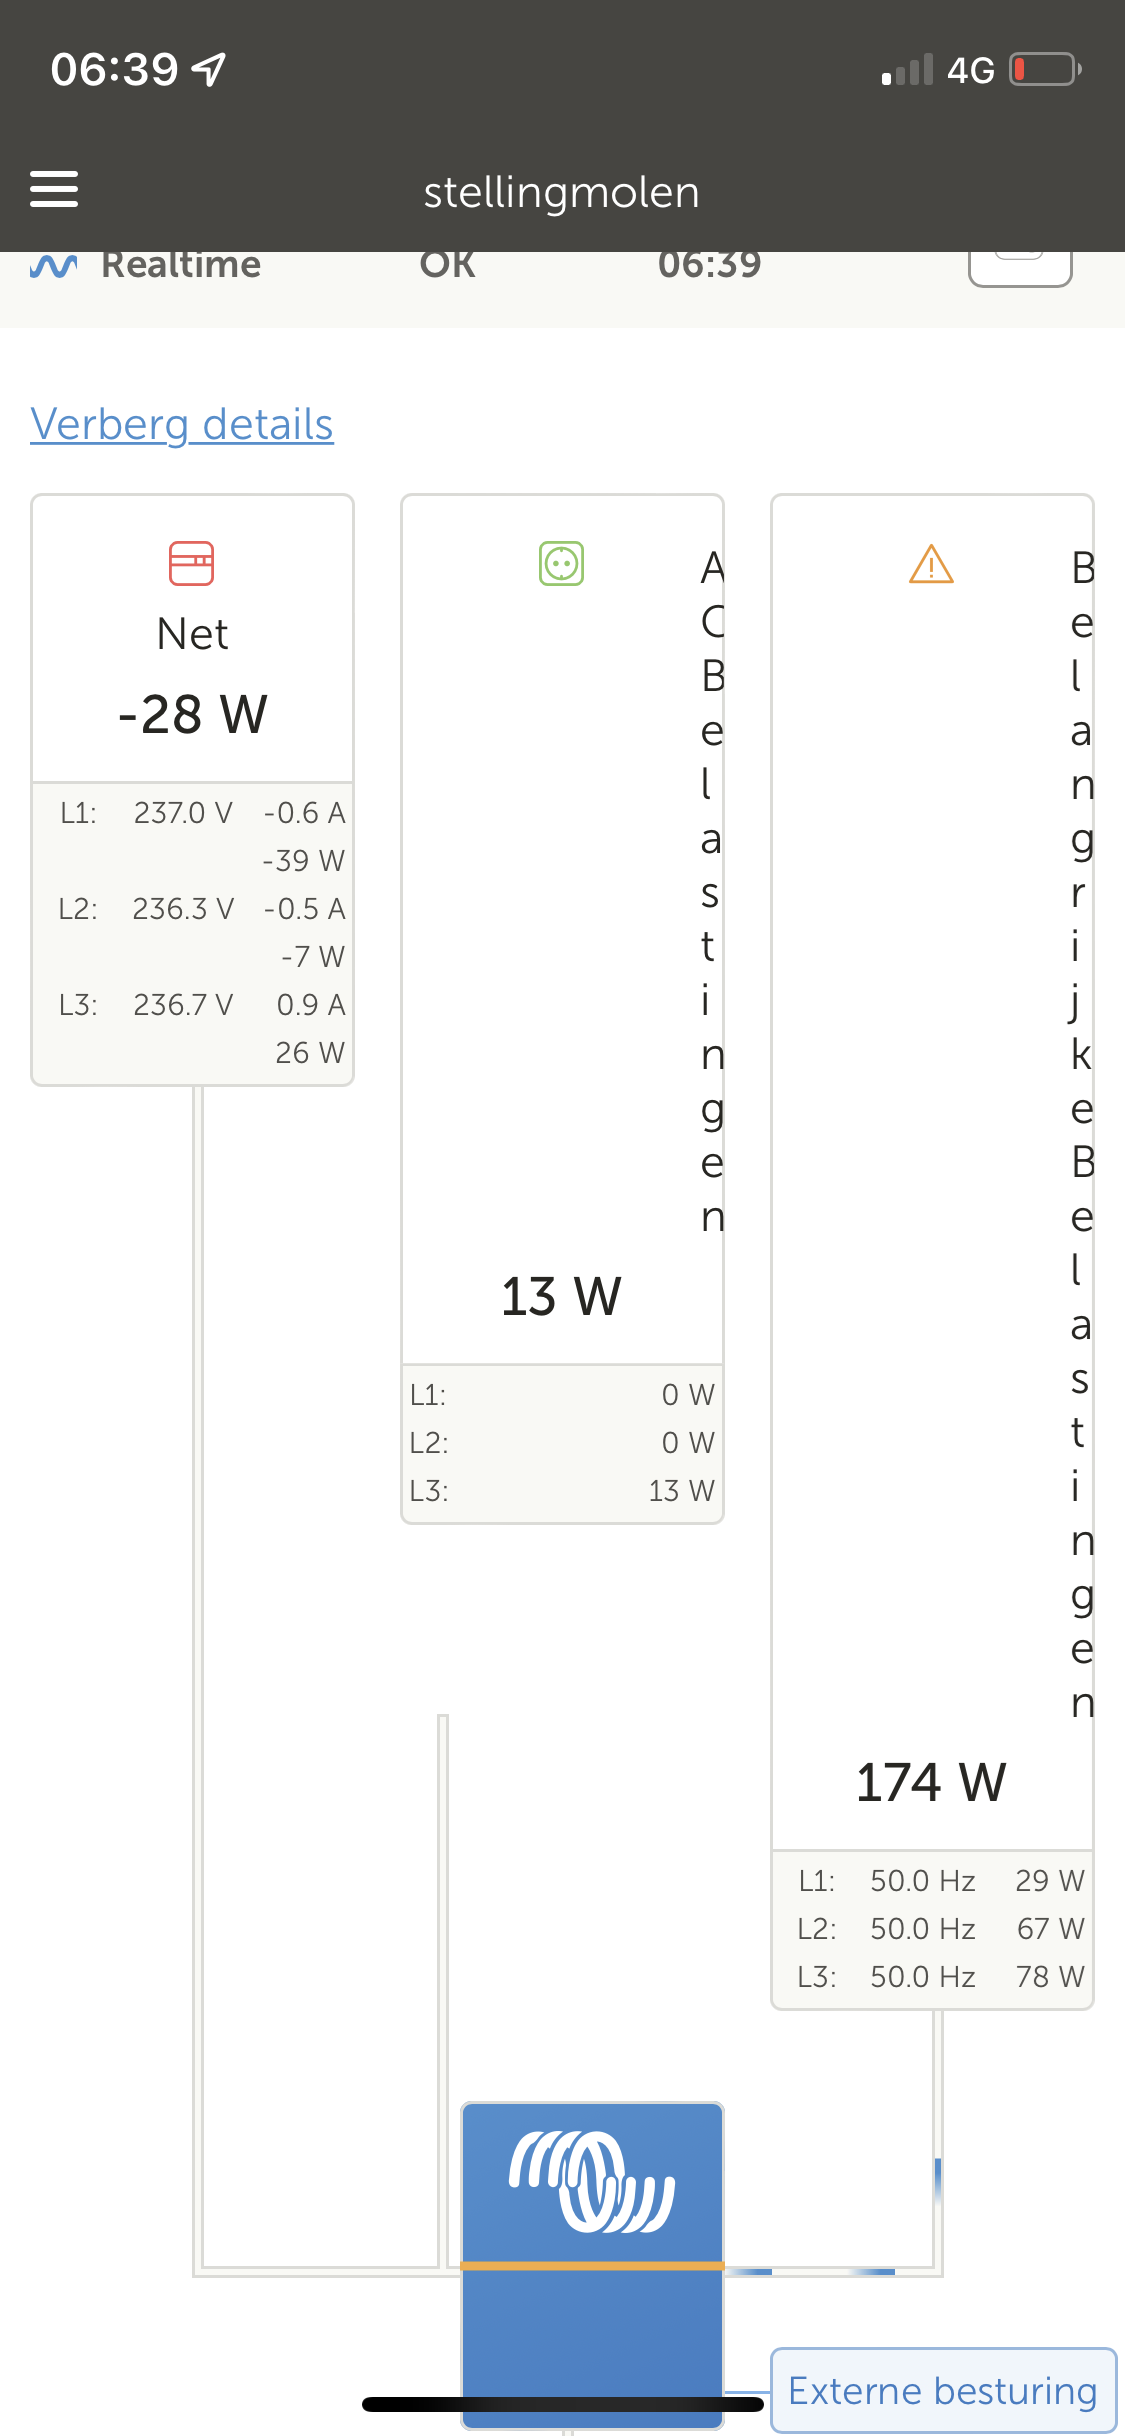
Needs some work… everything is stretched out in vrm app, this is on my iphone x ios 15.4.1


dc25f4d8-e958-44e3-871b-fc5dce4b10a9.png


3 comments
2 |3000

Up to 8 attachments (including images) can be used with a maximum of 190.8 MiB each and 286.6 MiB total.

Hi @duivert,

Thanks for reporting, I'll pass it on to the VRM app team.

1 Like 1 ·

Hi @duivert,

The team is not able to reproduce this issue setting the test iPhone X to Dutch for your site?

Is there a chance you have changed some other setting like accessibility font size?

img-7119.png

0 Likes 0 ·
img-7119.png (653.6 KiB)
Duivert NL avatar image Duivert NL Guy Stewart (Victron Community Manager) ♦♦ commented ·
Hi @Guy Stewart (Victron Community Manager)


Nope i use standard font size, no accesabilty at all

Latest vrm app version, ios 15.4.1


Deleted and downloaded the app again, no change…

Small text like Net (grid) work fine, long text gets stretched down


Rest of the app works fine


0 Likes 0 ·
ttt avatar image
ttt answered ·

THANK YOU!!!!!!
I see the forecast for today for each of my PV-Installations. I do/did this manually day by day so far based on a weather APP which also forecasts clouds and UVI to manage my loads because of limitated battery Capacity(just 20kWh). I hope that your new function saves a lot of time for me and increases the ACCURACY of my load management.

(from the actual point of view the forecast is to high (+50%) for today) I will watch it very detailed the next few days
Regards, Toni

2 |3000

Up to 8 attachments (including images) can be used with a maximum of 190.8 MiB each and 286.6 MiB total.

Graham Owens avatar image
Graham Owens answered ·

I think the forecast feature is great, but the graph looks aweful due to it being so squashed. Why is there so much empty space? See image below.screenshot-20230706-055909-chrome2.jpg


1 comment
2 |3000

Up to 8 attachments (including images) can be used with a maximum of 190.8 MiB each and 286.6 MiB total.

Thanks for the feedback @Graham Owens, I've added it to the ticket with several other similar requests going back to the design team.
0 Likes 0 ·
PeterM avatar image
PeterM answered ·

Great feature - - bug - you cannot move cursor onto the 16:00 timeslot in this instance but you can on all the other vertical bars including the 17:00 one !1688623862874.png


1688623862874.png (18.1 KiB)
3 comments
2 |3000

Up to 8 attachments (including images) can be used with a maximum of 190.8 MiB each and 286.6 MiB total.

chultquist avatar image chultquist commented ·

I saw a similar bug in the VRM web portal on my desktop - the hover works for me on all time slots except for the 9-10am one (it's currently 8:47am, so 8-9am hover is fine). See attached GIF. This is for installation ID 199346.

VRM hover not working on some time slots.gif

0 Likes 0 ·
Thanks both @PeterM and @chultquist - I can reproduce the issue and have reported it to the VRM team.
0 Likes 0 ·
Guy Stewart (Victron Community Manager) avatar image Guy Stewart (Victron Community Manager) ♦♦ Guy Stewart (Victron Community Manager) ♦♦ commented ·
The VRM team just reported they’d found the bug and fixed it.

Thanks both.

0 Likes 0 ·
ikeakayke avatar image
ikeakayke answered ·

Hi, wonderful and very useful feature, thank you!

I think it might be related to the new changes that the grid infobox keeps flip-flopping between normal and weird almost every 2-3 seconds in the vrm app on my android phone.it also does it in chrome dev tools if set to mobile @Alex Imbrea (Victron Energy Staff)

Screenshot_20230706_092317_VRM.jpg


5 comments
2 |3000

Up to 8 attachments (including images) can be used with a maximum of 190.8 MiB each and 286.6 MiB total.

Hi @ikeakayke,

I can't see anything weird in your screen shot - it looks normal to me.

The boxes can move when they re-draw if there is more data (and extra digit) that pushes the text to a new line. Do you think that is what is happening?

If so, I agree that could be better handled, maybe some delay before re-drawing the box.

0 Likes 0 ·
ikeakayke avatar image ikeakayke Guy Stewart (Victron Community Manager) ♦♦ commented ·
Hi, it switches between 6 lines of text to 5 lines of text(like in the ss) without any visible extra digits. Instead it adds a space between Lx: and voltage. Or should I say it removes a space from L1 between L1: and voltage. It keeps dancing like that 6-5-6 almost every second. It should either keep 2 lines/phase or better yet maybe get rid of amps so it looks clean like the critical and AC loads. Those amps make no sense to me anyway... it never even got close that amps x voltage = voltage x pf and were never confirmed with a clamp ampermeter. The wattage is always spot on, but those amps not sure what they're supposed to mean.
0 Likes 0 ·
larsea-dk avatar image larsea-dk ikeakayke commented ·

img-8396.jpegimg-8395.jpeg

I also have the text jumping for the grid, maybe due to re-drawing. This happens for me only on grid and for PV. Could the boxes be larger or have some more lines intended, so if higher numbers (longer text) are shown, it do not “jump around”. It has been so for a long time, but could be great to get solved for a more nice view/dashboard. Also often the PV “V” is beneath the value. Could be solved by only having one decimal instead of two.

0 Likes 0 ·
img-8396.jpeg (232.9 KiB)
img-8395.jpeg (122.0 KiB)
ikeakayke avatar image ikeakayke Guy Stewart (Victron Community Manager) ♦♦ commented ·

Hi, @mvader (Victron Energy) can we please fix this? It is rather embarrasing.. I don't use VRM much but when I want to show to someone or maybe away from home, I can't really read anything on my phone as it keeps scrolling up and down. It is causes by grid showing 1 line/phase instead of 2 randomly. I suspected some decimal, but I don't see it. Thanks!


0 Likes 0 ·
ikeakayke avatar image ikeakayke ikeakayke commented ·

in case autoplay not working

https://youtube.com/shorts/y4Z-34Vfdms

0 Likes 0 ·
markess avatar image
markess answered ·

Great you've added solar forecasting, thanks. You mention 'Dynamic ESS' in the blog. It would be good to add a "From Battery" in the Grid section of VRM, for those that now export battery power to grid.

3 comments
2 |3000

Up to 8 attachments (including images) can be used with a maximum of 190.8 MiB each and 286.6 MiB total.

Good suggestion @MarkEss, not sure how that was missed. We'll add it.
1 Like 1 ·
markess avatar image markess Guy Stewart (Victron Community Manager) ♦♦ commented ·
Thanks @Guy Stewart (Victron Community Manager) , any idea when we might see this added?
0 Likes 0 ·
Guy Stewart (Victron Community Manager) avatar image Guy Stewart (Victron Community Manager) ♦♦ markess commented ·
Not until after the official release of Dynamic ESS.
1 Like 1 ·
dolby avatar image
dolby answered ·

Hi - awesome feature .

Is this as simple as using the weather forecast (ie sun or rain) - or what is the algorytm behind this ? What does it take into account ? For example I have a tiny system compared to the most of you (4 x 375w panels) and the last few days I'm getting between 6.5-7kWh generated based on the use

The forecast is 5.9kWh - why does it assume lower?

2 comments
2 |3000

Up to 8 attachments (including images) can be used with a maximum of 190.8 MiB each and 286.6 MiB total.

dolby avatar image dolby commented ·
Actual was 6.9 in the end
0 Likes 0 ·
nickdb avatar image nickdb ♦♦ dolby commented ·
It should adjust as the day progresses.

The irradiance widget will show forecast vs actual irradiance, best place to look for accuracy. This is used to power the model that is generated over time for your specific setup.

0 Likes 0 ·
kositch avatar image
kositch answered ·

Thanks, looks very promising, but I think, there is one issue there (or mayby expected behaviour?)

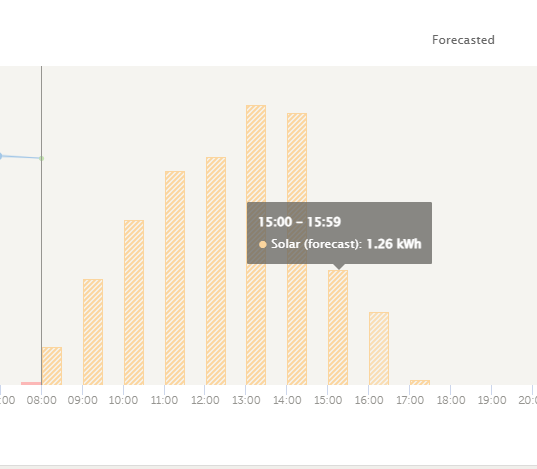
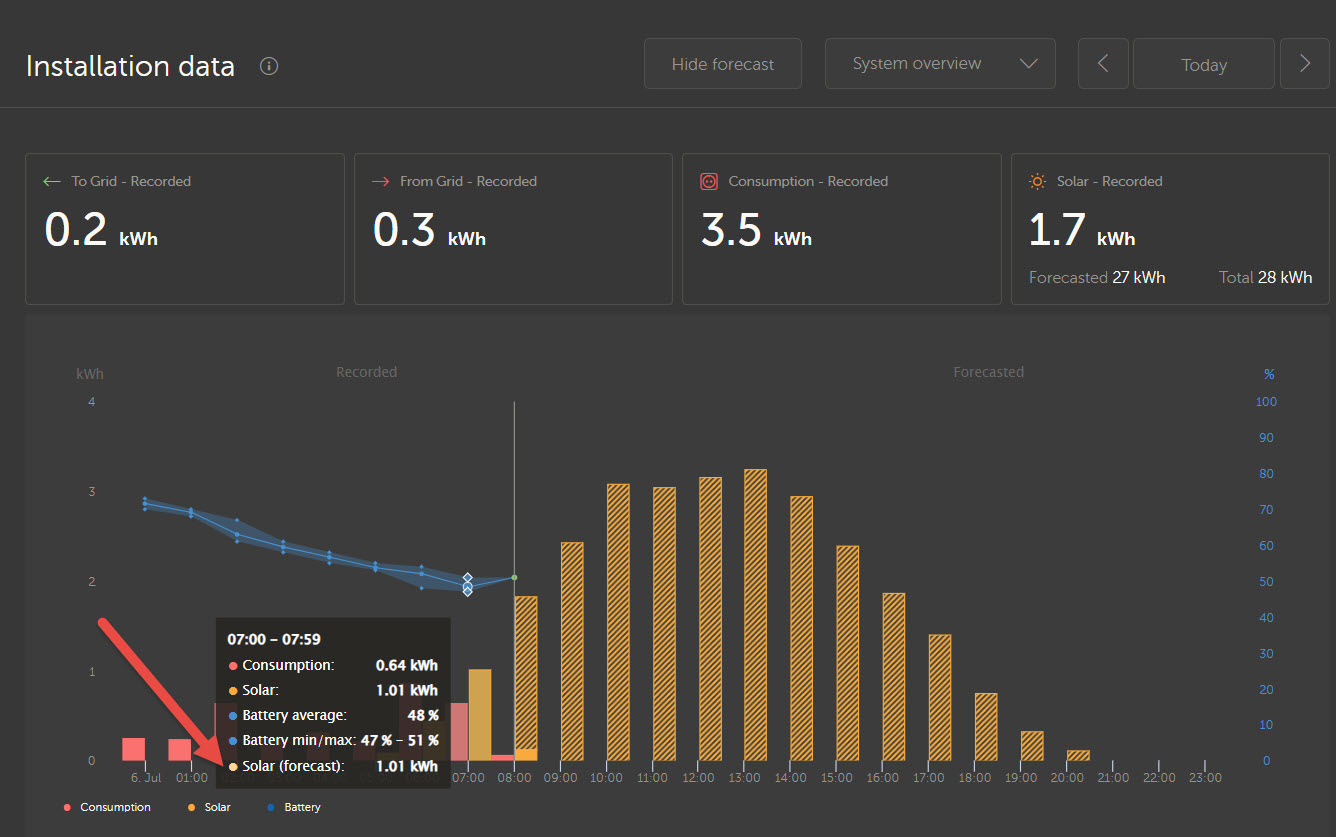
When some Solar value is forecasted it changes to the Recorded value after the hour is finished - I would like to see the original forcased value and inside of it the real Recorded value, so I can compare Recorded value in that hour vs. Forecasted value (to evaluate, how precise the forecast was) if you understand me.


Now when the hour is finnished the Forecasted value matches Recorded - see screenshot - in between 7:00-7:59 it forecasted 1.46 kWh, Recorded was 1.01 and after the hour finished, the Forecasted value changed to Recorded, which quite dont make a sense to me.

Thanks if that will be fixed!2023-07-06-08-05-41.jpg


4 comments
2 |3000

Up to 8 attachments (including images) can be used with a maximum of 190.8 MiB each and 286.6 MiB total.

hominidae avatar image hominidae commented ·
  • +1 for having a comparison of real, recorded solar vs. forecasted values for each hour.
  • But to me, this screen shows another issue/bug, as the forecast value stays in the mouseover list only for the single hour that has just passed (now -1h). For hours further down the line, only the recorded solar value is listed.

    So have it either way: only display recorded values for hours passed or add/display info for historic forecasted values, for all hours shown (passed, present and future).
2 Likes 2 ·

Hi @Kositch

You aren't the first person to want the forecasted value to remain for the whole day, rather than count down as the remainder, and convert to the recorded figure.

Adding more info for analysis so that you can compare the estimate with the real-world would be useful to detect system underperformance for example. That is more likely to go in the advanced widget tools I think.

But to set expectations, for now at least the VRM team is focused on feeding this forecast data as is into dynamic ESS, adding per tracker forecasting, and extending the forecast further into the future.

I'll pass on the other 'carry-over' bug you see with the previous hour 'estimate' copying the 'actual', agreed that doesn't look right.

2 Likes 2 ·
patricknl avatar image patricknl commented ·

I'd liek that too, also in the general field. How much de difference is between the forecast and the recorded production over the entire day.

Overall, I'm happy with it! Yesterday there was around .5kWh difference in the forecast and the actual production.


1 Like 1 ·
bigbadbob76 avatar image bigbadbob76 patricknl commented ·
If you look at the solar irradiance graph in advanced tab you can see historic recorded vs forecasted values. :-)
0 Likes 0 ·
rainero avatar image
rainero answered ·

Great new feature, thanks for implementing! Looking forward to that "dynamic ESS" features, too. Will get pretty interesting with varying energy prices and optimized EV-charging soon! API/MQTT access for connecting with e.g. OpenHAB for controlling further devices at home would be perfect.

Regards, Rainer

2 |3000

Up to 8 attachments (including images) can be used with a maximum of 190.8 MiB each and 286.6 MiB total.

hominidae avatar image
hominidae answered ·

...not so sure about the accuracy of the forecast.

This is my site, with VRM forecast compared to my own, solcast-rooftop account (fully tuned some months ago, with recorded measurements by solcast).

capture-vrm-forecast-vs-solcast-rooftop.png

The values in the diagram on the left:

  • Solcast Forecast - is based on the integral of solcast forecast solar power values (interval PT30M)
  • Solcast Forecast (yield): forecast energy up until now() (integral of forecasted values until now).
  • PV Daily yield: PV Energy recorded by my inverter
  • Measurements yield: Integral of PV Power values from my inverter, recorded up until now

The recorded solar values match (of course) but my own solcast based forecast says 107.66kWh, compared to only 100kWh in VRM.

My forecasts are collected/updated up to 40 times between hours of sunrise and sunset, at least once every hour and I have found these to be very, very accurate during the last 1.5years.


2 comments
2 |3000

Up to 8 attachments (including images) can be used with a maximum of 190.8 MiB each and 286.6 MiB total.

chultquist avatar image chultquist commented ·

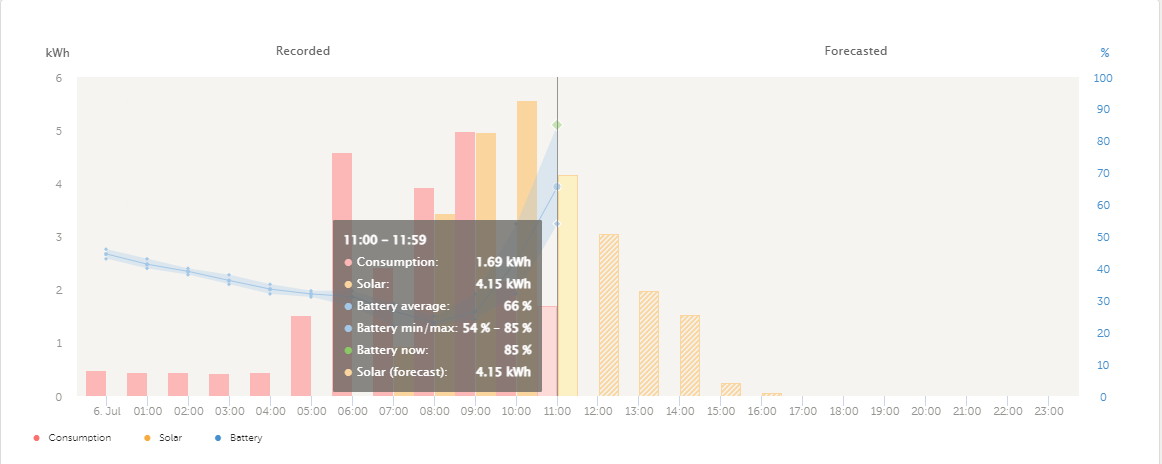
I'm seeing a similar issue where the VRM forecast seems much too low. For e.g. between 11am-12pm, around ~2.5kW was forecast just before 11am (I can't remember the exact number unfortunately) - it's now 11:40am and PV for this hour is already at 4.15kW. There are still 20 minutes to go and VRM is forecasting no more production in the next 20 minutes (forecast for the hour == PV produced so far).


If the accuracy could be improved this would be a really cool feature (especially when used in Node-RED).


1688636613763.png

0 Likes 0 ·
1688636613763.png (43.6 KiB)
nickdb avatar image nickdb ♦♦ chultquist commented ·
The system uses machine leaning, so it will improve with some time. It tends to have corrected its forecast by mid to late morning.

Mine has been running for some time and it is quite accurate but on iffy days initially can be a little bit (10%) off first thing in the morning.

0 Likes 0 ·
cacer avatar image
cacer answered ·

great working, but:

sorting the widgets in advanced is confusing me now.

the widgets are jumping around wild, when i want to sort them :D

not able to get them where i want.

what is the logic behind this behavior?


3 comments
2 |3000

Up to 8 attachments (including images) can be used with a maximum of 190.8 MiB each and 286.6 MiB total.

Hi @cacer,

This issue should now be resolved.

1 Like 1 ·
nickdb avatar image nickdb ♦♦ commented ·
Known issue unrelated to solar forecasting. It is being looked at.
0 Likes 0 ·
cacer avatar image cacer nickdb ♦♦ commented ·
ok, sorry.


i did not try to arrange the widgets the last weeks. just today with the new solar irradiance widget.
0 Likes 0 ·
cacer avatar image
cacer answered ·

an other small glitch in german language:

"systemübersicht" as a long word will not fit, when tab "solar" or "netz" is chosen,

so there is a srollbar.

perhaps just make the tab a little bit wider will prevent this.

screenshot-2023-07-06-123821.jpg


1 comment
2 |3000

Up to 8 attachments (including images) can be used with a maximum of 190.8 MiB each and 286.6 MiB total.

cacer avatar image cacer commented ·
thanks, booth glitches are gone now :D
1 Like 1 ·
menneer avatar image
menneer answered ·

My Panels were installed before my Quattro so are entirely separate. Can I input the parameters of my installation somewhere to get the forecast? (I understand that I won't get all the benefits.)

6 comments
2 |3000

Up to 8 attachments (including images) can be used with a maximum of 190.8 MiB each and 286.6 MiB total.

nickdb avatar image nickdb ♦♦ commented ·
You just have to configure your location in VRM.

If the chargers are supported, it will automatically show forecasts based on previous system performance.

You don't enter any information about your installation, it isn't required.

0 Likes 0 ·
menneer avatar image menneer nickdb ♦♦ commented ·

Thanks.


My location is correct in VRM, however when I click on "Show Forecast" the button disappears.


But surely the system needs to know the size of my panel installation to know how much it will generate? And how do I get it recording hourly solar yield?

0 Likes 0 ·
nickdb avatar image nickdb ♦♦ menneer commented ·

If you recently added a location it can take a while before the forecast appears as it needs a sample of data it can use.

VRM already knows how much power your chargers can generate and it can correlate this (amongst many other factors) to irradiance and work out what you should be able to produce. There is a clever model that it uses to do this.

So no, it doesn't need to know anything about your panel setup.

RS systems are also not supported yet, so if you have those you won't get a forecast.

0 Likes 0 ·
menneer avatar image menneer commented ·

My location has been in there since installation (5 years) but there is no forecast. Where can I check what is in the system?

0 Likes 0 ·
nickdb avatar image nickdb ♦♦ menneer commented ·
Look at the device list in VRM.

Is your system up to date with GX software etc?

The forecast should just appear automatically since your location was already set.

Can you add the irradiance widget under advanced widgets for the gx/cerbo/gateway and does it display anything?

0 Likes 0 ·

Hi @menneer

The forecast requires that the system's solar yield be recorded in VRM some how. Most commonly via a Victron MPPT.

There is no possibility for customisation of the solar array, it's purely based on the solar yield the VRM system can see.

Depending on how your system was configured, this might be possible if you had an existing AC PV inverter to install an energy meter and program that as 'AC PV inverter', which will then report that solar data to VRM.

0 Likes 0 ·
andy156 avatar image
andy156 answered ·

I'm not sure what happened to the boxes showing the 'to grid', 'from grid' etc in the summary for the period. The font with the name has gone extremely small and light. I have good eyes and struggle. It's not the best from an accessibility stand point. Now when you look at the screen you are presented with a sea of large bold numbers and it is not easy to read at a glance what they are all. It was much much clearer before. Also the boxes are now all aligned vertically taking up the whole width of the screen on a phone. There is a lot of scrolling to get to the graph. Before I am sure there was more than one at a time horizontally.

screenshot-2023-07-06-at-154145.png

I don't want to talk down the work on the forecasts but it won't work where we live. Basing it on historical events is meaningless, machine learning or not. It's a bit like the Tesla battery basing its decision making on the the last 3 days weather. If that was indeed what happened we would not need weather forecasts. I am using the solcast weather forecast api to do all my calculations. Maybe individuals could input their own unique key and then that data is used. It does tend to be a bit optimistic but it is certainly more accurate than using historical data.


3 comments
2 |3000

Up to 8 attachments (including images) can be used with a maximum of 190.8 MiB each and 286.6 MiB total.

Thanks for the feedback on the updated box design and layout @Andy156 - I have added it to the growing list about the same from other people for the designer ;)
1 Like 1 ·
nickdb avatar image nickdb ♦♦ commented ·

I think you are misunderstanding how it works. The forecast is based on live irradiance data which is constantly updated and checked.

The historical/machine learning part is to understand how your mppt's perform so an accurate number can be calculated.

It is more complicated than that but, it is modelling what your generation capacity is.

0 Likes 0 ·
andy156 avatar image andy156 nickdb ♦♦ commented ·

OI think you are right. My apologies. I read the sentence several times incorrectly. I misread the sentence as using historical solcast data. In which case it is infinitely better than the Tesla solution which made no sense to me.

0 Likes 0 ·
nuxland avatar image
nuxland answered ·

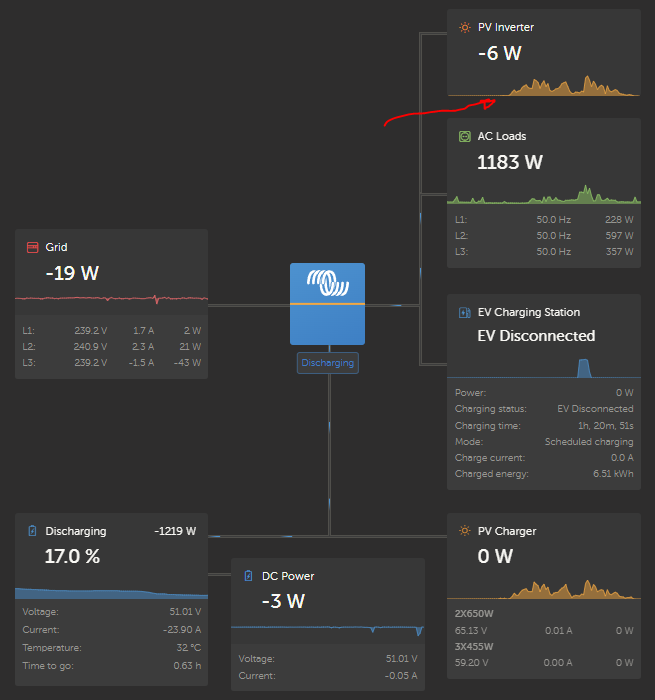
When I configured my Solar to output and enabled DC Power then I lost Per Phase data from Solar in VRM.

1688672192710.png


1688672192710.png (58.5 KiB)
3 comments
2 |3000

Up to 8 attachments (including images) can be used with a maximum of 190.8 MiB each and 286.6 MiB total.

Thanks for reporting @nuxland - indeed that sounds like a bug and I've reported to the VRM team.
0 Likes 0 ·
Alex Imbrea (Victron Energy Staff) avatar image Alex Imbrea (Victron Energy Staff) ♦♦ Guy Stewart (Victron Community Manager) ♦♦ commented ·
@nuxland this is now fixed. Information should show for all phases of the inverter for you again. Thank you for reporting!
0 Likes 0 ·
nuxland avatar image nuxland Alex Imbrea (Victron Energy Staff) ♦♦ commented ·
@Alex Imbrea (Victron Energy Staff)

Is there also possible to move "Solar" to the top of blue victron equipment, so it will then fit perfectly in iPhone screen. Right now "Solar" is the only one in top row and therefore some info is hidden below (I have to scroll to see everything).

I know that it is because I have too many stuff in OUTPUT :)

If I would remove "DC power" then "PV Charger" would be below blue victron and it would be better. But I have "DC power" because through it I can see what my DC generator is producing to system in VRM (I have it connected through SmartShunt directly to Victron Distributor).


0 Likes 0 ·
PeterM avatar image
PeterM answered ·

Solar Power is truncated and not rounded correctly . Power produced was 21.8 kWh and the Dashboard totals report 21 kWh. There is so much real estate in the power boxes - can you not provide an extra decimal resolution 1688673950819.png


1688673950819.png (6.3 KiB)
3 comments
2 |3000

Up to 8 attachments (including images) can be used with a maximum of 190.8 MiB each and 286.6 MiB total.

Hi @PeterM, I agree. I will lobby for it to be changed to at least 3 significant figures.

3 Likes 3 ·
multivictor avatar image multivictor Guy Stewart (Victron Community Manager) ♦♦ commented ·

Your lobbying was succesfull, three digits from today! Thx.

1 Like 1 ·
Guy Stewart (Victron Community Manager) avatar image Guy Stewart (Victron Community Manager) ♦♦ multivictor commented ·
Our lobbying :)
2 Likes 2 ·
daza avatar image
daza answered ·

Brilliant thank you @Guy Stewart (Victron Community Manager) I know why I invested in Victron! Keep up the good work

2 |3000

Up to 8 attachments (including images) can be used with a maximum of 190.8 MiB each and 286.6 MiB total.

kevgermany avatar image
kevgermany answered ·

Nit picking, but please change Forecasted to Forecast.

3 comments
2 |3000

Up to 8 attachments (including images) can be used with a maximum of 190.8 MiB each and 286.6 MiB total.

dansonamission avatar image dansonamission commented ·
Forecasted is the correct word. Look it up.
1 Like 1 ·
kevgermany avatar image kevgermany ♦♦ dansonamission commented ·
Nope. 'I forecasted' etc. I.e. part of a verb, not a noun. Here it's the title of a bar chart area. As in weather forecast or would you prefer weather forecasted?
0 Likes 0 ·
nickdb avatar image nickdb ♦♦ kevgermany ♦♦ commented ·

They can both be used in this case. It is more common for people to use forecast vs forecasted, so the latter may seem strange to some but is perfectly fine to use.

I would say the past participle of forecasted, reads better to me since it is describing the value not the overall chart, which would be a forecast.

Here endeth the lesson :)

0 Likes 0 ·
tdv avatar image
tdv answered ·

This is a great feature thanks. If somebody hasn't reported this yet - it seems my forecast is wrong every second hour. Was like that in the beta version too.


1688707860900.png


1688707860900.png (133.7 KiB)
2 comments
2 |3000

Up to 8 attachments (including images) can be used with a maximum of 190.8 MiB each and 286.6 MiB total.

Hi @tdv,

I haven't seen any other similar reports, but I'll ask the VRM team to have a look at your site and see if they can see what is going wrong there.

0 Likes 0 ·
tdv avatar image tdv Guy Stewart (Victron Community Manager) ♦♦ commented ·
Thanks!
0 Likes 0 ·
fellside avatar image
fellside answered ·

I have Solcast set up in Home Assistant. I find is pretty accurate predicting my generation. By the end of the day the new Solar Production Forecast is defiantly close enough to my HA Solcast in its forecast to allow predictions of charge required overnight or through the next day.

Now there are ready to use solutions for dynamic-ess (europe) and EskomSePush (SA) Would it be possible to provide users with a ready to use solution for overnight cheap rate (4hrs) charging using the prediction capabilities of the Solar Production Forecast flow. It would be a great addition.

Thanks great work

1 comment
2 |3000

Up to 8 attachments (including images) can be used with a maximum of 190.8 MiB each and 286.6 MiB total.

nickdb avatar image nickdb ♦♦ commented ·
There is a bigger vision and plan to leverage this feature. Just takes time and testing. First step is making sure the basics work well for most users.

With this data available via API you can already get creative with node red.


1 Like 1 ·
Mheisch avatar image
Mheisch answered ·

@Guy Stewart (Victron Community Manager) thanks a lot for this nice feature.
Will the Gerbo use this information also

-when it's the right time to start ESS #5: Slow charge

-calculating the "Active SOC limit"


Thank you

2 comments
2 |3000

Up to 8 attachments (including images) can be used with a maximum of 190.8 MiB each and 286.6 MiB total.

nickdb avatar image nickdb ♦♦ commented ·
It is not currently integrated into any other system features like ESS.
0 Likes 0 ·

Hi @mheisch

As Nick mentioned, for now it will not.

It's a very good idea though, and the future is very bright for making even more use of this kind of automatic analysis to improve system behaviour.

So far the general reaction to these features has been great so we are going to keep going. Lots more still to come.

0 Likes 0 ·
ako avatar image
ako answered ·

Doesn't work for me , i match al the criteria and map on Dashboard shown my position and says sunny with the temperature but that s all , press the " Show Forecast " and for a fraction of a second is shows "Hide Forecast " have to be quick or it can be missed as it disappears , nothing else , the " Show Forecast " comes back later but just constant loop .

2 comments
2 |3000

Up to 8 attachments (including images) can be used with a maximum of 190.8 MiB each and 286.6 MiB total.

nickdb avatar image nickdb ♦♦ commented ·
It can take some time to appear if the location was recently updated. Also doesn’t work on RS.
0 Likes 0 ·
ako avatar image ako nickdb ♦♦ commented ·
Dont know what RS is but whatever it is i cant have it because its started working now .
0 Likes 0 ·
multivictor avatar image
multivictor answered ·

Mine is working fine from day one (5/7/2023).

The graphs are ok on an Android tablet.

screenshot-20230708-101214-vrm2.jpg


screenshot-20230708-101234-vrm2.jpg

But, nitpicking :-) , I'm also waiting for an extra decimal resolution in the oversized boxes. :-)

screenshot-20230708-101658-vrm3.jpg


2 comments
2 |3000

Up to 8 attachments (including images) can be used with a maximum of 190.8 MiB each and 286.6 MiB total.

Hi @MultiVictor

It's already on the list ;)

0 Likes 0 ·
multivictor avatar image multivictor Guy Stewart (Victron Community Manager) ♦♦ commented ·
Top!
0 Likes 0 ·
JohnC avatar image
JohnC answered ·

I note it's now forecasting Consumption for me..

1688804331181.png

A little presumpuous of it to be telling me what loads I'm going to run, but I guess it won't hurt to see an average of past values.


1688804331181.png (21.6 KiB)
4 comments
2 |3000

Up to 8 attachments (including images) can be used with a maximum of 190.8 MiB each and 286.6 MiB total.

Peter avatar image Peter commented ·


I guess this is beta version of VRM...


0 Likes 0 ·
nickdb avatar image nickdb ♦♦ commented ·
Its a beta test. Not a committed feature yet. Accuracy will vary.
0 Likes 0 ·
andy156 avatar image andy156 nickdb ♦♦ commented ·
This will be a tricky one to do. As everyones use case is so different.


My home rolled solution has a baseline usage which includes a dish washer cycle and washing machine cycle at typical times + hot water tank heating. Heating is from a heat pump so I pull in the outside temperature data and calculate the power usage each 30 minutes.


Car charging/electricity diversion to hot water tank is based on a 2 day look ahead. Its a combination of automation and I have the displayed spare energy for the day in order to decide if I plug it in + predicted lowest battery state overnight in order to dump spare internal battery SOC into the car if the internal battery will be fully recharged during the next 2 days.

The car charging isn't even always at max rate so deciding if the current usage is based on the car use etc will be difficult without some way of pulling the data in. May be a node would allow one to inject other large load information into the system that you have downloaded and parsed.

It would be great if manufacturers had a common standard in order to share current power use/battery use etc. I have had to use all sorts of tricks to make the Victron work with my other equipment and it is testament to the engineering in the Victron's various api's that allows me to do so much.

0 Likes 0 ·

Hi @JohnC

Just as a general housekeeping to try and control the chaos - it would be appreciated if you could keep all things beta to the modifications space.

We welcome testing the feedback of course, but it's much clearer for all if we don't confuse the beta testing process with the production release. Cheers.

0 Likes 0 ·
foreignerpv avatar image
foreignerpv answered ·

bildschirmfoto-vom-2023-07-08-18-54-59.pngsince the update

in dark mode, the white line unfortunately appears in black


1 comment
2 |3000

Up to 8 attachments (including images) can be used with a maximum of 190.8 MiB each and 286.6 MiB total.

nickdb avatar image nickdb ♦♦ commented ·

That’s a different issue, already raised in another topic, unrelated to PV forecasts.

https://community.victronenergy.com/questions/217245/vrm-widget-colour-changed.html

0 Likes 0 ·
shaneyake avatar image
shaneyake answered ·

When does the API update? VRM dashboard has updated but the API still returns the previous days data.

3 comments
2 |3000

Up to 8 attachments (including images) can be used with a maximum of 190.8 MiB each and 286.6 MiB total.

Peter avatar image Peter commented ·


API has been updated, but you are looking at wrong url...


Documentation is not updated...


0 Likes 0 ·
shaneyake avatar image shaneyake Peter commented ·
Do you know what the correct URL is?
0 Likes 0 ·
Peter avatar image Peter shaneyake commented ·
https://vrmapi.victronenergy.com/v2/installations/xxxxx/stats?end=1688853599&interval=hours&start=1688802299&type=forecast
0 Likes 0 ·
vvv avatar image
vvv answered ·

Hi!

This is... W or Kw?

Thanks

Screenshot_20230709_065819_Adobe Acrobat.jpg


1 comment
2 |3000

Up to 8 attachments (including images) can be used with a maximum of 190.8 MiB each and 286.6 MiB total.

Hi @VVV

It's kWh, but it's weird to not have the units there, I'll see it gets fixed thanks.

0 Likes 0 ·
pierresmits avatar image
pierresmits answered ·

Are there thresholds involved in not showing the forecast, like e.g. the animation not showing from MPPT to battery when the power <= 30 watts?

8 comments
2 |3000

Up to 8 attachments (including images) can be used with a maximum of 190.8 MiB each and 286.6 MiB total.

nickdb avatar image nickdb ♦♦ commented ·
If you have solar, there should always be a forecast.
0 Likes 0 ·
pierresmits avatar image pierresmits nickdb ♦♦ commented ·

Weird... Maybe there is a parameter that I am missing (Your site is recording hourly solar yield??) as I have a location set (from usb dongle into my PI, and saved as well).


screenshot-2023-07-09-at-150736.png

The image above shows the button to show the forecast. But when clicked, the 'Hide forecast' is just shown briefly and then I get the result shown below.
screenshot-2023-07-09-at-150751.png

And after a short while te situation is like in the first image.

0 Likes 0 ·
nickdb avatar image nickdb ♦♦ pierresmits commented ·
What inverter/mppt are you using?
0 Likes 0 ·
Show more comments
philipl avatar image
philipl answered ·

Have any of you used the VRM API in NodeRed?

I am using the VRM API NODE in NodeRed and calling the Installation Stats - Solar Irradiance Forecast, which returns the hourly forecasts for 24 hours and the total forecast under totals: vrm_solar_irradiance_fc.


I have noticed that a couple of things are not right:

1. The values are completely different from the values shown on the Victron Energy Forecast Dasboard, roughly differing by a factor of 2 or 3. So I am looking at the same site, and the forecast on the dasbhoard is completely different from the forecast for the same site as called from NodeRed. The values on the dashboard looks more or less correct but the values from the API is incorrect.

2. The total forecast returned by the API in NodeRed is way too low, it should be more than double the forecasted total value.

3. If I look at the 24 hour forecast in NodeRed, every second entry in the arrays is close to 0. So it would go something as follows: 9am: 4077w, 10am: 159w, 11am 5503w, 12pm 99w, 1pm 6084w etc. So every second entry is wrong, and almost zero.

4. I just did a call to the api at 15h20 on 9 July and it is returning the forecast for 3pm 8 July to 3pm 9 July. So it is giving "old" data, and nothing going forward. I repeated this a few times and also called the irradiance forecast which also returns old data and nothing going forward.

3 comments
2 |3000

Up to 8 attachments (including images) can be used with a maximum of 190.8 MiB each and 286.6 MiB total.

nickdb avatar image nickdb ♦♦ commented ·
This has been raised already with the devs, waiting for feedback.
0 Likes 0 ·
genrotsvk avatar image genrotsvk commented ·

Hi philipl ,

How do I get a forecast? I use this yellow node. and I tried all the settings and the command example and I still get the value current-1 h. so if I activate it at 7:30, I get the last value at 7:00 or 6:30 (depending on the node settings), but never in the future on that day.


thank you very much

annotation-2023-07-10-064510.png

0 Likes 0 ·
philipl avatar image philipl genrotsvk commented ·
Hi, I get the same, from what I understand there are still some issues with the API that the dev team needs to fix. You are supposed to get the forecast there, but at the moment it seems to be old data. Thanks
0 Likes 0 ·
gainestr avatar image
gainestr answered ·

It may not be relevant to some but I do like the consumption forecast that is still on the beta VRM site and hope that it is included in the main VRM site. Can a Dev confirm this?

1 comment
2 |3000

Up to 8 attachments (including images) can be used with a maximum of 190.8 MiB each and 286.6 MiB total.

nickdb avatar image nickdb ♦♦ commented ·

As stated above, it is currently more of a proof of concept, there is no commitment that it will grow up into an actual VRM feature. It may only be used behind the scenes to enable other functionality.

In any case, it would most likely remain accessible via API.

0 Likes 0 ·
jameshoare1964 avatar image
jameshoare1964 answered ·

This is great, and adding the Node Red functionality into the Victron core firmware is great. Not sure if predicted temperature is included, as along with predicted solar is probably as good as it can get, especially for those with heat pumps as is a major energy demand when colder.

Non critical loads are a classic example of areas where utility demand response initiatives can see energy savings

Look forward to seeing it released, and will be adopting it. screenshot-2023-07-10-at-073109.png


2 |3000

Up to 8 attachments (including images) can be used with a maximum of 190.8 MiB each and 286.6 MiB total.

martin-modr avatar image
martin-modr answered ·

Hi, some bug, every second hour. Screen from 9:55.
10:00 - 11:00: 0,01 kWh.

I think more accurate results will be after scheduled prediction for each MPPT used.
forecast.png


forecast.png (93.7 KiB)
1 comment
2 |3000

Up to 8 attachments (including images) can be used with a maximum of 190.8 MiB each and 286.6 MiB total.

Hi @Martin Modr,

The team is looking into a fix for this alternating hour issue on some sites.

0 Likes 0 ·
bigbadbob76 avatar image
bigbadbob76 answered ·

Thank you for this feature, very useful to me.

Will the forecast data be available in the mobile widgets in the future?

2 comments
2 |3000

Up to 8 attachments (including images) can be used with a maximum of 190.8 MiB each and 286.6 MiB total.

Hi @Bigbadbob76

Yes, updated phone widgets will be coming. No timeline yet.

1 Like 1 ·
bigbadbob76 avatar image bigbadbob76 Guy Stewart (Victron Community Manager) ♦♦ commented ·

Thanks Guy.

0 Likes 0 ·
ozdw avatar image
ozdw answered ·

For some reason, I'm getting a zero forecast in the VRM dashboard, though the solar irradiance forecast widget in "Advanced" seems OK. My location is set and the weather widget shows correct info. I can show/hide the forecast, but it is always zero. I haven't updated CCGX firmware in some time. BTW, I've been getting Solcast forecast data directly for years and it is usually scary accurate.


My system includes a CCGX, two Quattro 48/10000/140-2x100, two MPPT 450/100, a SmartSolar Charger MPPT 150/100, a Fronius PV inverter.

Any thoughts on the zero energy forecast in the Dashboard?

Update: Odd. It is now starting to show a partial forecast.

2 comments
2 |3000

Up to 8 attachments (including images) can be used with a maximum of 190.8 MiB each and 286.6 MiB total.

mvader (Victron Energy) avatar image mvader (Victron Energy) ♦♦ commented ·

Hi, thank you for the report. We today found a bug that affected new enabled sites; its fixed; please if you don't see any data by tomorrow then ring the alarm bell again.


Have a good day!

0 Likes 0 ·
pavol-rehak avatar image pavol-rehak mvader (Victron Energy) ♦♦ commented ·
Hello

I also have still 0 as Forecast now for 3 days without a change. can you please help here? thx

0 Likes 0 ·
Dave Rae avatar image
Dave Rae answered ·

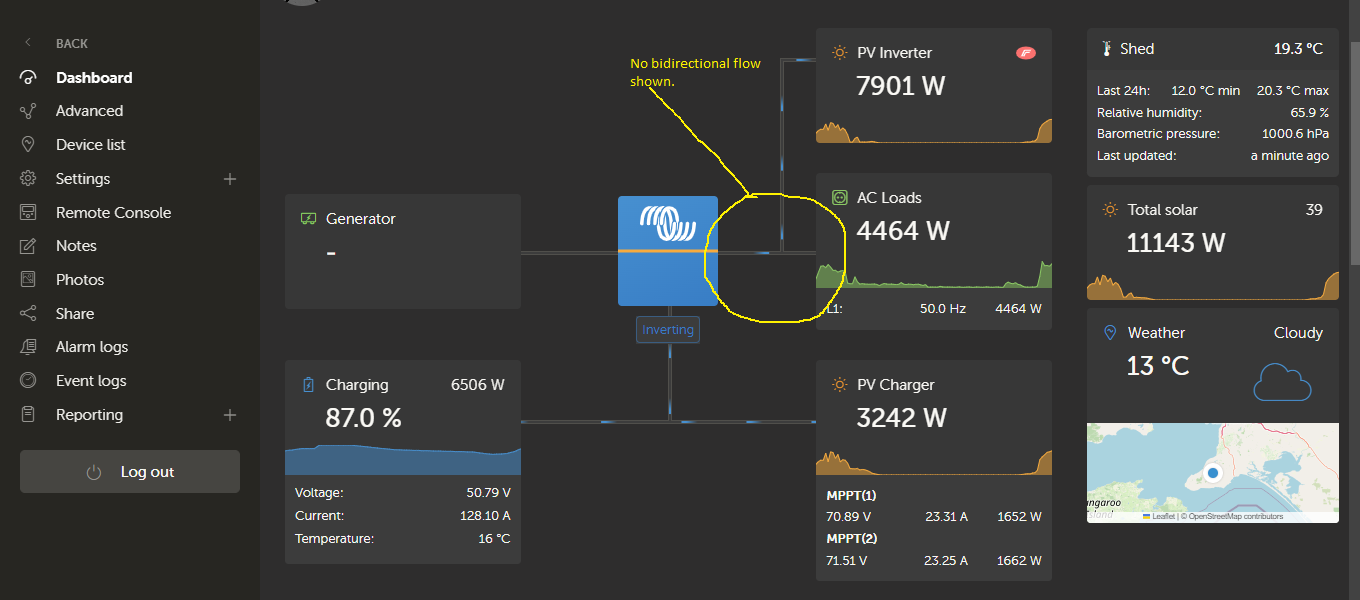
VRM still not showing correct bidirectional flow from the Fronius to the AC load and to the Multiplus-II. The graphic incorrectly shows flow in one direction only even when excess power from the Fronius is being sent to the batteries.. This issue has been reported months ago and is still a bug that seems to be getting over looked.screenshot-10.png


screenshot-10.png (112.6 KiB)
2 |3000

Up to 8 attachments (including images) can be used with a maximum of 190.8 MiB each and 286.6 MiB total.

mattsmith avatar image
mattsmith answered ·

Firstly thank you very much to Victron and Solcast for adding this..!

I've been integrating Solcast and VRM via nodered for over a year and it's amazingly powerful for being off grid.

If I can suggested a future upgrade would be to include the P10 forecast and also provide a roll up for the day being forecast - battery used.

This is very very powerful as you can simply say if the forecast - battery > 10 then turn on x. I used this feature to turn on hotwater, air conditioning etc. I use the P10 forecast as the test when i need things with a long runtime so want to turn on early. In the last year or two I've very rarely seen an outcome lower than the P10.

Very happy to share my code if that helps the team. Oh I also have code that does the rollout and removes forecast entries that have gone into the past, this is helpful as the forecasts can be cached so you end up counting forecasts that are historical.

Thanks @Guy Stewart (Victron Community Manager) and @mvader (Victron Energy)

1 comment
2 |3000

Up to 8 attachments (including images) can be used with a maximum of 190.8 MiB each and 286.6 MiB total.

Hi @MattSmith,

If you're willing to share your code, I think the best way would be as as open source GitHub project with the license and then post the link and explainer into the community Modifications space - https://community.victronenergy.com/spaces/31/index.html

We have a few months of projects planned that integrate these new data feeds already ahead, so might help bridge that gap.

1 Like 1 ·
mattsmith avatar image
mattsmith answered ·

Firstly thank you very much to Victron and Solcast for adding this..! I've been integrating Solcast and VRM via nodered for over a year and it's amazingly powerful for being off grid. If I can suggested a future upgrade would be to include the P10 forecast and also provide a roll up for the day being forecast - battery used. This is very very powerful as you can simply say if the forecast - battery > 10 then turn on x. I used this feature to turn on hotwater, air conditioning etc. I use the P10 forecast as the test when i need things with a long runtime so want to turn on early. In the last year or two I've very rarely seen an outcome lower than the P10. Very happy to share my code if that helps the team. Oh I also have code that does the rollout and removes forecast entries that have gone into the past, this is helpful as the forecasts can be cached so you end up counting forecasts that are historical. Thanks @Guy Stewart (Victron Community Manager) and @mvader (Victron Energy)

2 |3000

Up to 8 attachments (including images) can be used with a maximum of 190.8 MiB each and 286.6 MiB total.

multivictor avatar image
multivictor answered ·

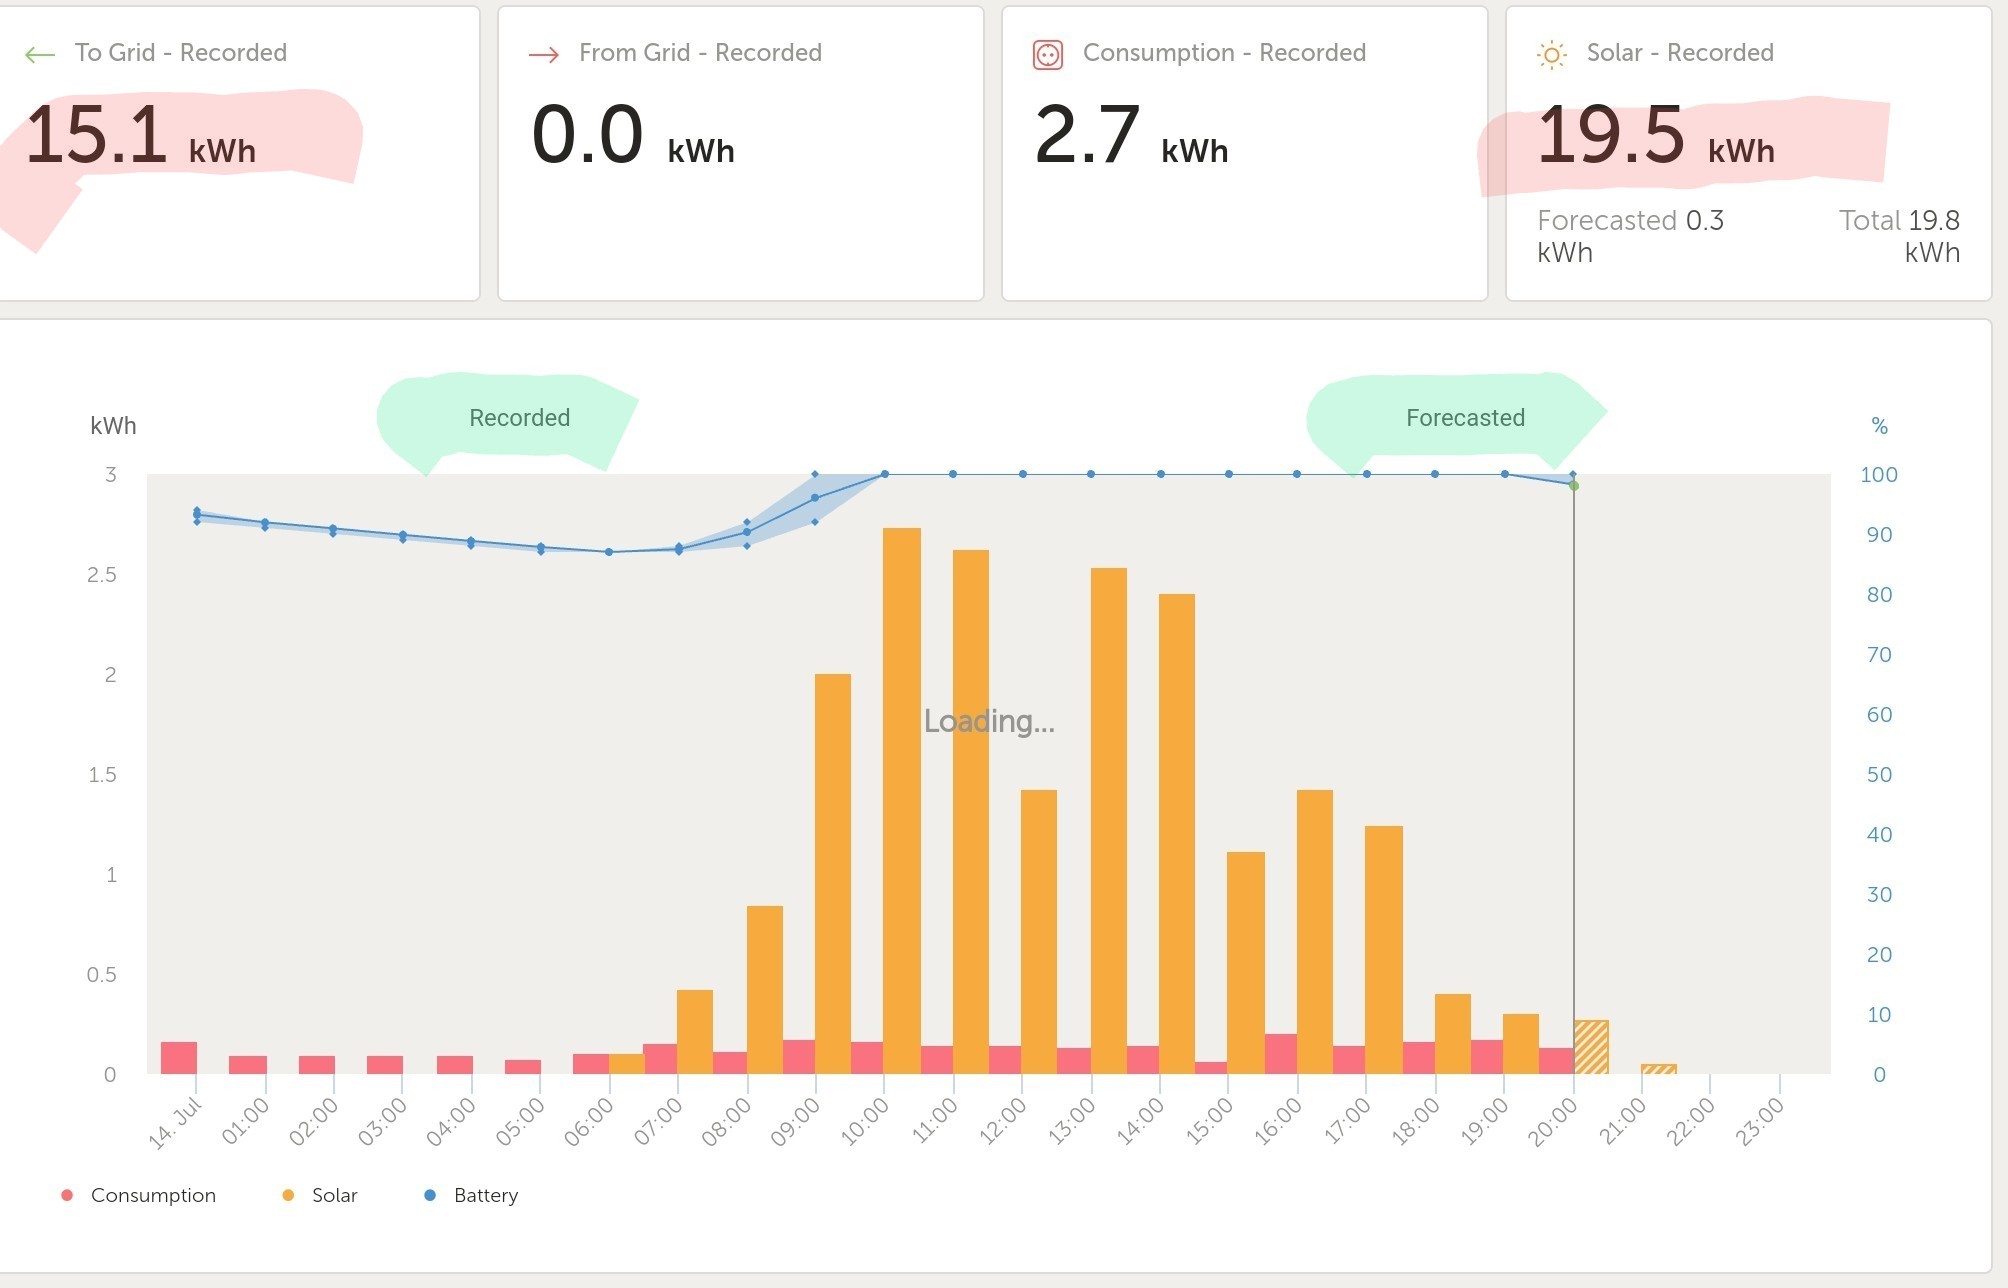
From now on there are apparently three digits (red markers) to see, thanks!

Question:

What is the text "Recorded" and "Forecasted" meaning in the main graph screen in the VRM app? (green markers). It seems meaningless in that place?

screenshot-20230714-202619-vrm4.jpg


2 comments
2 |3000

Up to 8 attachments (including images) can be used with a maximum of 190.8 MiB each and 286.6 MiB total.

Hi @MultiVictor,

Those labels are a design element to help people who are new to the interface to distinguish the past from the future, describing what that line delineates.

In your example there it doesn't work very effectively because there is so little time left in the day, but in my morning example here it's clearer.

cleanshot-2023-07-15-at-083841.jpg

1 Like 1 ·
multivictor avatar image multivictor Guy Stewart (Victron Community Manager) ♦♦ commented ·
Ok, clear. Thx.


0 Likes 0 ·