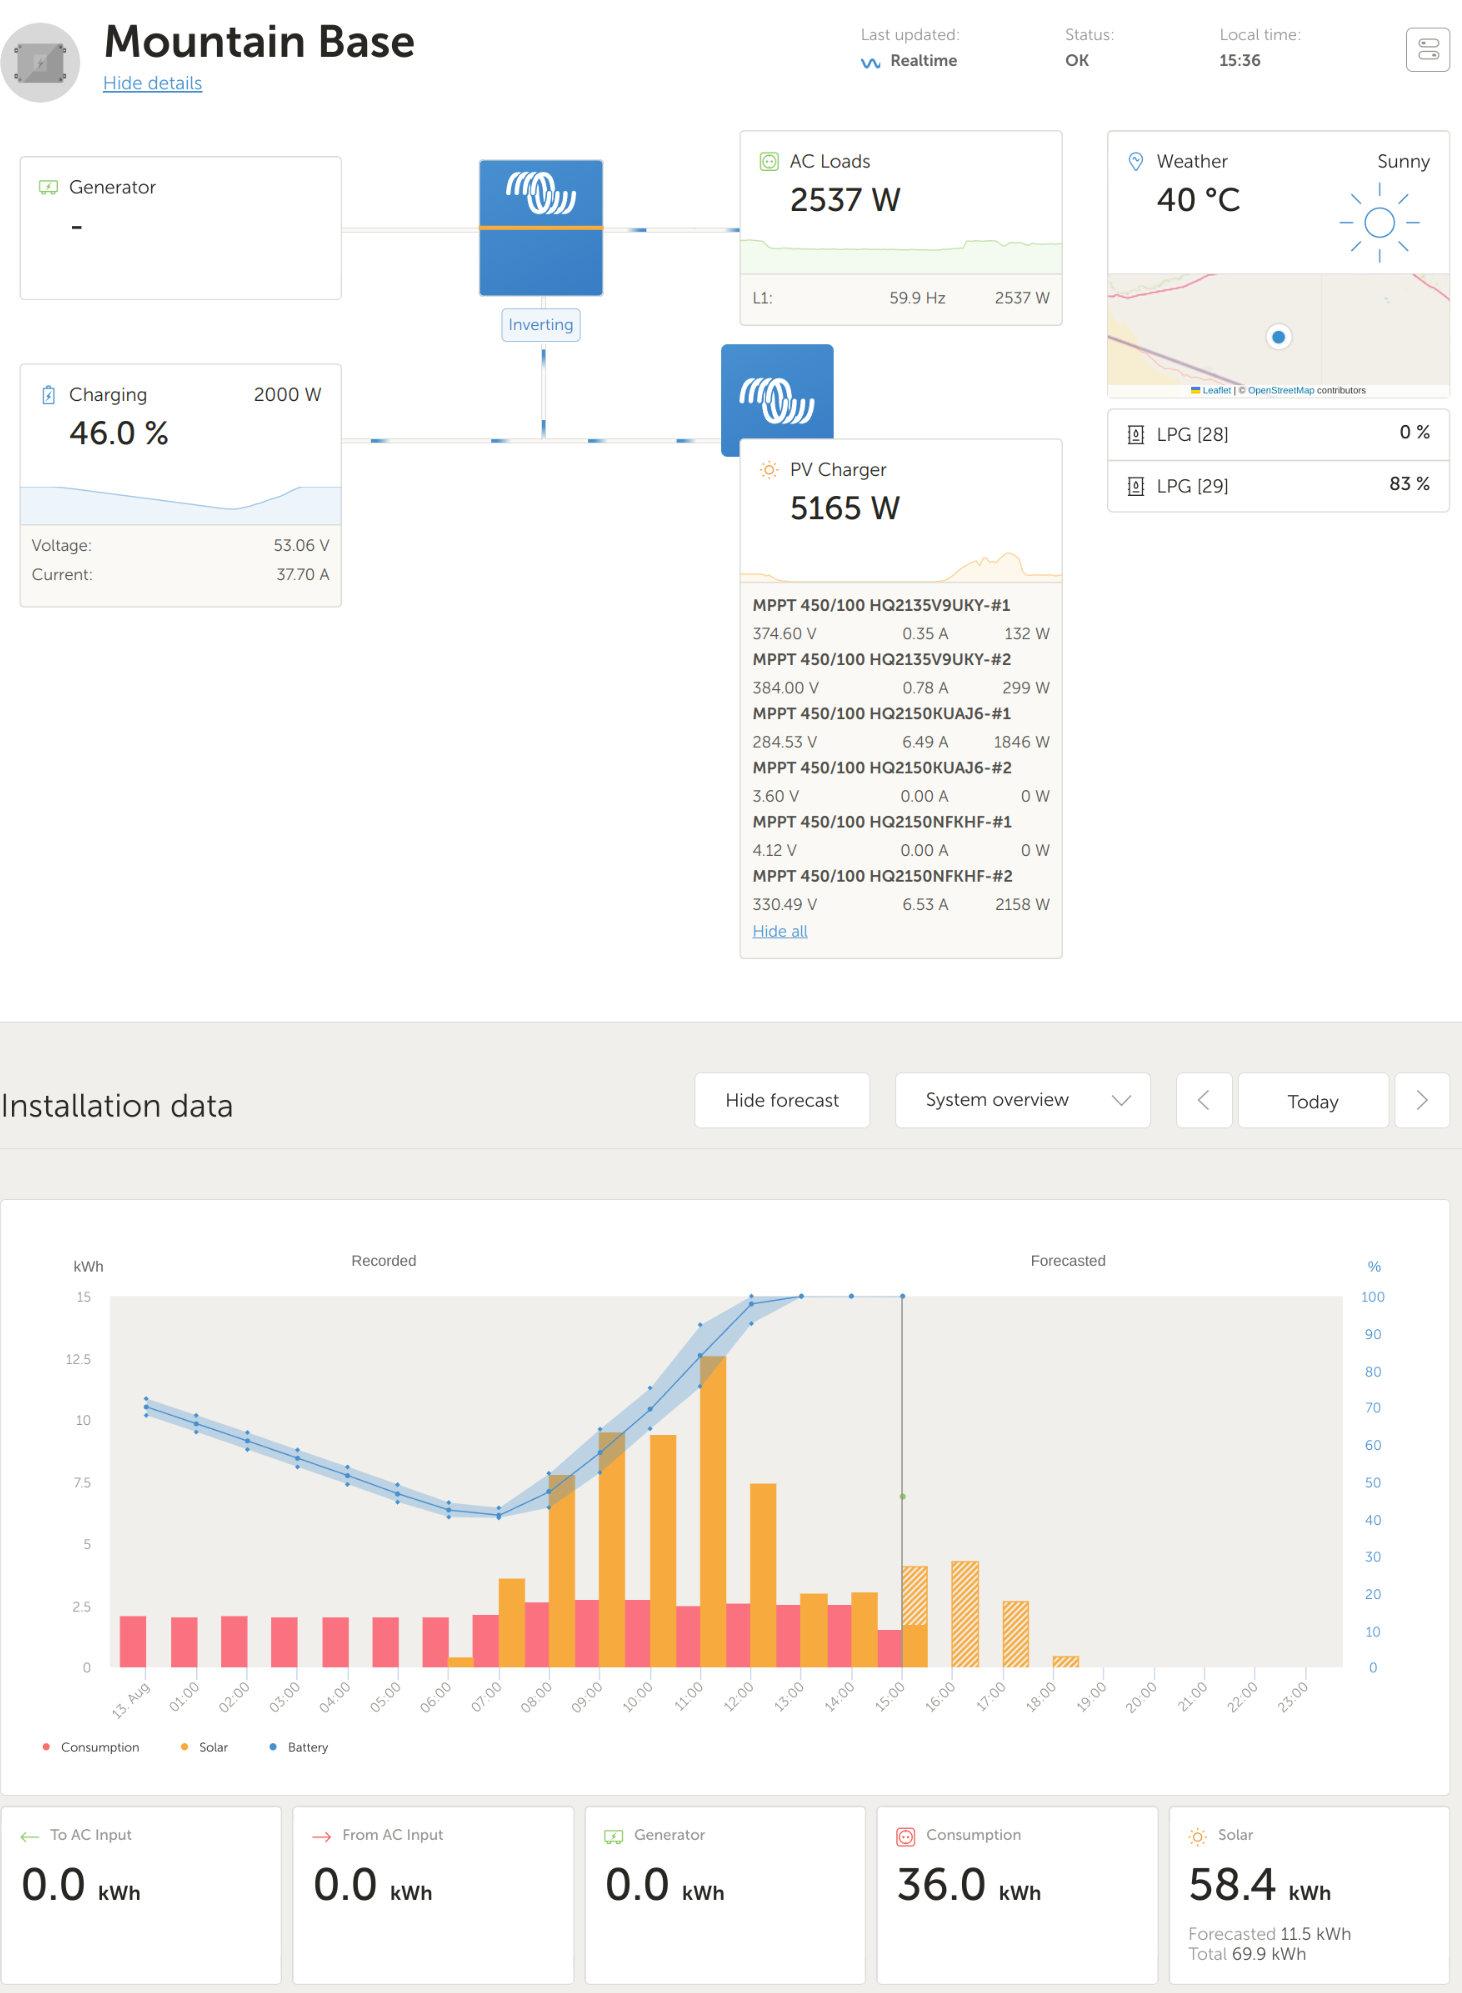
Every few days, my VRM dashboard values get frozen in time showing the same values on the APP and on the browser dashboard.
If I refresh the screen, the correct values flash for an instant and then revert to the same stuck values. The little built in graphs under the values do change and reflect correctly (can see solar input through the day while the numerical value says 0 all day).
Advanced graphs and the Cerbo screen itself as well as remote console show the correct realtime data.
The only way I've been able to "fix" it is to restart the Cerbo, somehow that causes an update in VRM that clears out the stuck value.
Here's a screen record of refreshing the dashboard, you'll see the initial load frame has the real values and then it reverts to the same stuck values.
Here's the "All installations" bar upon first logging in:

After I go to the home dashboard and go back to the All installations page, it always reverts to this identical value. Same battery SoC%, Voltage and Grid/Load values


