question

mvader (Victron Energy) avatar image
mvader (Victron Energy) asked

Updated Advanced page on the VRM Portal

Hi all,


Earlier this week, we've released a new version of the Advanced page of the VRM portal. Its now much more suitable to analyse the data of an installation.


Hereby some screenshots to show the new features.

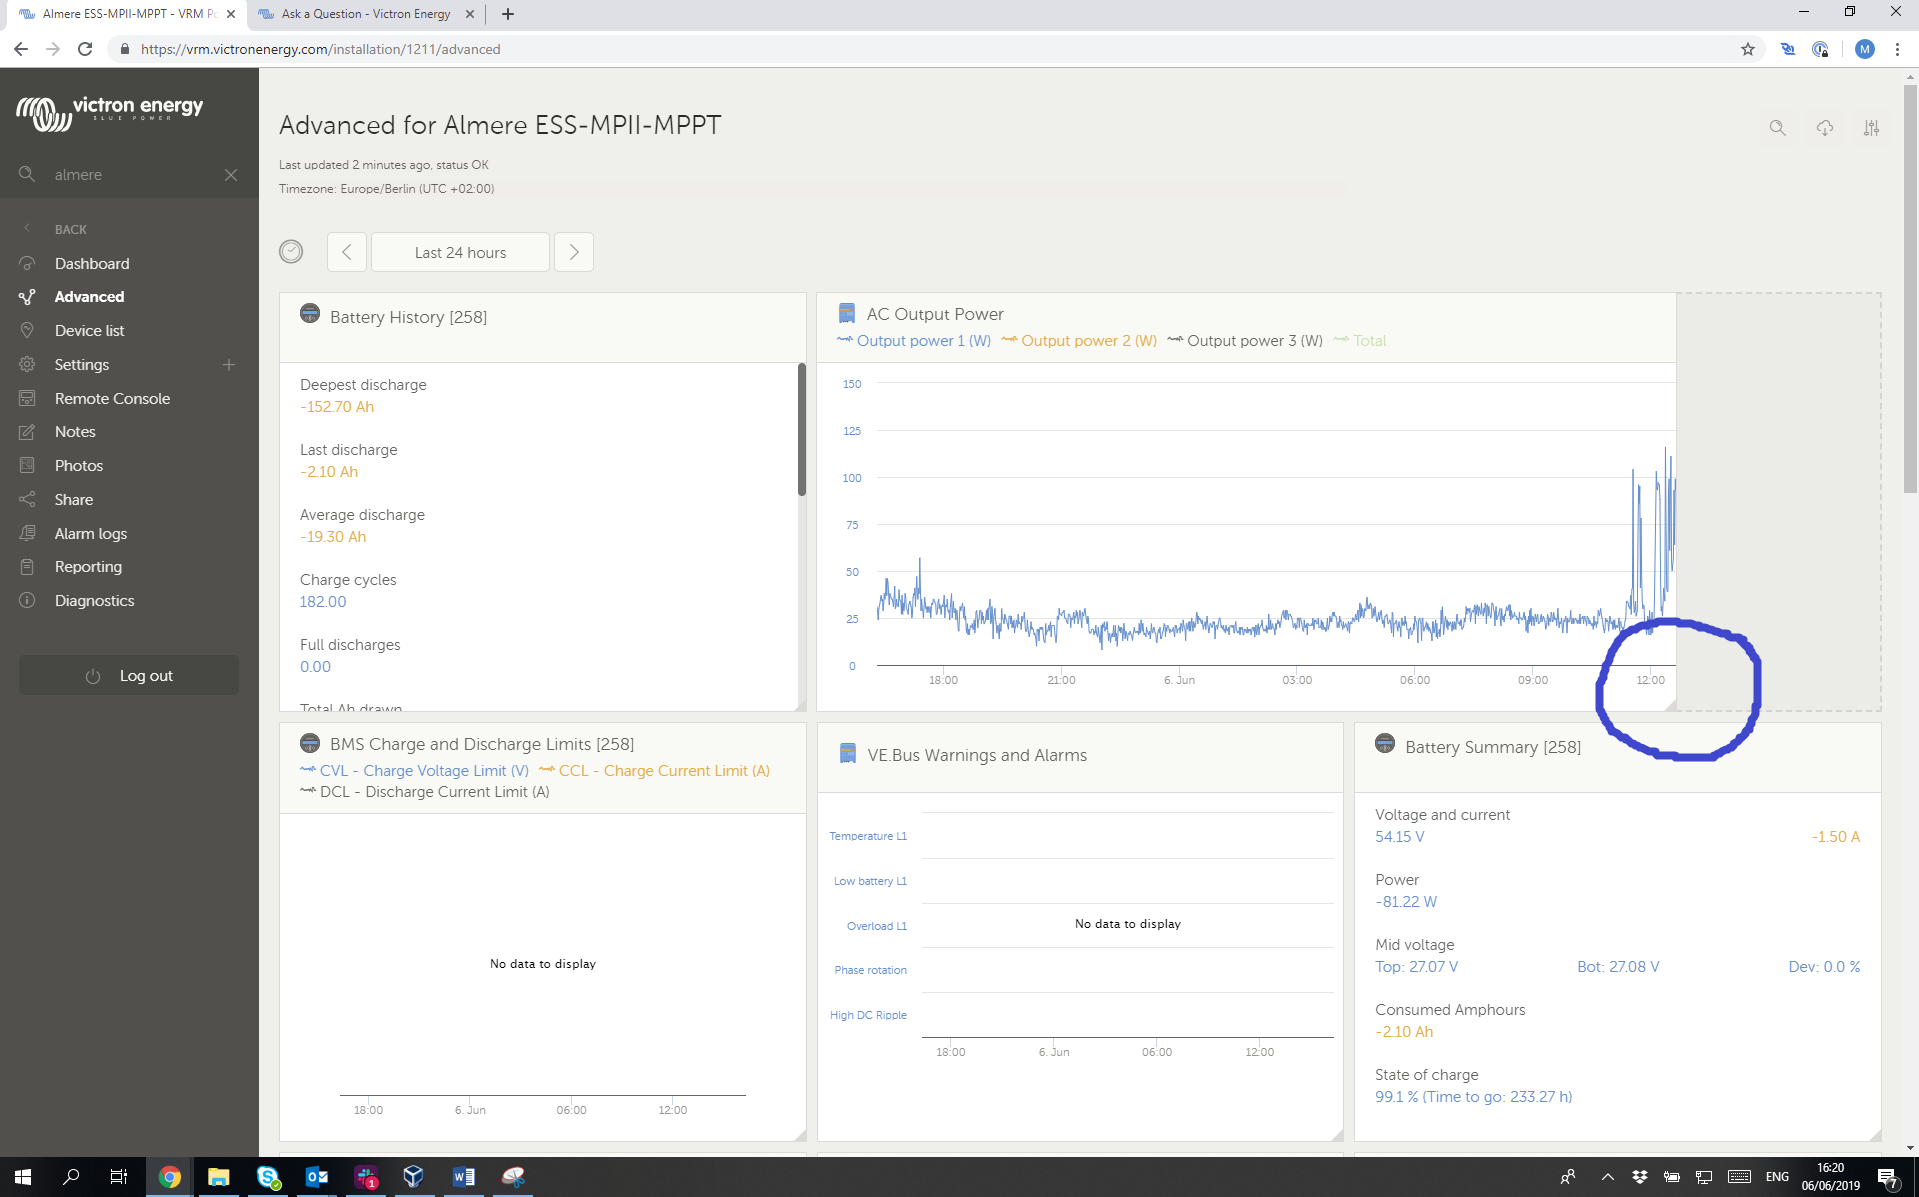
  1. The first shot shows the main page. Note the little triangle on the lower right, it allows to drag and resize a chart. You can choose between 1, 2 or three columns wide.

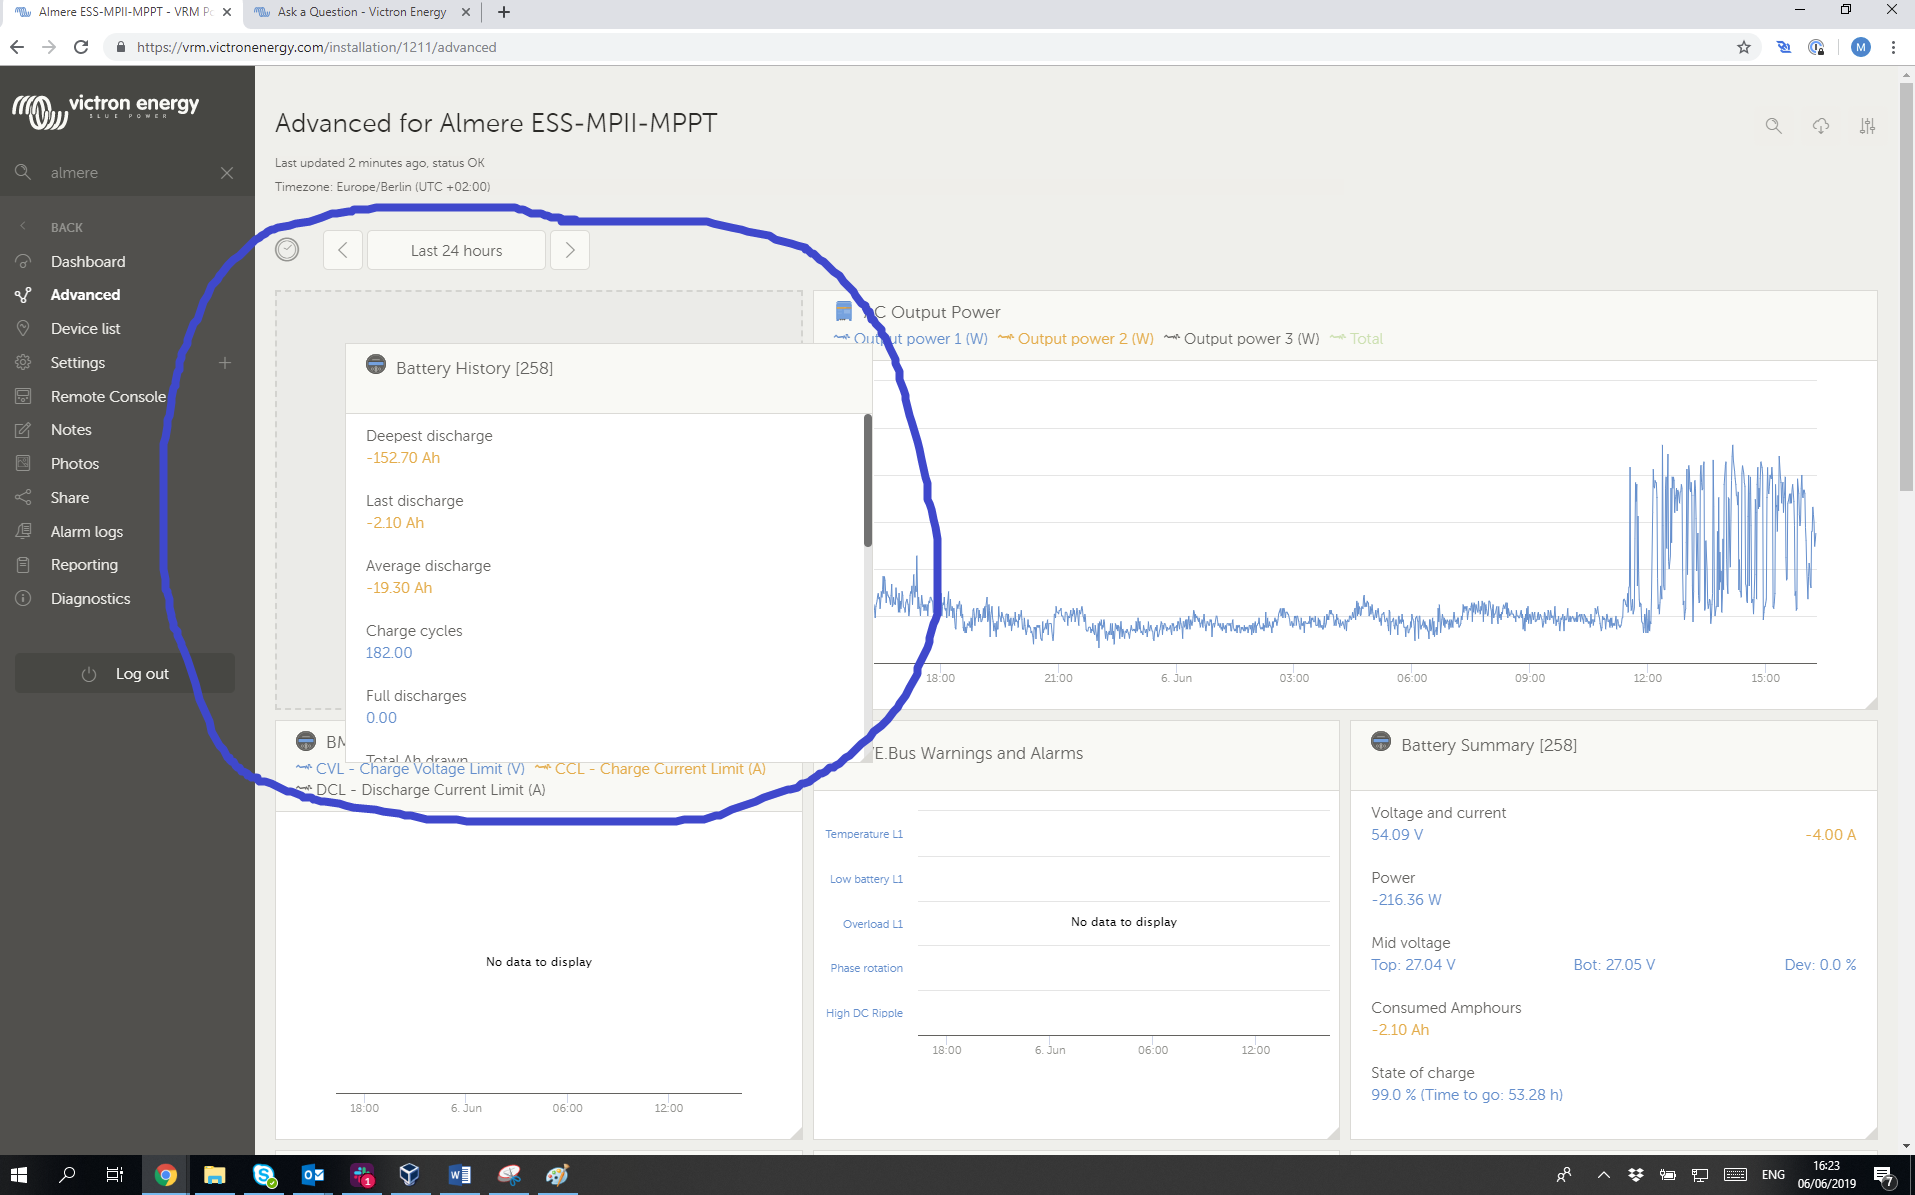
  2. The second shot shows the dragging: you can now drag the charts. Together with the resizing, this makes it possible to very easily organise what you want to see on one page. Super handy when analysing and looking for a specific issue.

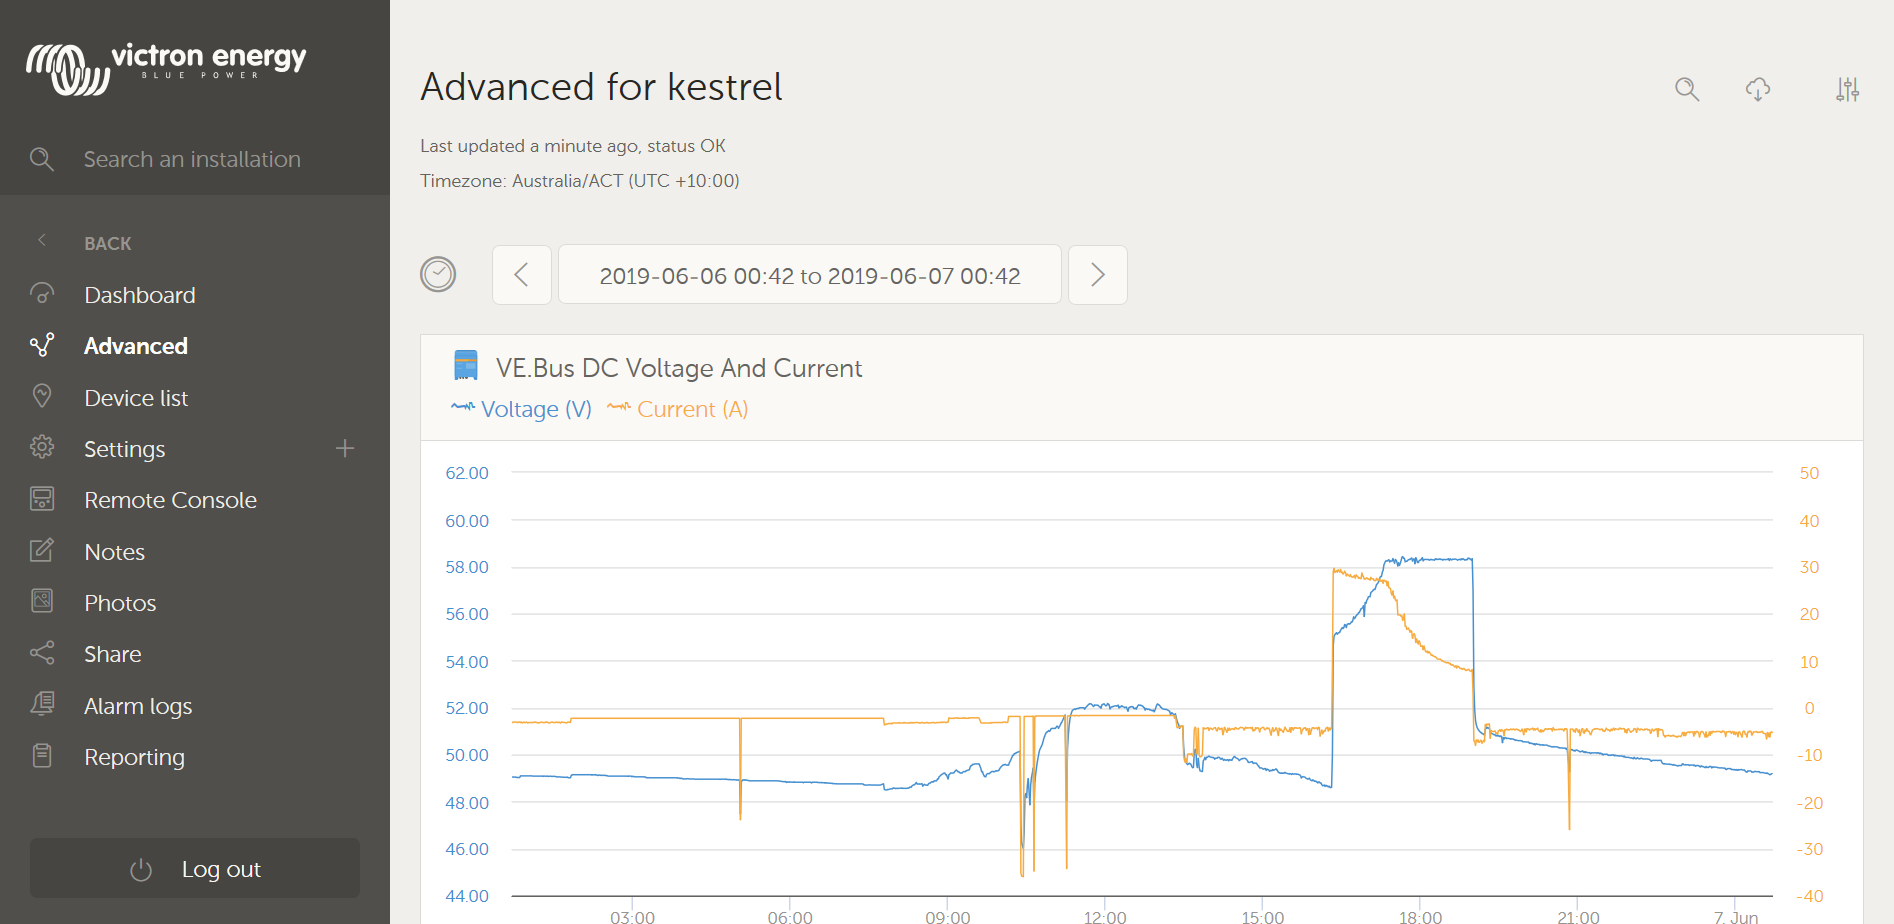
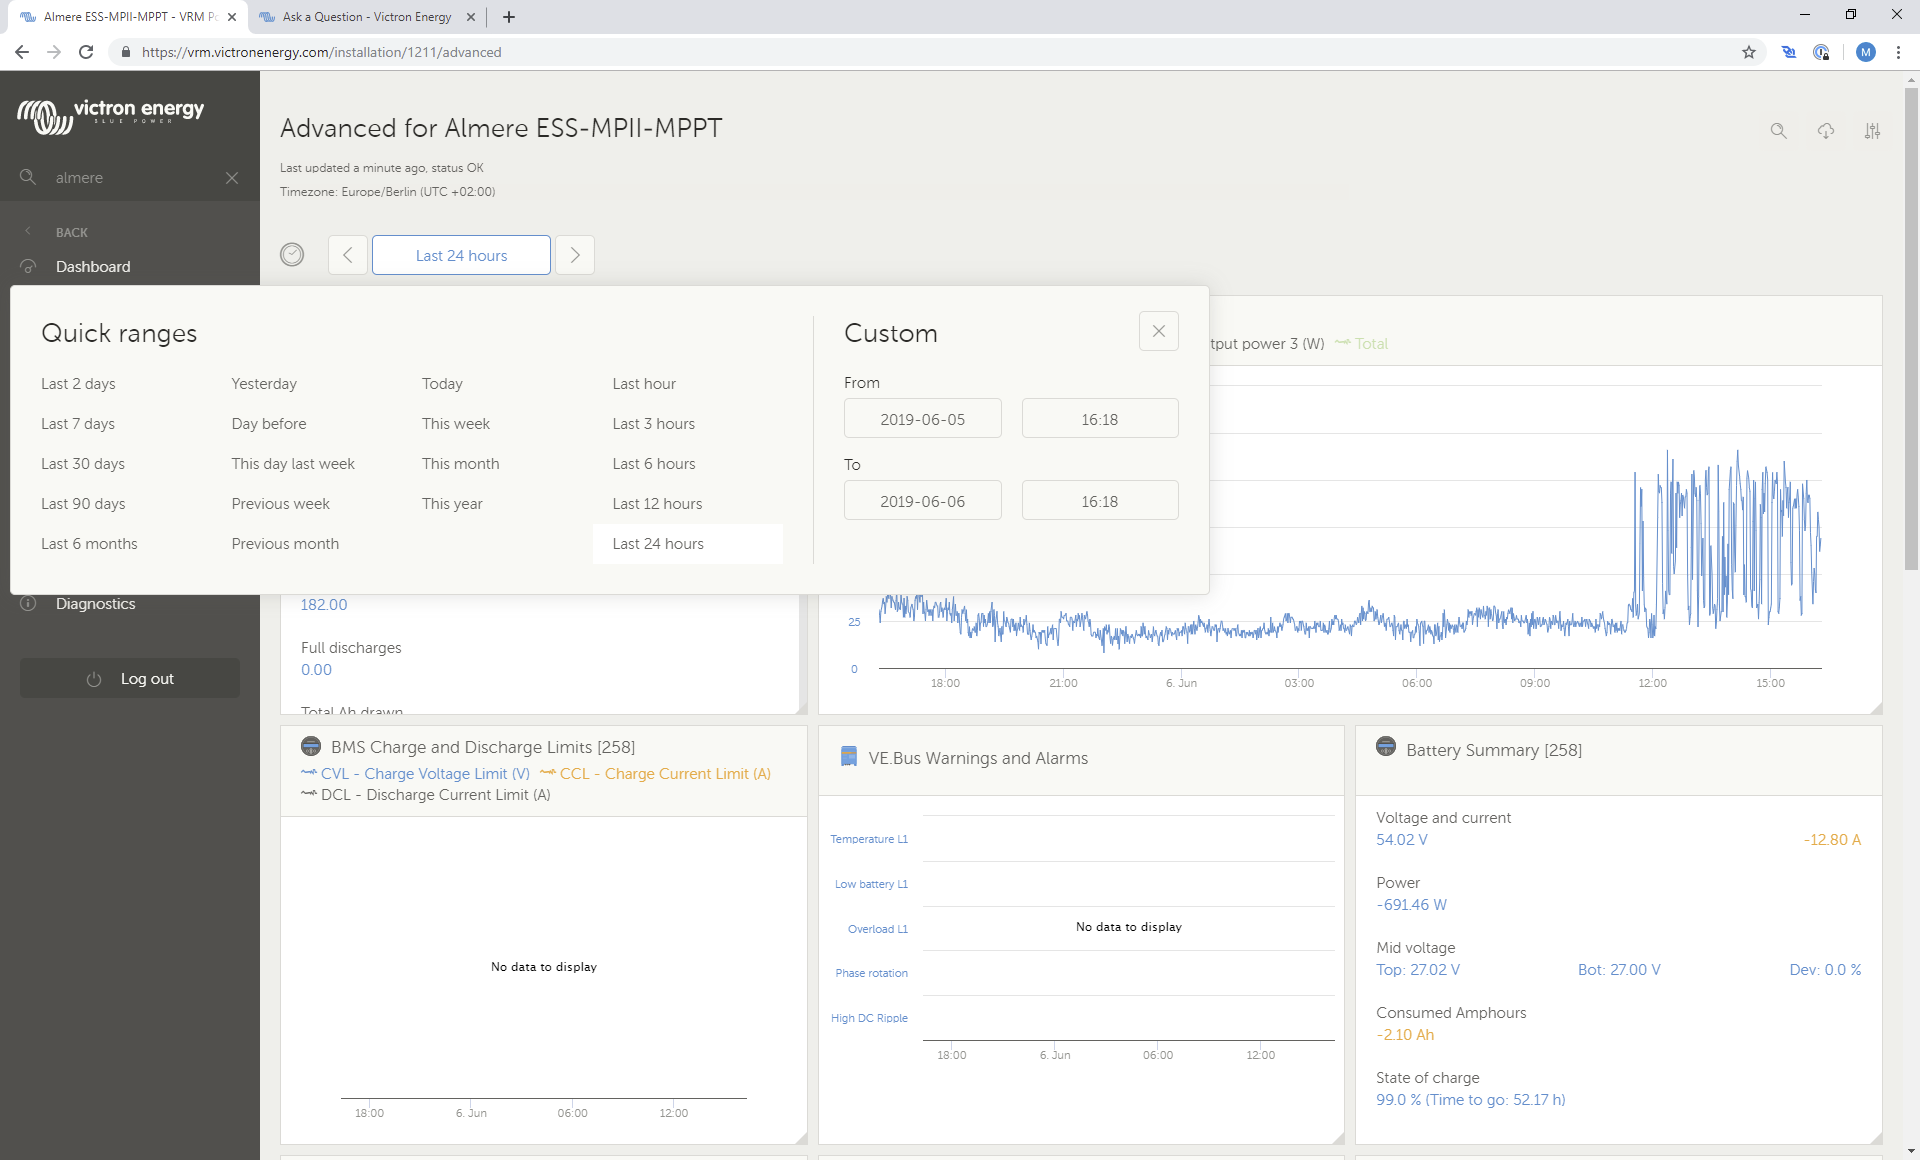
  3. Another way better working feature is the date picker. See the third screen shot.

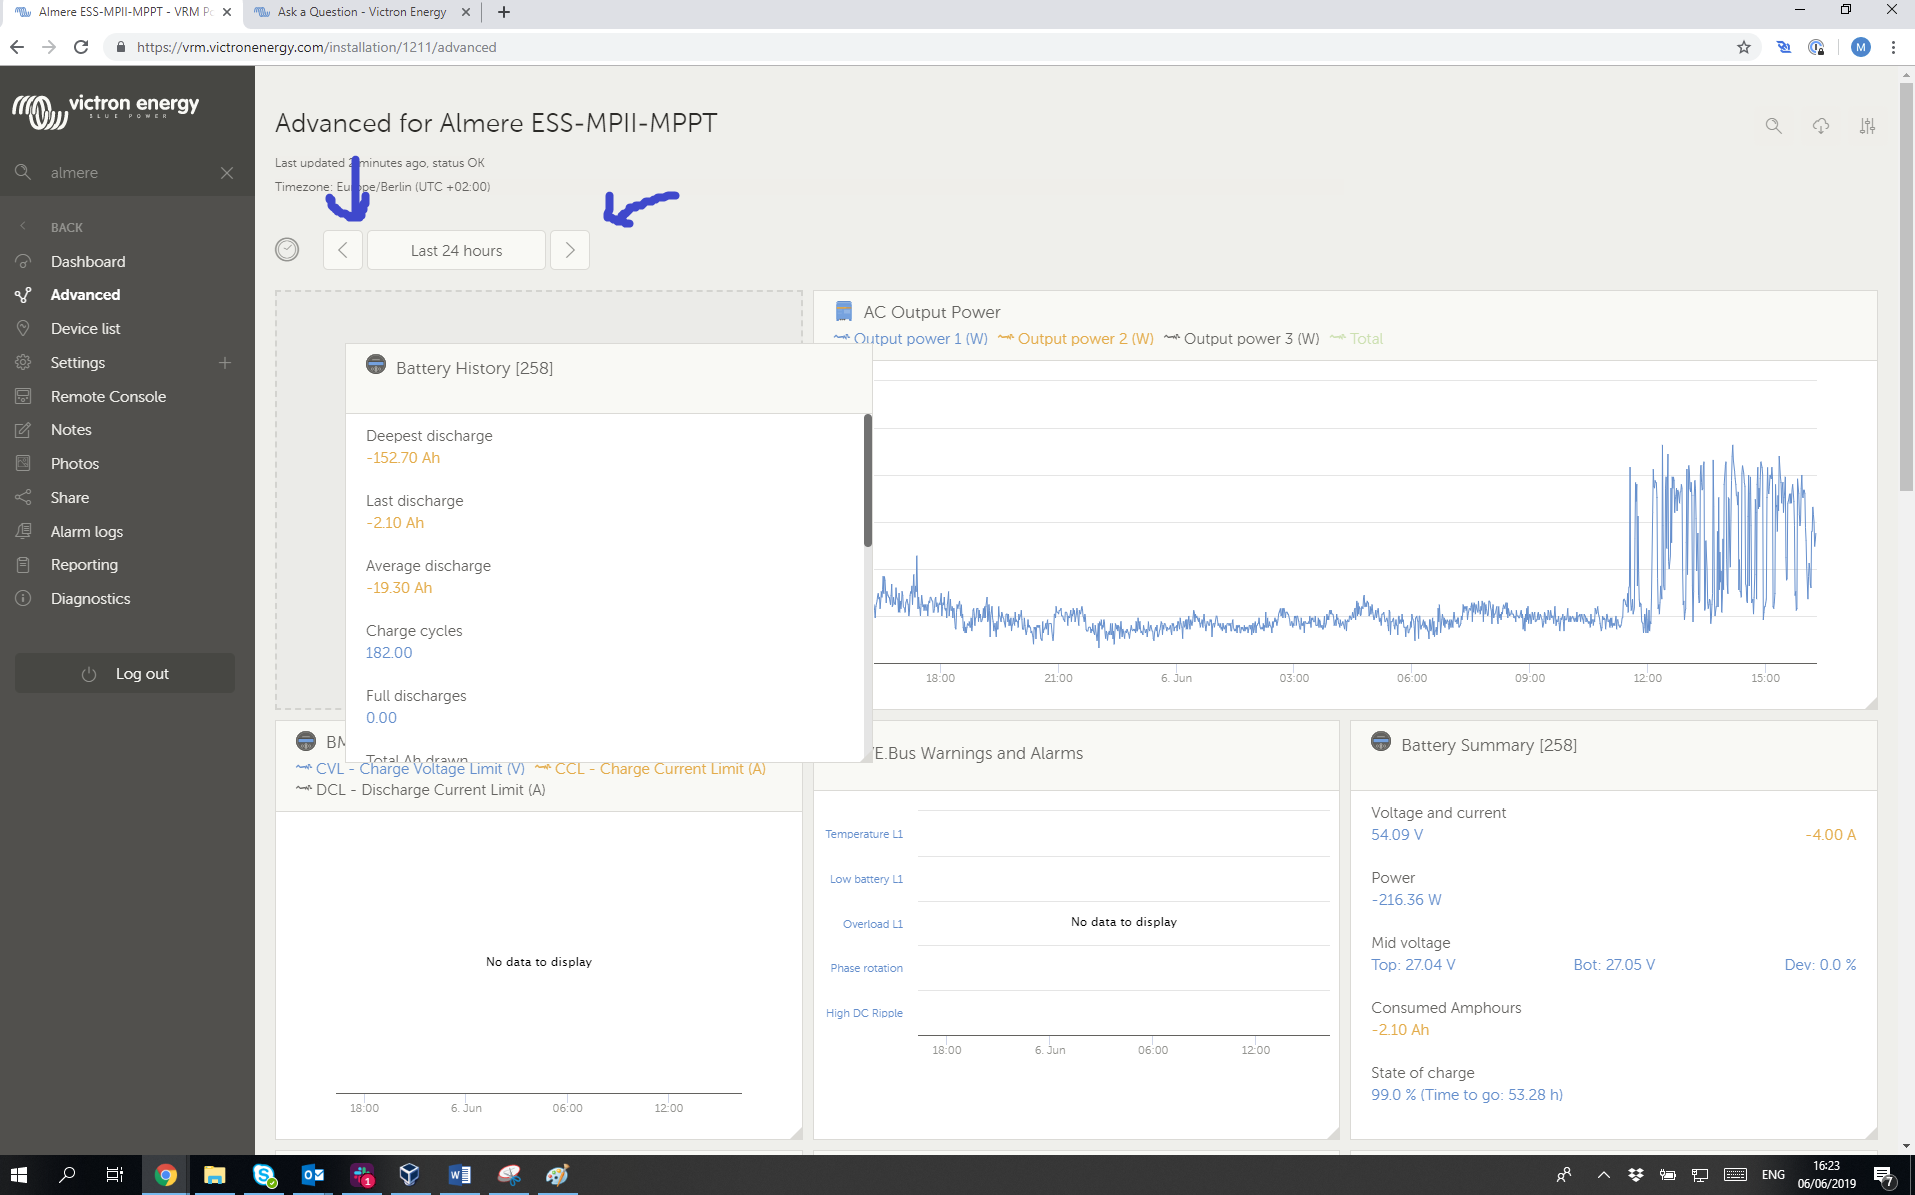
  4. Also, you can now easily go from one page to the other, clicking the arrows left and right. See fourth screenshot.

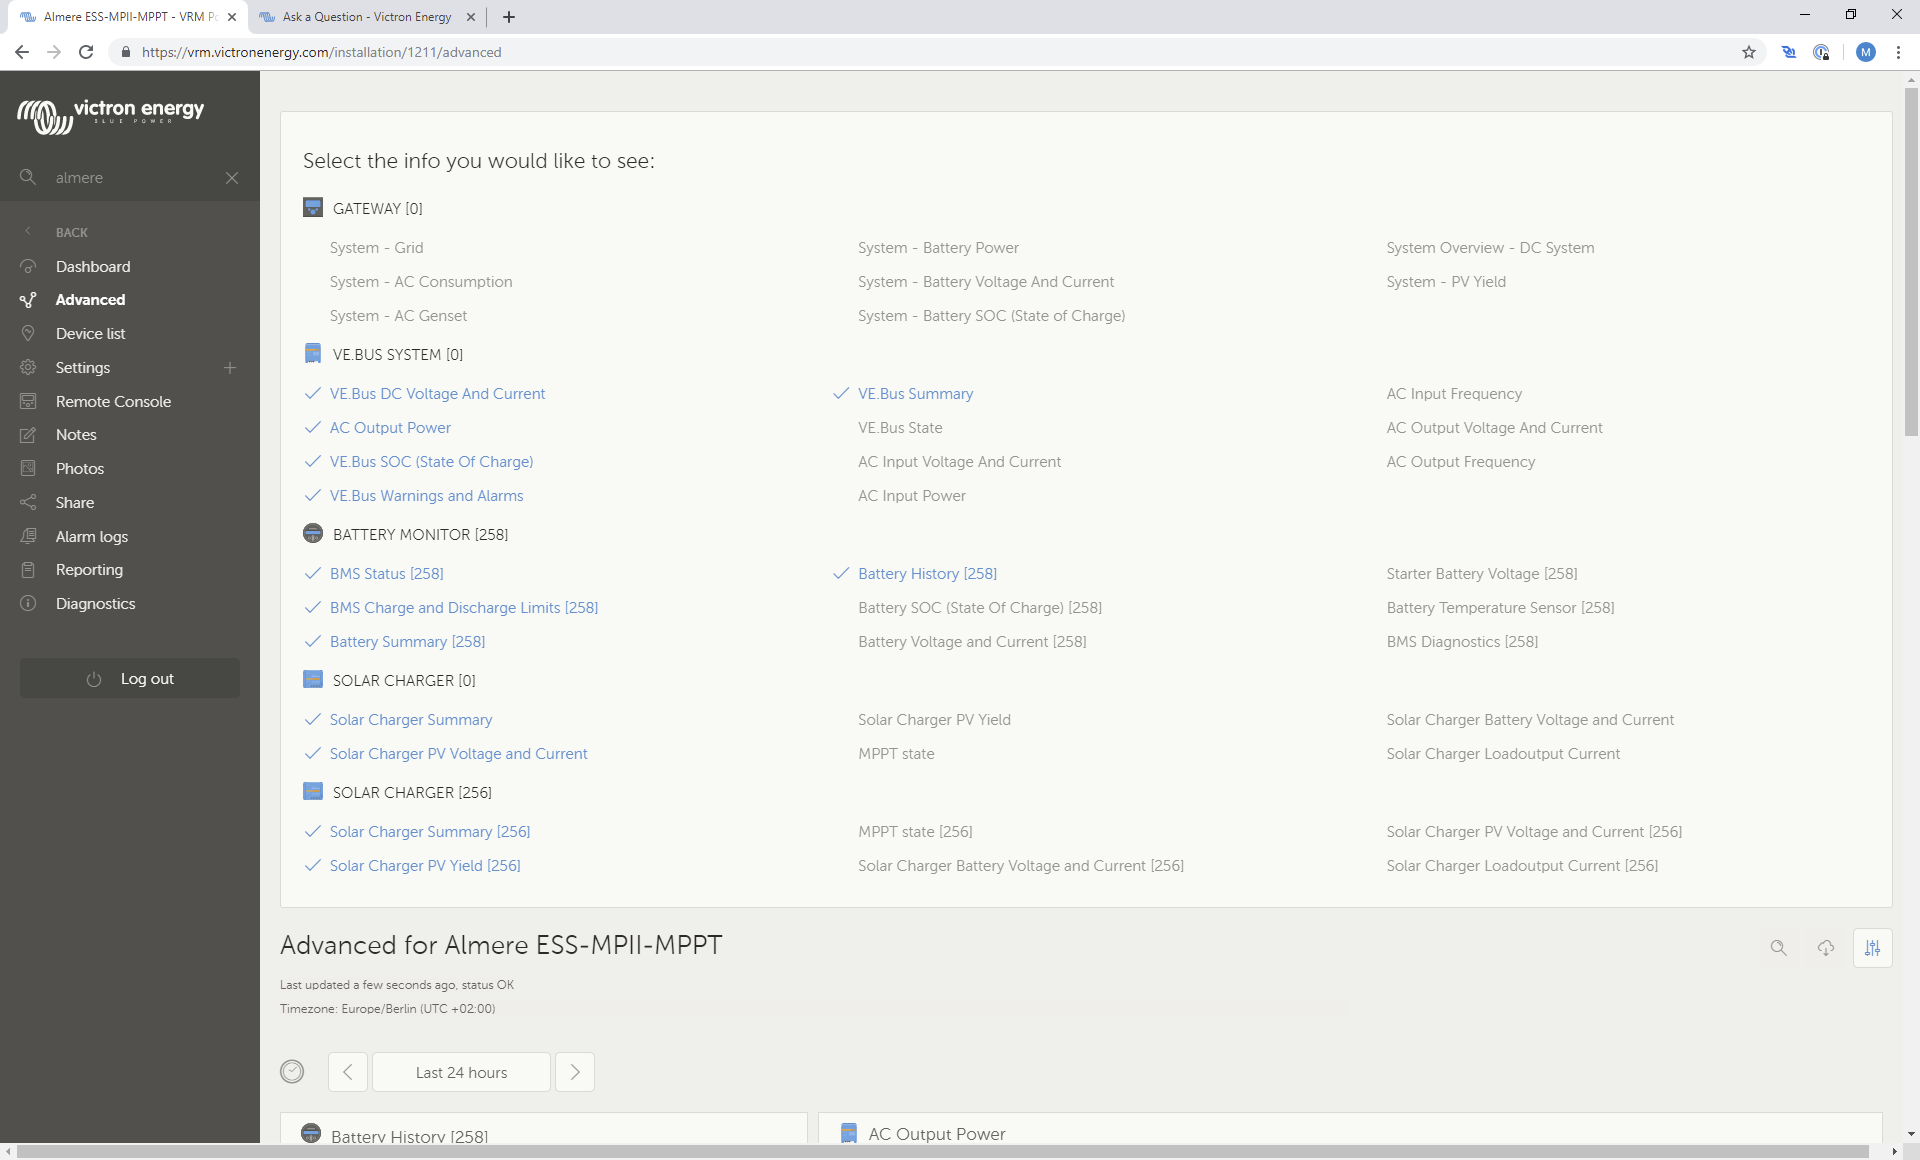
  5. Lastly, the Selector is much more organised. See fifth screenshot.


So; not a question; this post is just to make sure all of you are aware of these improvements.


Best regards, Matthijs


First screenshot, resizing:

Second screenshot, dragging:

Third screenshot, better date picker:

Fourth screenshot, easily go to next and previous period:

Fifth screenshot, better selector:
VRM
1559831005618.png (270.7 KiB)
1559831134653.png (283.5 KiB)
1559831169770.png (301.4 KiB)
1559831244299.png (285.3 KiB)
1559831285717.png (223.2 KiB)
1559831467722.png (194.7 KiB)
2 comments
2 |3000

Up to 8 attachments (including images) can be used with a maximum of 190.8 MiB each and 286.6 MiB total.

mvader (Victron Energy) avatar image mvader (Victron Energy) ♦♦ commented ·

Ps. There have been more improvements to the portal lately. Such as showing alarm status in red at the top and more. For a full list, see: https://www.victronenergy.com/live/vrm_portal:change_log

0 Likes 0 ·
Show more comments
5 Answers
PeterM avatar image
PeterM answered ·

Thanks , very nice. Recently also I see you have added VE Bus temperature :)

2 |3000

Up to 8 attachments (including images) can be used with a maximum of 190.8 MiB each and 286.6 MiB total.

JohnC avatar image
JohnC answered ·

Great. I think VRM is perhaps Victron's greatest enduser asset. And I've seen this: "New advanced page: you can now put widgets next to each other and resize graphs on the advanced page"

How do you actually get those set up? Sure I'm stupid, like Forrest Gump, but I can't find how to make a combo page like you show. Even went to the website demo, but too clever for me, just defaults to my own user. No little triangles or so, but I surely noticed scaling changes and a lot of the other stuff.

Just a blind man who needs a bit of a cane. Probably over the backside, but I can't work it out..?

23 comments
2 |3000

Up to 8 attachments (including images) can be used with a maximum of 190.8 MiB each and 286.6 MiB total.

Teun Lassche avatar image Teun Lassche ♦ commented ·

Whats your resolution? Might be that its too small for the resizing to show up. We are looking if we can support it for more screen sizes though, so stay tuned

0 Likes 0 ·
JohnC avatar image JohnC ♦ Teun Lassche ♦ commented ·

1920x1080. It's not that. Just me, & an education void..

0 Likes 0 ·

Hi @JohnC

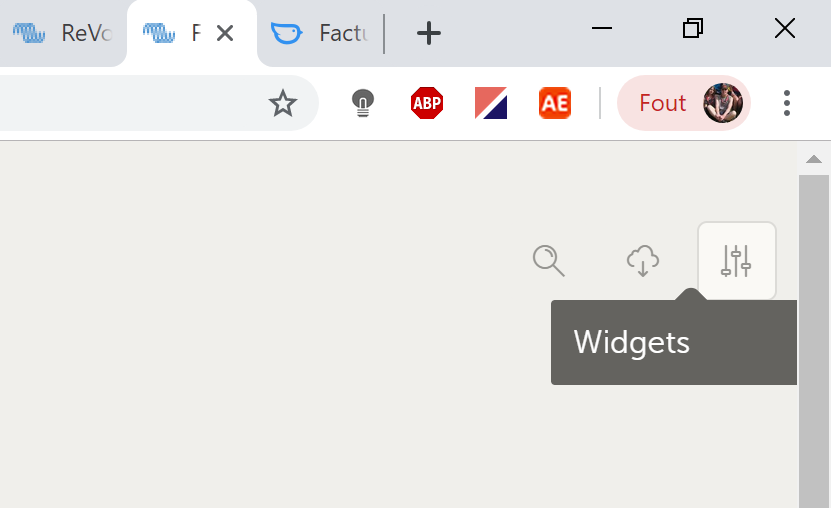
Click the 'widgets' button to select what you want to see:

0 Likes 0 ·
JohnC avatar image JohnC ♦ Daniël Boekel (Victron Energy Staff) ♦♦ commented ·

Widgets come down as they always have. I surely see the new & improved menu of em, but how do I arrange em? Like Matthijs did? This is what I see, can scroll down for more, but how to arrange? Err, yeh, a poor coupla solar days there for the observant.. :)

0 Likes 0 ·
1559839473990.png (120.8 KiB)
Daniël Boekel (Victron Energy Staff) avatar image Daniël Boekel (Victron Energy Staff) ♦♦ JohnC ♦ commented ·

Ah... hover your mouse pointer anywhere on the top bar of a widget for moving. (you get a 'cross' arrow), and on the side of a widget for resizing.

0 Likes 0 ·
JohnC avatar image JohnC ♦ Daniël Boekel (Victron Energy Staff) ♦♦ commented ·

No luck. Maybe it's my Firefox browser. Way too late here now, I'll try tomorrow. Thanks.

0 Likes 0 ·
JohnC avatar image JohnC ♦ JohnC ♦ commented ·

Partial success. In FF when I 'Enable Sidebar' I get it, but the Victron sidebar is gone, replaced with an FF one. Delete that and it all reverts to a mix of screen widgets of varying size, none with the little triangle.

In Microsoft Edge, I can get it for just a few seconds when I open/close 'Add Notes', but then reverts to full size, again no triangles.

So it's possibly a browser issue, in settings or even compatibility. Win10, and both those browsers are common. Can any browser expert expound?

0 Likes 0 ·
Daniël Boekel (Victron Energy Staff) avatar image Daniël Boekel (Victron Energy Staff) ♦♦ JohnC ♦ commented ·

Hmmm good catch, here I have to zoom in very far, once only one widget fits on the screen the triangle disappears.

Can you make a screenshot without the triangles? and tell what version of the browsers and what screen resolution you're using?

If you zoom-out, do they appear?

0 Likes 0 ·
JohnC avatar image JohnC ♦ Daniël Boekel (Victron Energy Staff) ♦♦ commented ·

Ahaah. Zooming out fixed the issue with both browsers. I *never* zoom my browsers, and even had to look up how to do it. (Ctrl & mouse scroll).

Maybe this can be 'fixed' at the VRM end for we Dumbo's?

You're a genius, thank you.

0 Likes 0 ·
mvader (Victron Energy) avatar image mvader (Victron Energy) ♦♦ JohnC ♦ commented ·

@JohnC, check what zoom you're using in your browser. At your resolution; it should work fine on 100% zoom I'd think, right @thlassche?


I'm not so sure if we should make a fix for people that accidentally zoomed in beyond the default 100%.


Up to @thlassche


0 Likes 0 ·
JohnC avatar image JohnC ♦ mvader (Victron Energy) ♦♦ commented ·

Both FF and ME work below 100%, Don't work @ 100%. And above 100% they both work but the Victron sidebar goes missing..

@mvader (Victron Energy Staff)

0 Likes 0 ·
suttridge avatar image suttridge JohnC ♦ commented ·

Hi All,

Just another thing - on latest Chrome browser, as well as Gnome browser (which uses WebKit, I think), the graphs in the advanced display do NOT get updated. The little status thing changes from "Last updated a few seconds ago" to "Last updated a minute ago" and then back to "Last updated a few seconds ago", so it looks like some of the page elements are working OK, but the graphs stay still. Have to refresh the whole page to get new information into the graphs. This used to work fine before.

Regards, Steve.

0 Likes 0 ·
randy-h avatar image randy-h suttridge commented ·

I have the same issue as suttridge with graphs not updating without a manual page refresh. I run VRM Portal on a Windows 8.1 tablet with Chrome Web Browser. This tablet is dedicated to the VRM Portal and is used as a constant display. Having to manually refresh the page is kind of bad for me. Is this a Chrome issue? A personal settings Issue? Something I can change to fix it?

0 Likes 0 ·
randy-h avatar image randy-h randy-h commented ·

Scratch my post above, its now refreshing on its own. Sorry for the false concern.

0 Likes 0 ·
Teun Lassche avatar image Teun Lassche ♦ suttridge commented ·

@suttridge The refreshing of the page should be fixed

0 Likes 0 ·
suttridge avatar image suttridge Teun Lassche ♦ commented ·

I would have to say the refreshing of the graphs is **almost** fixed. (b.t.w. my installations are set to upload to VRM every minute from the Venus devices).

It works fine when you first load the advanced page. If you change the time period, say from "every hour" to "every 3 hours", then the refreshing stops. Every time you change the time period, you have to do a full page refresh to get the refreshing of the individual graphs working again.

0 Likes 0 ·
suttridge avatar image suttridge Teun Lassche ♦ commented ·

Further update on this : after staring at screens for a long time, I get the following :-

Selecting time periods last hour, last 3 hours, last 6 hours, last 12 hours, the graphs update automatically every minute (as long as you have done a full page refresh after changing the time period).

For the time period last 24 hours, the graphs never refresh any more - you have to do manual full page refresh again to see any updates, and they still do not update automatically after that.


0 Likes 0 ·
Show more comments
Teun Lassche avatar image Teun Lassche ♦ mvader (Victron Energy) ♦♦ commented ·
0 Likes 0 ·
Michael Bell avatar image Michael Bell Daniël Boekel (Victron Energy Staff) ♦♦ commented ·

When I go to the ADVANCED page for my installation, I cannot see a Widgets selector. How can I make the Widgets selector visible?

Thanks - Michael.

0 Likes 0 ·
Guy Stewart (Victron Community Manager) avatar image Guy Stewart (Victron Community Manager) ♦♦ Michael Bell commented ·

Hi Michael,

If you can't see the widgets selector, it is mostly likely because you have monitoring access, but not full control of the site.

Please contact your installer and they can either enable the widgets for you, or increase your access level.

This is done in

VRM -> Settings -> Users menu.


0 Likes 0 ·
Dave van Dongen avatar image
Dave van Dongen answered ·

Great, thanks! For me, the advanced monitoring options is a great added value of Victron over other brands.

2 |3000

Up to 8 attachments (including images) can be used with a maximum of 190.8 MiB each and 286.6 MiB total.

Ari Kesti avatar image
Ari Kesti answered ·

I would like to have a widget that counts a summary of amount of energy produced today, yesterday. I can see it by selecting produced last 7 days but that is a little cumbersome. Or a number below the Pv charger current production on the CCGX display.

1 comment
2 |3000

Up to 8 attachments (including images) can be used with a maximum of 190.8 MiB each and 286.6 MiB total.

Trung avatar image Trung commented ·

Hi Arke..

I would agree...this is a key information - perhaps Solar Yield (KWh) for every hour would be great, a cumulative for the day and for any given range of dates. At the moment, the Advance setting only have Solar Charge Summary which is transmitted at 5pm and shows the Total Yield for Yesterday and also Yield for Today as of 5pm only - this is not very useful as the solar panels are still producing energy??? Why not send it every hour !!!????

I am looking through some of the comments to see if I am missing anything but, I dont think I have.

I have a Lorawan unit connected to the VRM and this important information is not available at the moment ..and I dont know why it is not there??

0 Likes 0 ·
farmeroz avatar image
farmeroz answered ·

I am having trouble getting this, which is odd.

I can do advanced and generate my own widgets (great stuff).

Windows 11 PC. Ample memory and screensize.

1) The 'maximise screen' reverts to small after perhaps 30 secs (annoying).

2) There are widgets on 'advanced' I cannot delete.

3) It would be nice to have a "User" (ie 'advanced-2') completely under the control of the user (ie no undeletable defaults).

4) Its pretty clearly Home assistant which is excellent and to be commended. Decades ago I used commodore '64's as process controllers/front ends in quite complex environments but the raspi would have been SO much easier.

2 |3000

Up to 8 attachments (including images) can be used with a maximum of 190.8 MiB each and 286.6 MiB total.