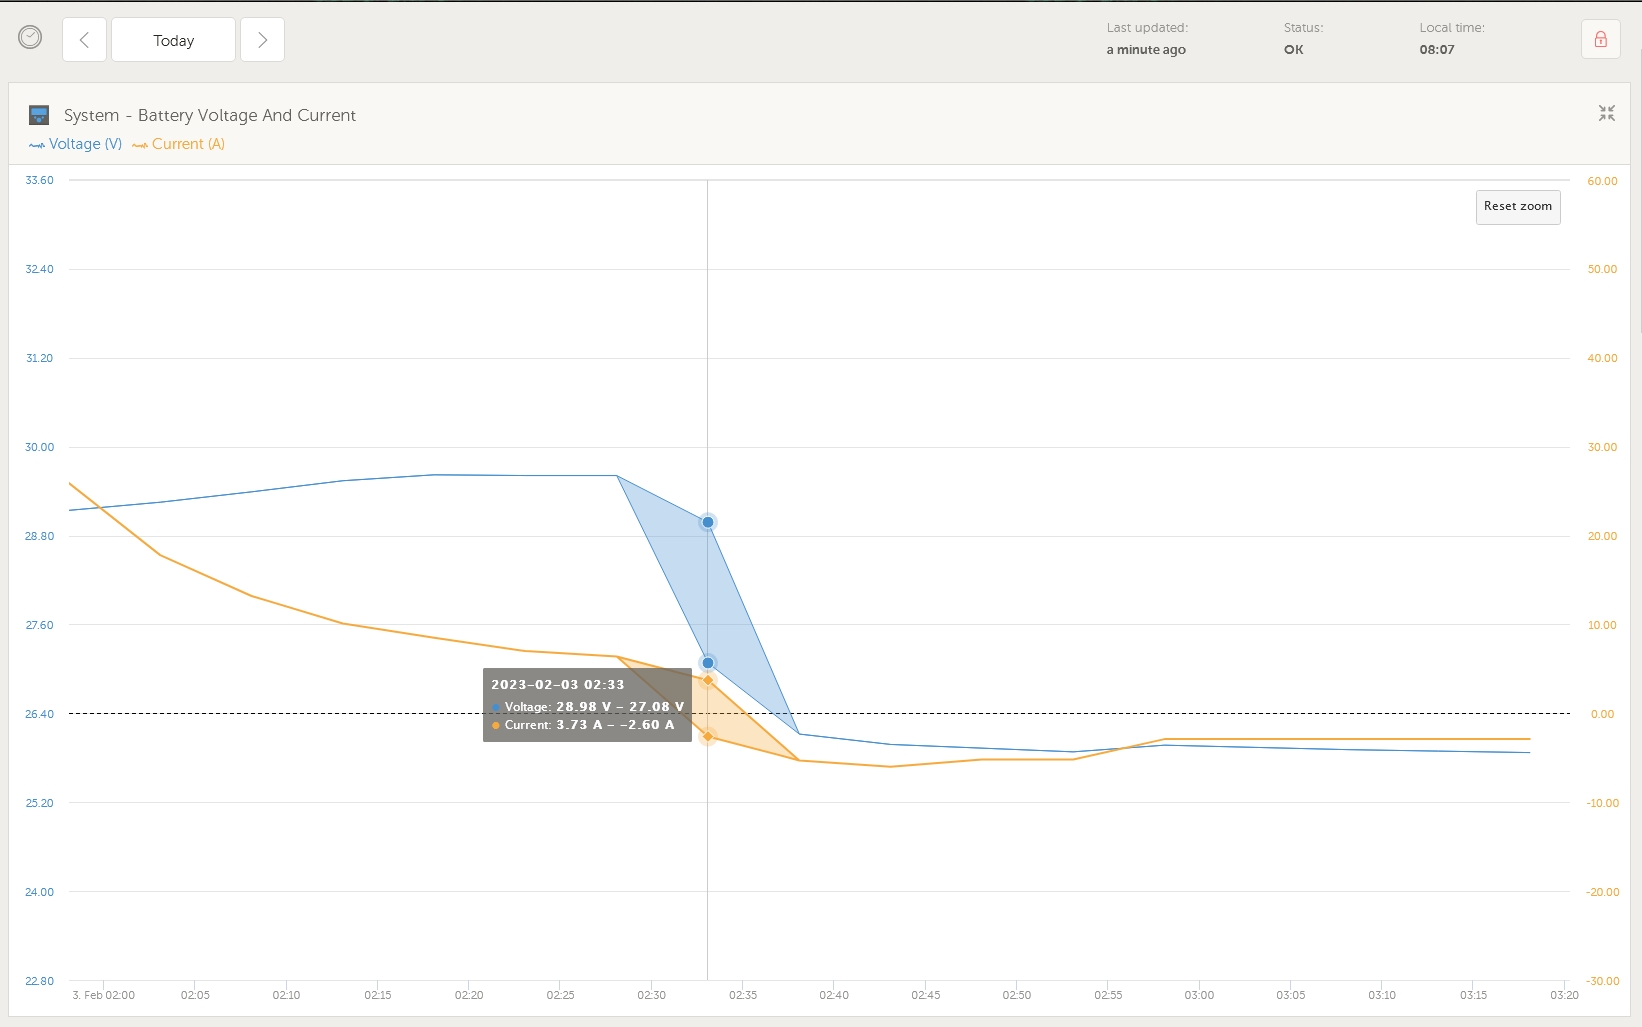
Something I've not seen until this morning on a VRM graph. i always understood the plotting to either be an average or snap-shot at the plotting time... however I noticed that there are two plots (for the same time) on one of the graphs this morning (see below).
Why are there two plots with a shaded area?

