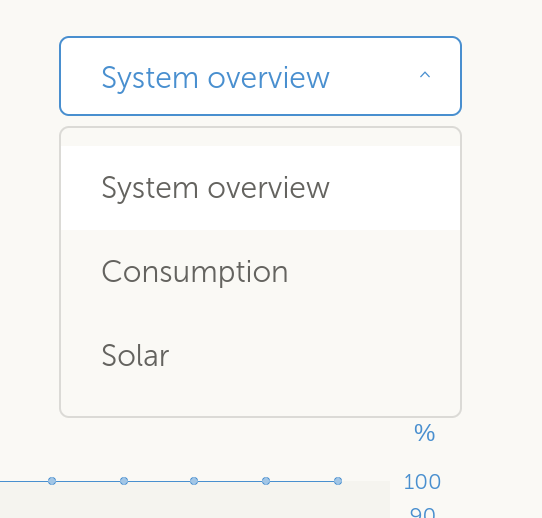
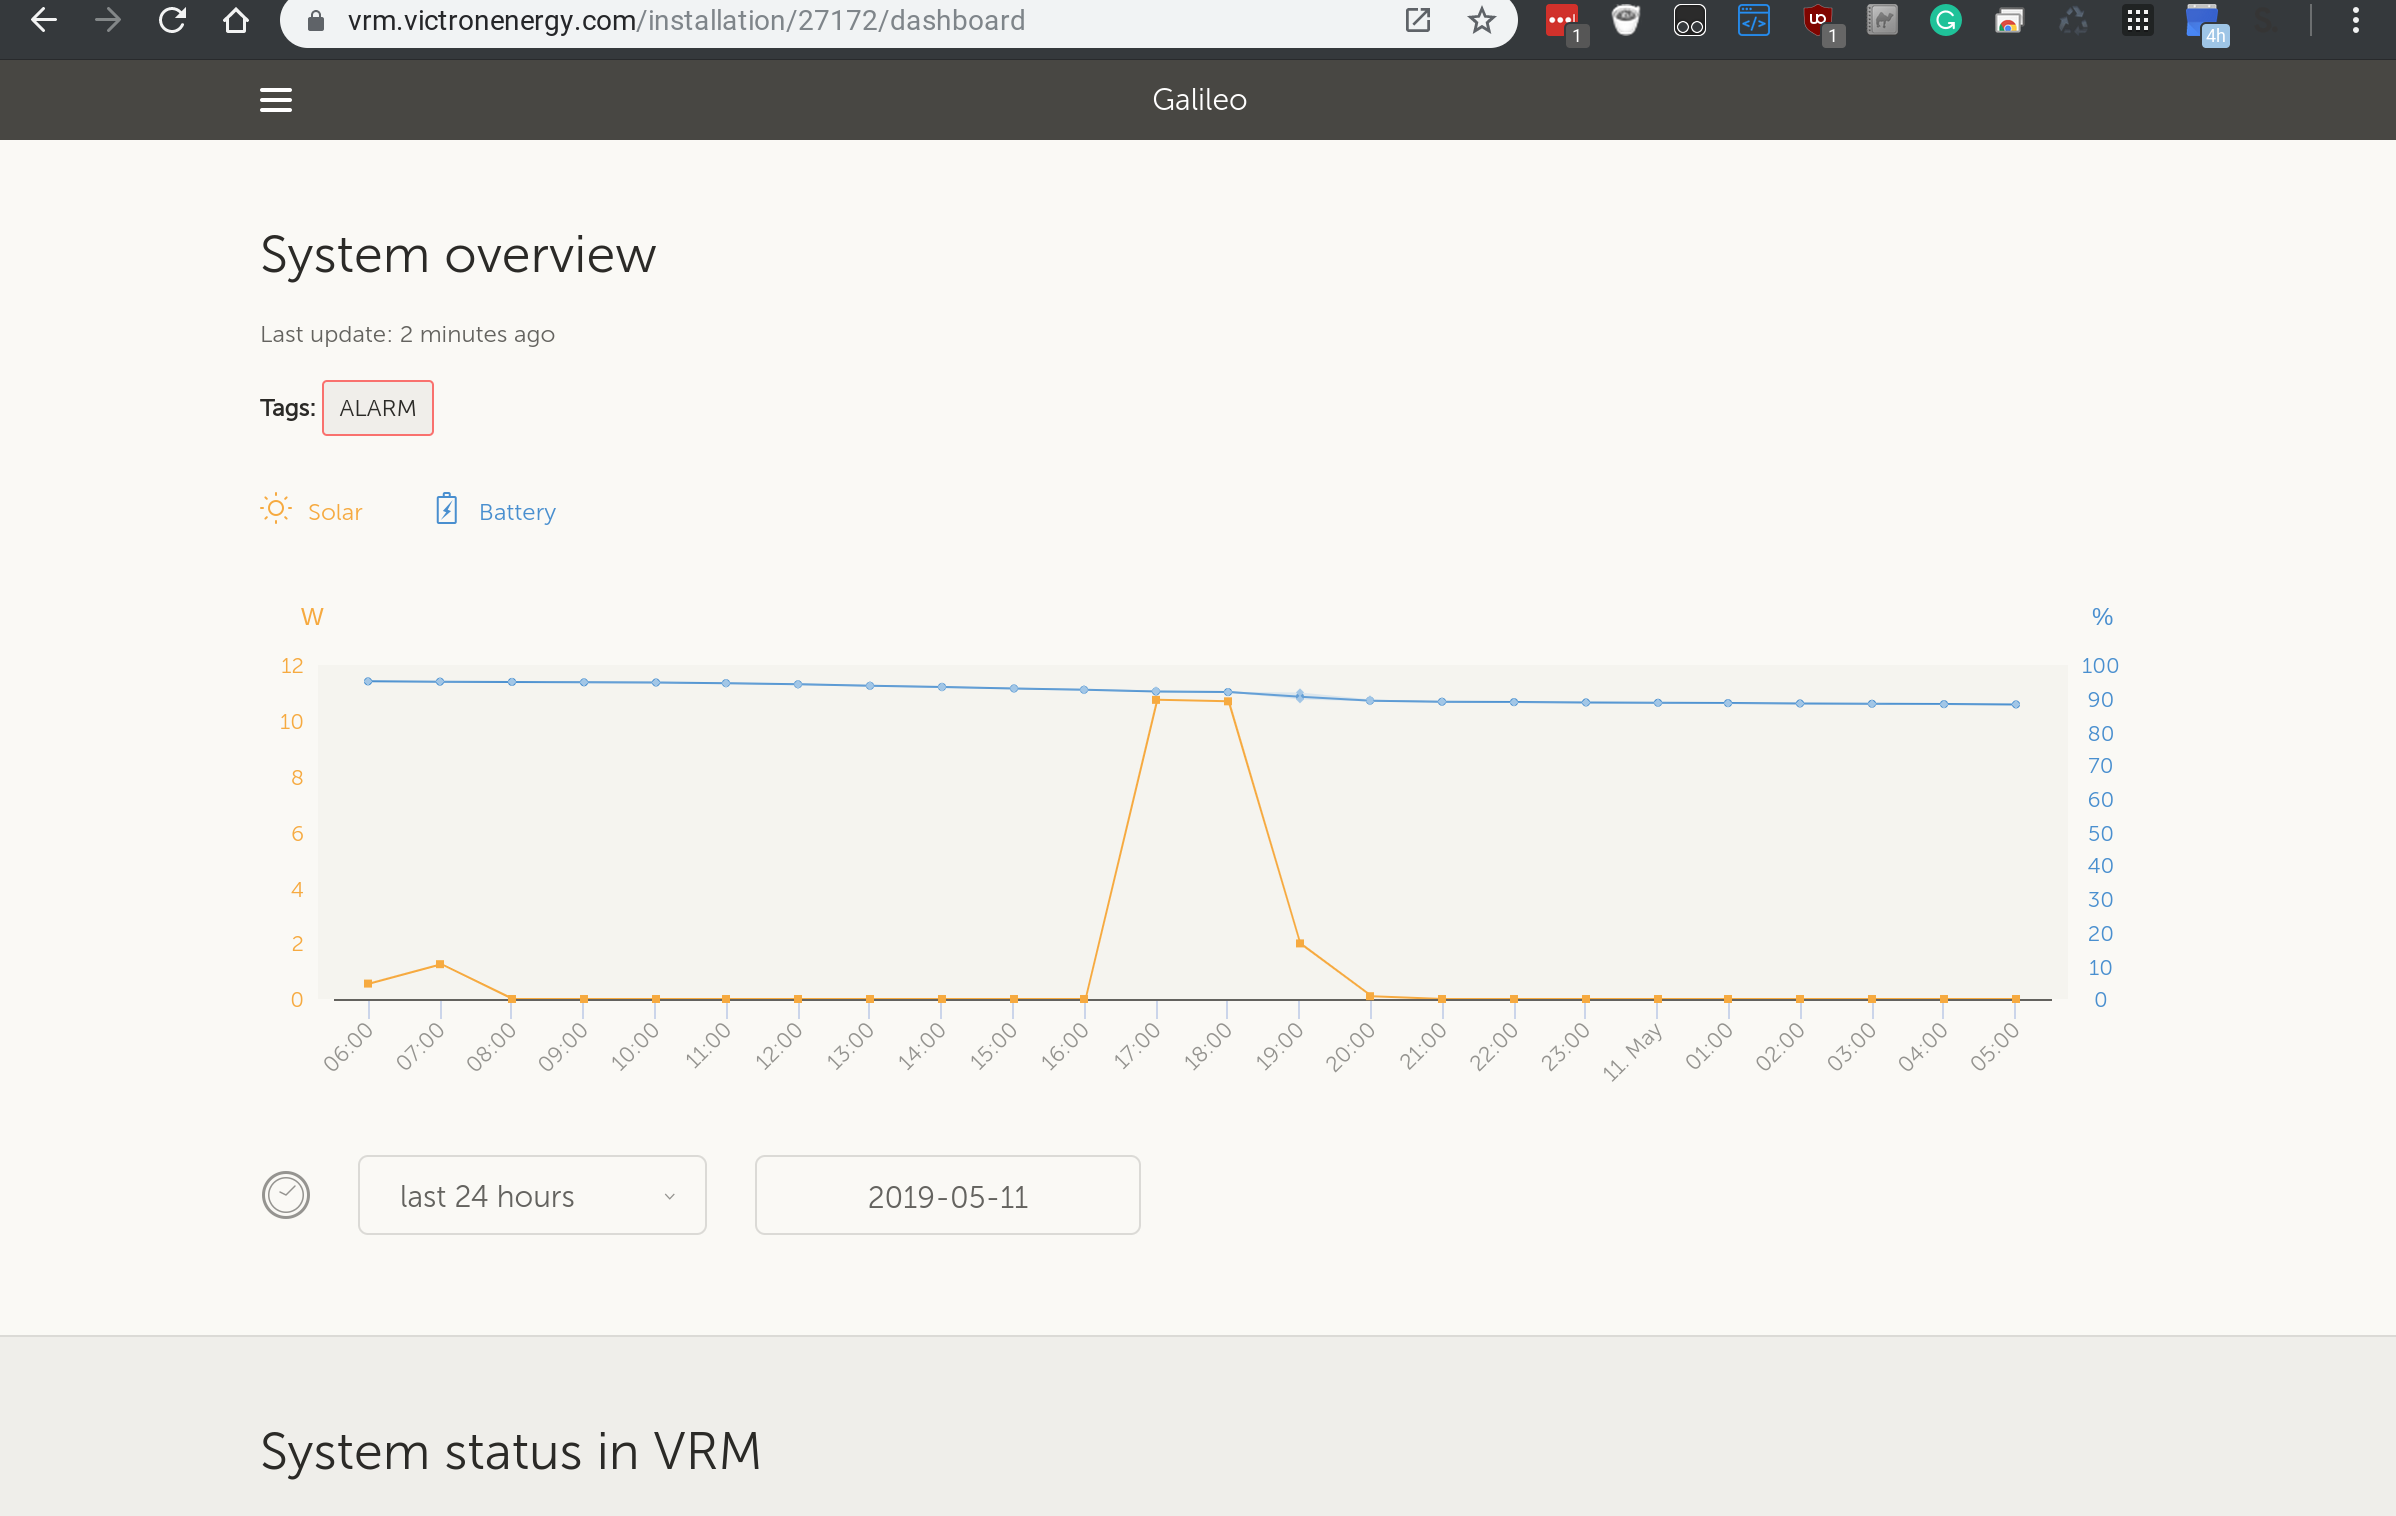
The graph selector on the dashboard disappears after the page has loaded and is not visible, and I can only see the system overview. What determines when this selector shows?
Thanks

This site is now in read-only archive mode. Please move all discussion, and create a new account at the new Victron Community site.
The graph selector on the dashboard disappears after the page has loaded and is not visible, and I can only see the system overview. What determines when this selector shows?
Thanks

I meet all of these requirements:
Can you please post a screen shot of the page with the selector missing?
Also you browser and version number.
I cannot reproduce this issue. The selector is always visible for me in safari on the dashboard, even if I resize the window to very small.
ChromeOS Version 75.0.3770.24 (Official Build) beta (64-bit)

My venus version is v2.23
Multi with 27 series hardware 2702 is the Prod ID and 430 is the firmware version
...Has DC System...
If this feature is enabled, and the used battery monitor is a BMV 700 or 712, then the minimum required BMV firmware version to make the VRM Energy dashboards operate correctly is v3.08.
The calculated value for 'DC Power' is not used in any way by the GX, beyond just being displayed 'on screen'. In particular it is not logged on the VRM portal and it is not included in system calculation and it does not appear as part of the recorded Solar Yield.
My BMV 712 firmware version is v4.01. I don't see any other req's that I don't meet that would cause the selector to not display.
A system with multiple mppts, even a mix of VE.Can and VE.Direct, is supported: the algorithm will totalize all the counters - as long as they are all actively monitored.
Multiple AC current sensors measuring multiple PV inverters is supported as well.
These overviews work correctly when Victron Solar Chargers are used. When one or more non-Victron solar chargers are used, the system cannot read their Energy yields, and because of that the resulting overviews are incorrect and unreliable.
The VGR, VGR2 and VER do not provide any energy data data.
Combining MPPT Solar Chargers and PV Inverters in a system is supported.
Note that the same data used to show these energy graphs is also available as a download. See the Advanced tab on VRM, and then the download icon on the top right.
Hi.
I have exactly the same problem. ( screenshots are virtually same ) When the screen is loading you can see the dropdown very briefly but then disappears.
I'm very new user so I am not sure what i'm missing. I have a Venus GX (2.33), Quattro 24/5000 ( 413 , 2648 ), BMV 712 and SmartSolar Charger MPPT 100/20 ( 1.46 )
My Dashboard Overview shows both Battery and Solar as line graphs with no bar chart consumption, on Demo's you generally see Battery as line chart and consumption and solar yield as a bar graph.
Am I missing something in configuration or misunderstanding the requirements ?
Thanks
Phil.
Hi Phil. This could be simply a browser issue. Can you update it, or try another to check?
Teun (VRM development) has asked for browser issues to be reported, but please be very specific.
9 People are following this question.