Hello,
According to the „Last 24h/7d/30d“ diagrams in the VRM portal, someone could assume, that I use a lot of grid power. In fact, the meter of my grid company shows me a total consumption of only 4kWh(!) for the last full month (last 30 days).

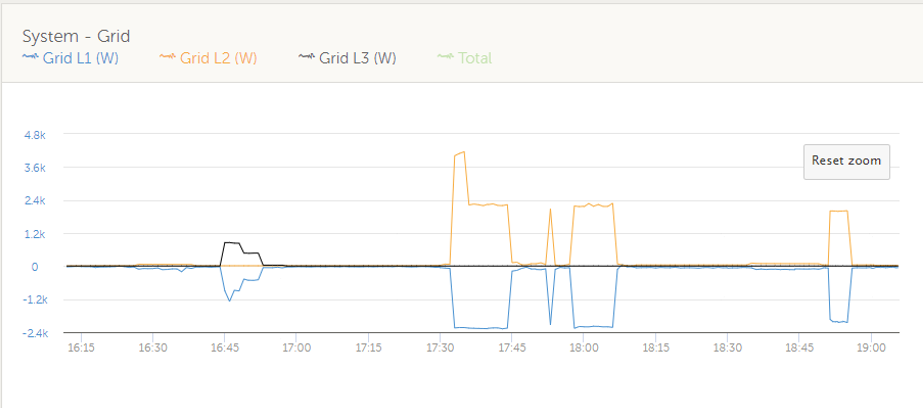
Ok, it is true that a lot of power comes from one grid phase but that is nearly 100% compensated by the battery power on the other phase. I’m running a 1-phase ESS system with activated phase compensation. And exactly that is unfortunately not considered when calculating the above VRM diagrams and charts.
A test with my dishwasher (17:30 to 18:30) on phase L2 shows that nearly everything is compensated by the Multiplus 24/3000 on L1 (from battery).

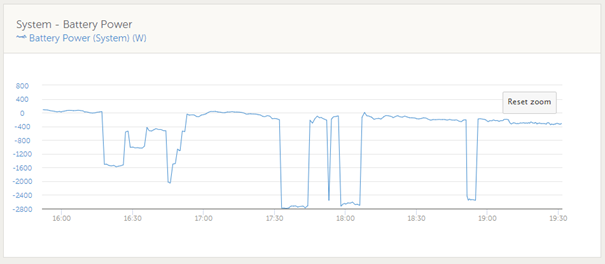
Battery power (discharge) at the same time period

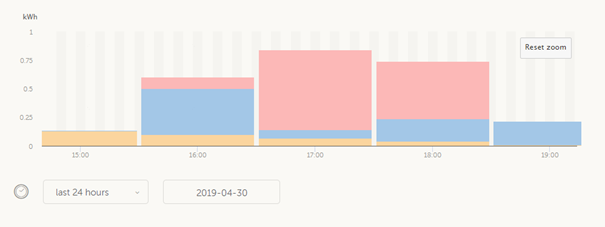
Consumption tab at the same time period
Here comes my issue - you can now see a lot of grid power usage, but in my opinion there should be nearly everything blue (battery usage).

For me, the above diagrams are quite worthless and it would be fine to have some VRM settings to change the behavior of the consumption calculations with activated phase compensation.
Any ideas how to improve this?
Best regards
Rainer
