question

drizzt321 avatar image
drizzt321 asked

Is VenusOS right for my offline data monitoring use-case?

So my use-case is a small travel trailer (caravan) that I'm going out part-time, although next spring I hope to do a lot of traveling and mostly live out of it for a few months. I've got a SmartSolar MPPT, OrionTr DC-DC, and BlueSmart 110v charger, BMV-712 monitor. Everything works great so far, except for me being able to see historical trends/usages. As in minute-by-minute (or at least hour-by-hour) how much solar I'm getting in, how much power I'm actually using, etc.

I initially thought VenusOS via VE.Direct from the SmartSolar & BMV-712 would be what I wanted, got it on a RPi, hooked it up temporarily, but I've since realized it doesn't seem to have that level of logging/viewing of data that I want. Is that correct? Should I instead just hook up VE.Direct and plain old Linux with my own recording stuff using a library such as https://github.com/karioja/vedirect or just implement directly from the docs from https://www.victronenergy.com/live/vedirect_protocol:faq? Or is there a part of VenusOS that will do what I'd actually like?

Venus OS
2 |3000

Up to 8 attachments (including images) can be used with a maximum of 190.8 MiB each and 286.6 MiB total.

5 Answers
steffen-graap avatar image
steffen-graap answered ·

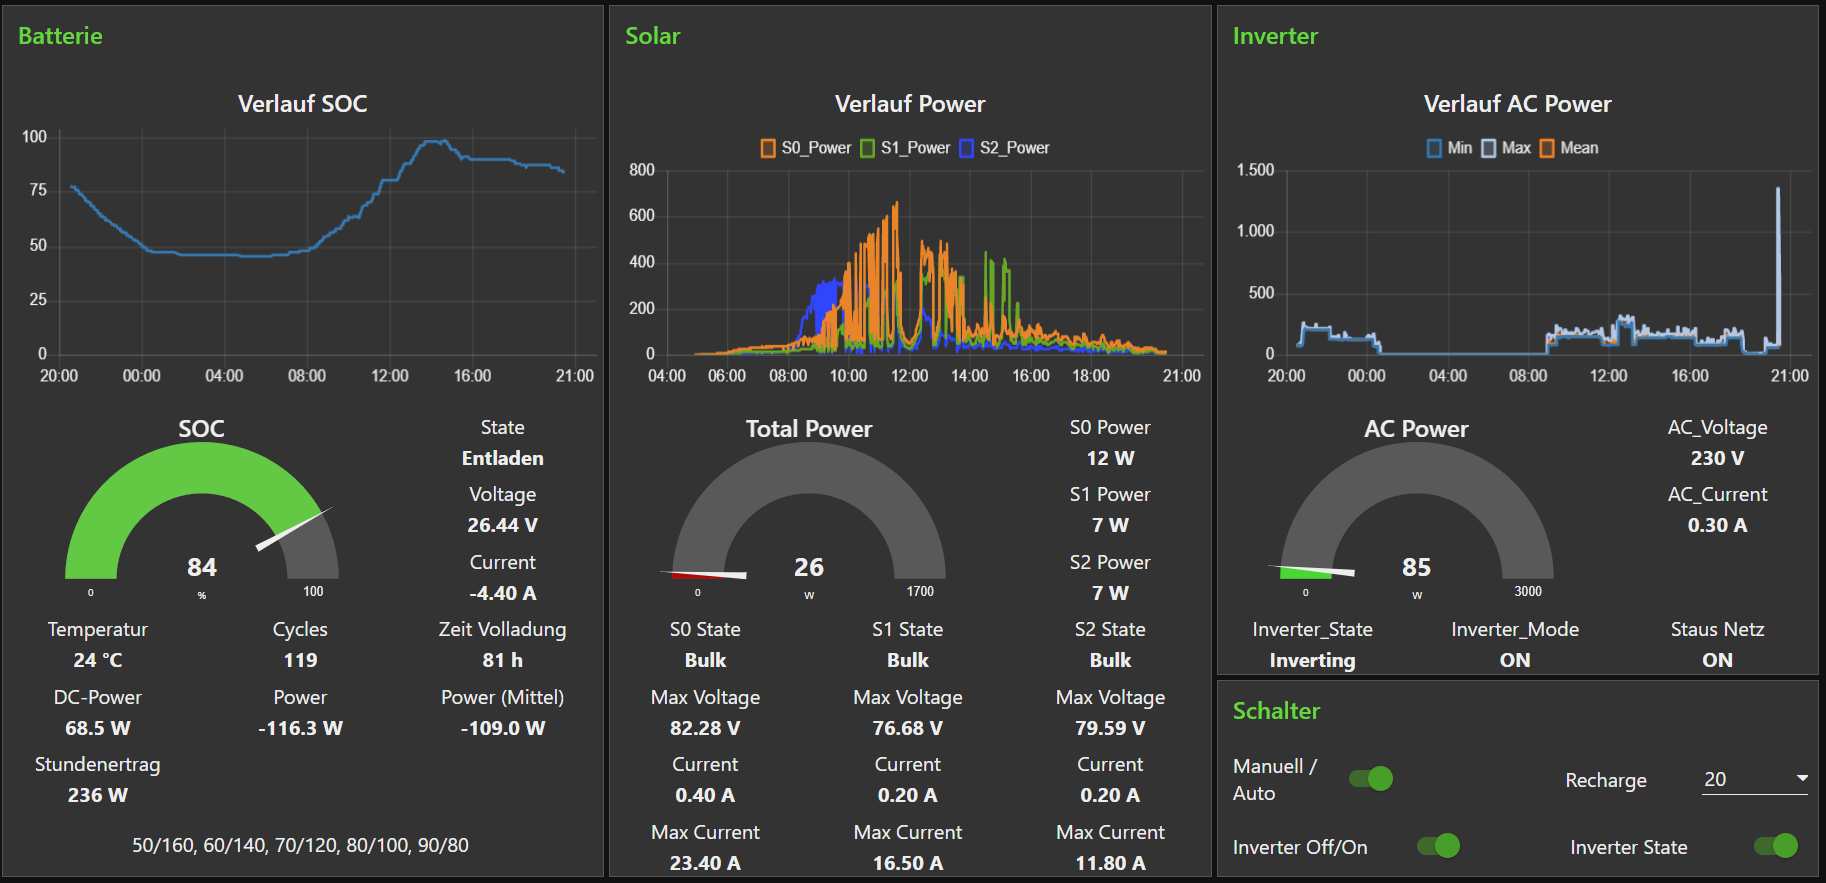
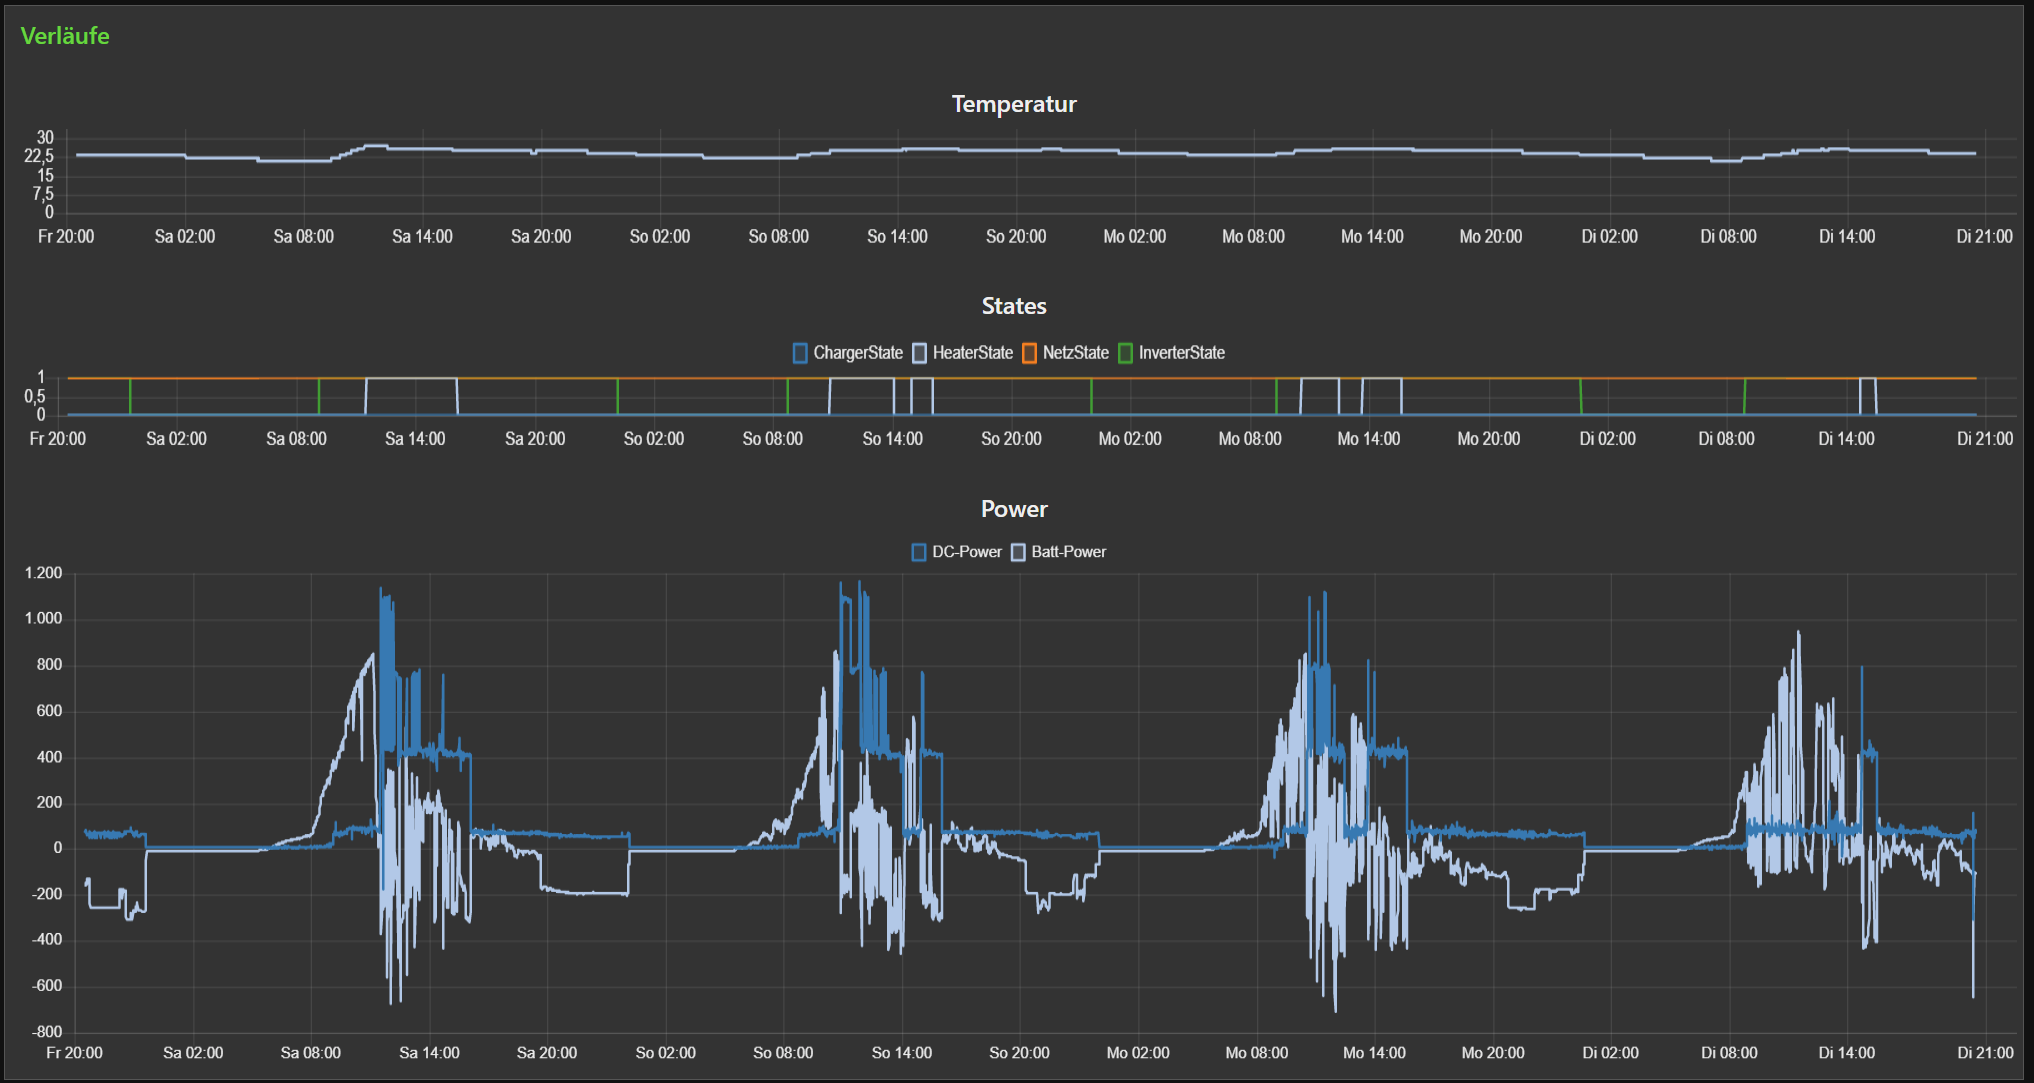
Just use the VenusOS Large Image. Included in this is a NodeRed where you can then record and display anything as you see fit.

Alternatively, you can set up VRM access in VenusOS. This allows you to view the data in the VRM portal. However, this requires an internet connection.

Attached are two of my NodeRed roof boards.1657045986598.png

1657045922794.png


1657045922794.png (200.9 KiB)
1657045986598.png (168.6 KiB)
2 |3000

Up to 8 attachments (including images) can be used with a maximum of 190.8 MiB each and 286.6 MiB total.

drizzt321 avatar image
drizzt321 answered ·

@Steffen Graap Cool, might try that then. Although I don't intend to really hook this up to the Internet, as I'm not really going to be having access full-time at this time. Maybe Starlink next spring, perhaps.

As for the Node-Red views you have, how'd you do those? I've used it a lot via my Home-Assistant setup at home, but to the best of my knowledge it doesn't have built-in graphing stuffs, unless I'm missing something. Or there's VenusOS/Victron extensions/modules that does all that sort of thing (once setup) that enables it. Tips/tricks/examples would be most helpful!

2 |3000

Up to 8 attachments (including images) can be used with a maximum of 190.8 MiB each and 286.6 MiB total.

southsideph avatar image
southsideph answered ·

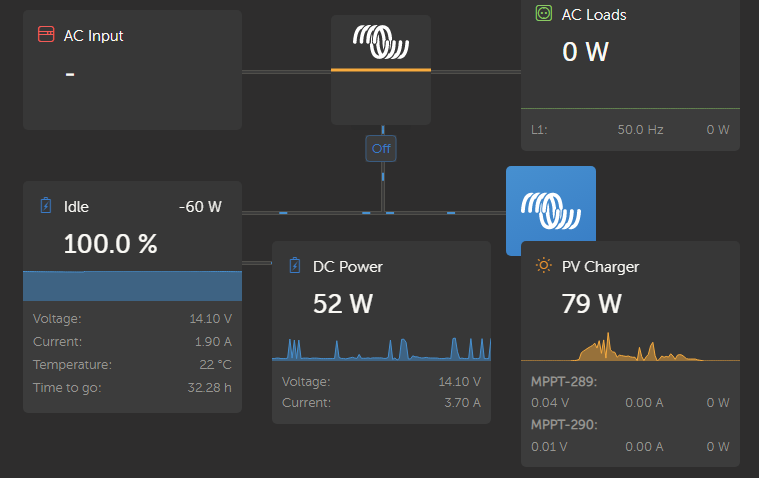
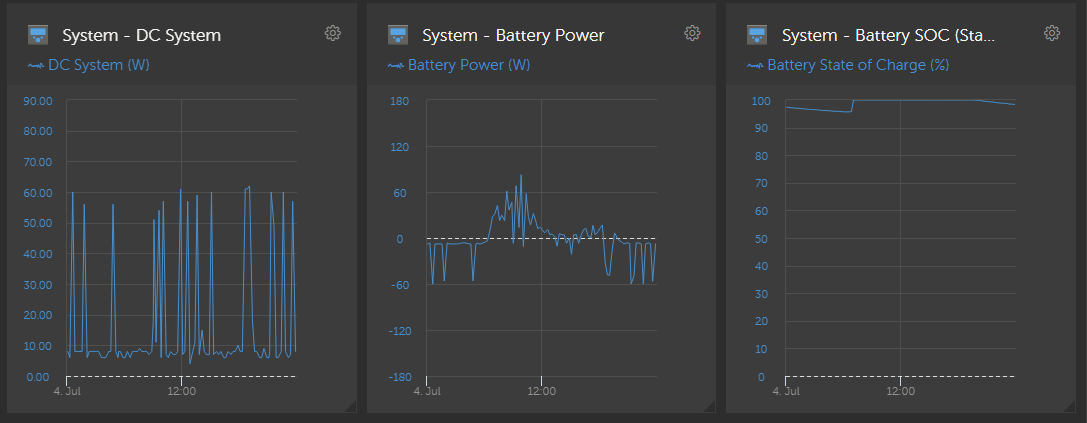
I use PI running Venus OS in the camper, 2 x MPPT, 1 x BMV712 , Multiplus. Also included in the Camper is WIFI Mobile access point which Pi is connected to VRM . From that I get all the Reports from all the devices and GX dashboard and can connect vi remote console. I can't comment on Node Red have tried unsuccessfully to get it to work but for me it is overkill - VRM is just fine.

1657064901383.png


1657064948961.png


1657064901383.png (43.9 KiB)
1657064948961.png (52.6 KiB)
2 |3000

Up to 8 attachments (including images) can be used with a maximum of 190.8 MiB each and 286.6 MiB total.

Guy Stewart (Victron Community Manager) avatar image
Guy Stewart (Victron Community Manager) answered ·

Hi @Drizzt321,

Given you want an offline solution, check out these two videos that explain how to get started with Grafana and Venus -

https://www.youtube.com/watch?v=IkNuadRbANA

https://www.youtube.com/watch?v=B-sGH0etieM

For more info or help down this line, I would suggest you check out the Modifications section of this community and specifically the questions about Grafana

2 |3000

Up to 8 attachments (including images) can be used with a maximum of 190.8 MiB each and 286.6 MiB total.

steffen-graap avatar image
steffen-graap answered ·

Hi drizzt321,

In NodeRed you can install palettes. You'll find this in the top right, by the three lines, and then under "Manage palette".

One of these palettes is the dashboard. Simply click on the Install tab and then search for "node-red-dashboard" and install. You will then find the new Notes in your list on the left.

After you have installed and configured them in your flow, you will find a new tab called "Dashboard" in the upper right corner below the three lines. Click here, in the view you can position, resize and organize your dashboard elements on different display pages. Then press the symbol with the arrow at the top right of the tab. This will open a new page in the browser with your dashboard.

You can find countless tutorial videos for NodeRed on YouTube. A video from a forum member helped me a lot. This explains how to set up the whole NodeRed so that you can retrieve the GX data, but it is in German.

https://www.youtube.com/watch?v=qSD8YBpJJwc&t=10s

2 |3000

Up to 8 attachments (including images) can be used with a maximum of 190.8 MiB each and 286.6 MiB total.

Related Resources