question

w8dev avatar image
w8dev asked

VRM not updating in realtime

Anyone else experiencing the VRM portal not updating in realtime? The "last updated" states that it's realtime, and I know my solar production voltage and amperage isn't continuous. I've restarted my raspberry pi which sends data to the VRM and that didn't make any difference. When I look at the browser inspector, there seems to be quite a few errors showing up.
- No dbusServiceType property set on subscription object

- You have included the Google Maps JavaScript API multiple times on this page. This may cause unexpected errors.

- dashboard:1 Uncaught (in promise)

- TypeError: Cannot read properties of undefined (reading 'hasOwnProperty')


Just wonder if anyone else is experiencing the same issue.

If I look at the remote console on my local network, it's updating in realtime.

Thanks,

Adam


VRM
1 comment
2 |3000

Up to 8 attachments (including images) can be used with a maximum of 190.8 MiB each and 286.6 MiB total.

mio23 avatar image mio23 commented ·

Enable two-way ;-)


0 Likes 0 ·
11 Answers
baxter avatar image
baxter answered ·

Same issue here, since yesterday in the afternoon realtime update is not longer working


https://community.victronenergy.com/questions/142997/vrm-portal-realtime-dashboard-not-longer-working.html

2 |3000

Up to 8 attachments (including images) can be used with a maximum of 190.8 MiB each and 286.6 MiB total.

aldo avatar image
aldo answered ·

I have seen several posts on this topic but have not found the solution.

I recently replaced my Venux GX because it was giving me reading problems.

Now everything works fine but the online VRM is not updated in real time as before

I also tried updating the firmware to 2.9 but nothing changes.

2 |3000

Up to 8 attachments (including images) can be used with a maximum of 190.8 MiB each and 286.6 MiB total.

w8dev avatar image
w8dev answered ·

After timing the updates, with the browser left open, the data only seems to update every 60 secs or so.

2 |3000

Up to 8 attachments (including images) can be used with a maximum of 190.8 MiB each and 286.6 MiB total.

tmar13 avatar image
tmar13 answered ·

Hello

I think, it depends on server charge. it's never the same delay : sometimes, it works very well with update every second in the VRM portal.

I made a php program to interrogate the server and the data is updated every 15mn.

Thierry

2 |3000

Up to 8 attachments (including images) can be used with a maximum of 190.8 MiB each and 286.6 MiB total.

tmar13 avatar image
tmar13 answered ·

I found : there is a parameter in your Cerbo GX configuration :

Parameters ->VRM Portal->interval between records

2 |3000

Up to 8 attachments (including images) can be used with a maximum of 190.8 MiB each and 286.6 MiB total.

usernamepasswordbs avatar image
usernamepasswordbs answered ·

Same here. I have been through settings a dozen times in fact more than that, firmware is latest 2.92, rebooted many many times, bought the nano usb dongle to improve wifi, but no improvement no matter what I have done. I am starting to become disappointed with Victron products due to connection problems. Bluetooth, wifi you name it, it's non-stop connection issues or lack of live data.

My dashboard says it updated a minute ago or whatever but the figures haven't changed since yesterday. Sometimes if I restart it will work better but not necessarily and I can't just restart every 2 minutes.

I'm really surprised that in this day and age we can't get a simple reliable connection for high quality equipment when any old cheapo wifi device off ebay generally works fine.

13 comments
2 |3000

Up to 8 attachments (including images) can be used with a maximum of 190.8 MiB each and 286.6 MiB total.

usernamepasswordbs avatar image usernamepasswordbs commented ·
Sorry but more moans about connection and live data but this is a bizarre one; the VRM dashboard on my laptop gets stuck on a page from two days ago. I can restart everything and it will show meaningful data for a minute then jumps back to this fixed view from 2 days ago when I was using 7kw. It will say at the top that it was updated 1 minute ago or 2 minutes ago but it is not true. Anyone know what is wrong?
0 Likes 0 ·
JohnC avatar image JohnC ♦ usernamepasswordbs commented ·
Hi @usernamepasswordbs

Rest assured VRM doesn't store page views to torment you with at random. Might be time to flush out your lappy caches etc. What you want to see is the Realtime symbol on Dashboard, which may take a minute to arrive, but will show the truth. Also look to your Lan/Wan comms for something amiss. May even be like a dicky modem, clumsy addressing, etc. The issue is at your end. Even one of your ebay devices? :)

Try also typing "venus.local/app/" into a browser. This should bring up the Victron Marine MFD app, which is a condensed sort of version of Dashboard, but locally generated. If you can't get that up it's your networking comms at fault.


1 Like 1 ·
Show more comments
usernamepasswordbs avatar image
usernamepasswordbs answered ·

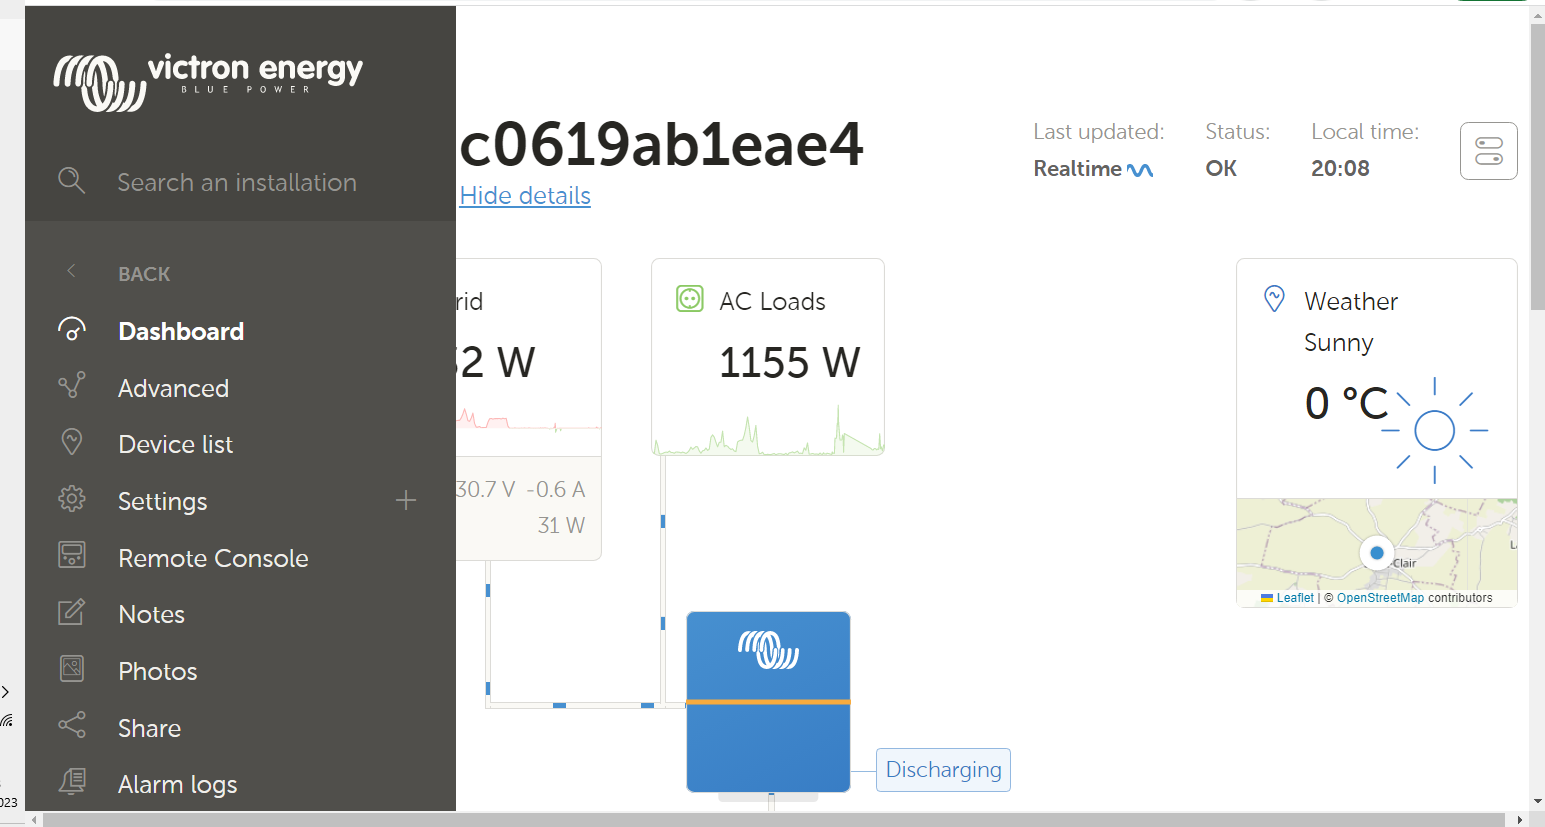
Hopefully you can see what I meanscreenshot-13.png

Like that


screenshot-13.png (158.7 KiB)
4 comments
2 |3000

Up to 8 attachments (including images) can be used with a maximum of 190.8 MiB each and 286.6 MiB total.

johnone avatar image johnone commented ·

That looks very likely to be a browser/css/javascript problem - on modern systems the left menu reduces to a 'hamburger' menu top right when screen width isn't sufficient.

Probably not solvable on your set-up - but if you supplied OS-and-version and browser-and-version info this could be confirmed.

Not terribly helpful I know but we can't expect Victron to provide functionality for *every* possible OS/ browser combo. You must surely be seeing weird layouts on other websites - that's how it works.

1 Like 1 ·
usernamepasswordbs avatar image usernamepasswordbs johnone commented ·

no other weird layouts that i can think of.

win10 home 21h2

chrome 109.0.5414.74.

pretty standard i would have thought.

0 Likes 0 ·
kevgermany avatar image kevgermany ♦♦ usernamepasswordbs commented ·
Thanks for the screenshot.

If you click on one of the options does the menu disappear when the other option comes up, or does it remain?

And if you click on the dashboard area, does that reduce the menu back to the hamburger state?


0 Likes 0 ·
usernamepasswordbs avatar image usernamepasswordbs kevgermany ♦♦ commented ·
The menu stays all the time.
0 Likes 0 ·
usernamepasswordbs avatar image
usernamepasswordbs answered ·

I have found that the remote console is fine with realtime but the dashboard is not. The VRM on my phone has the exact same problem, it gets stuck on the same "throwback" data as the dashboard on my computer.

Sometimes it says "installation is too busy".

2 |3000

Up to 8 attachments (including images) can be used with a maximum of 190.8 MiB each and 286.6 MiB total.

ralf-ct avatar image
ralf-ct answered ·

Interesting post! My Realtime Monitoring is on, I can connect to the Cerbo GX via Wi-Fi and to VRM via Internet,

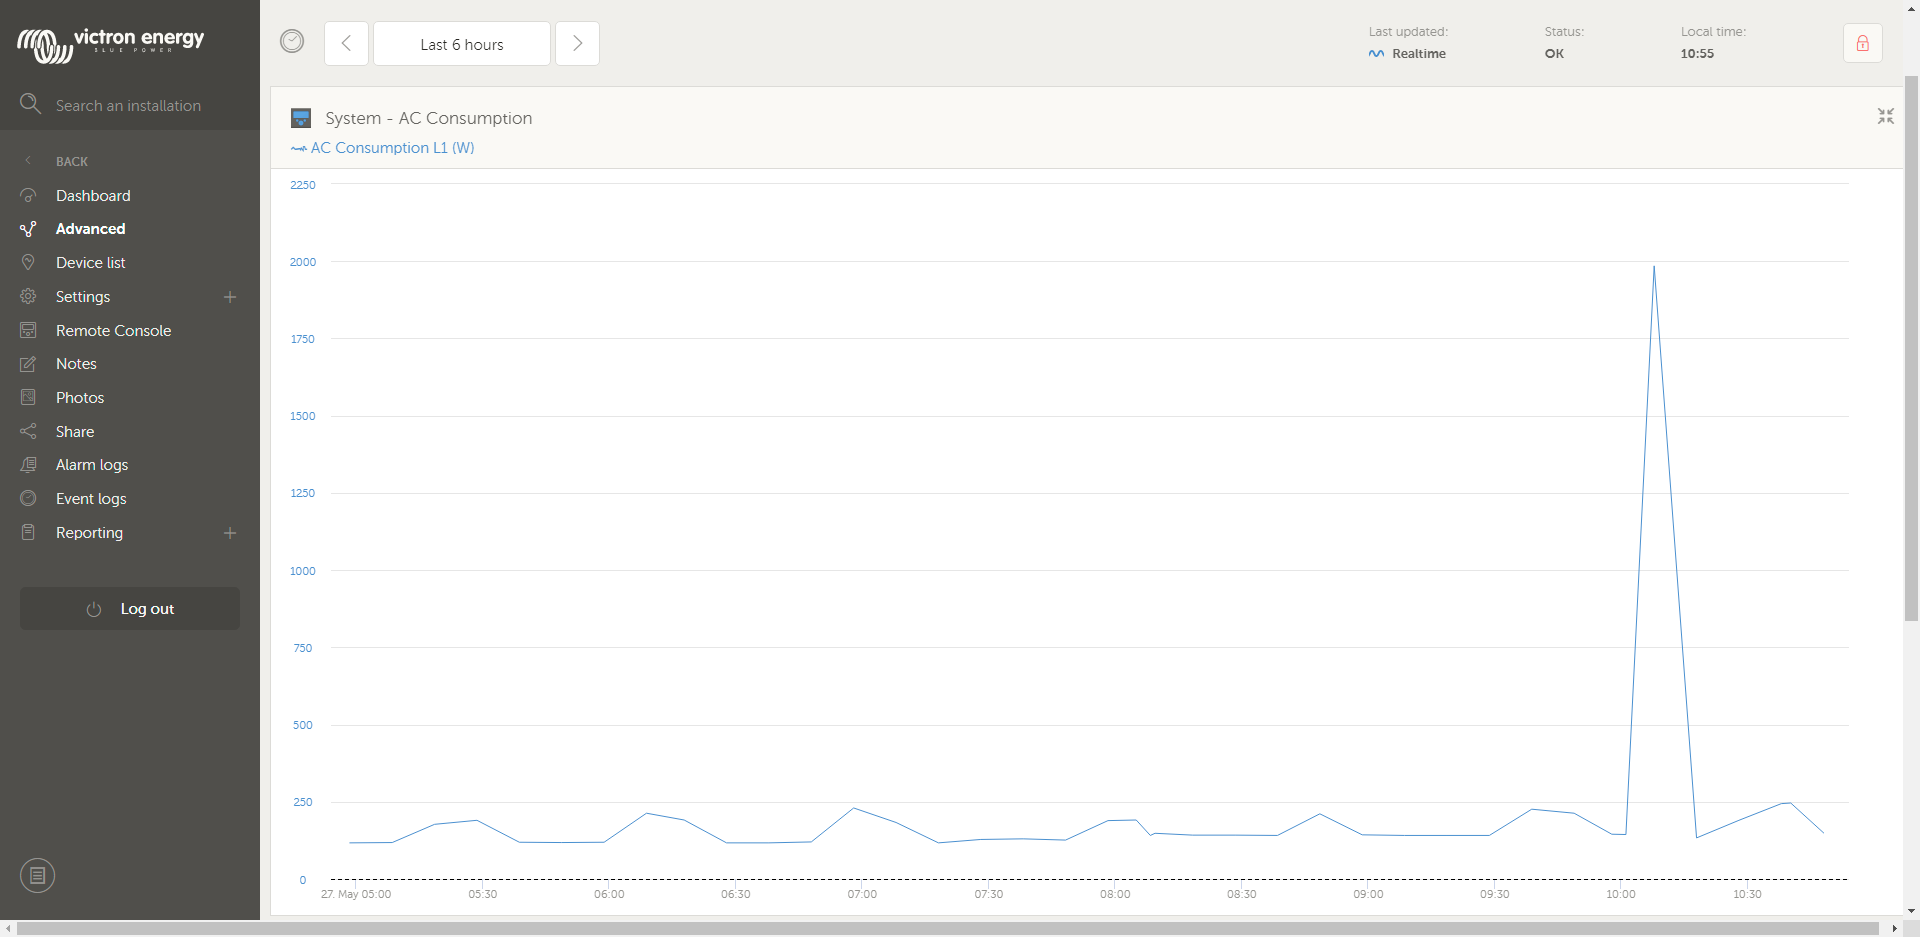
I can see my dashboard and the summary view, BUT, when I click on advanced and check, for example, System - AC Configuration, I'm not seeing logs of the kettle, microwave etc., while smaller draws like the fridge are shown. The heater on a separate circuit shows, but not the kettle if plugged in on that circuit. I thought it might be a cable, but it's the same with a different cable. I've wasted hours trying to find a solution.

8 comments
2 |3000

Up to 8 attachments (including images) can be used with a maximum of 190.8 MiB each and 286.6 MiB total.

kevgermany avatar image kevgermany ♦♦ commented ·
Please post a screen shot showing this.

What equipment is in your installation.


0 Likes 0 ·
ralf-ct avatar image ralf-ct kevgermany ♦♦ commented ·

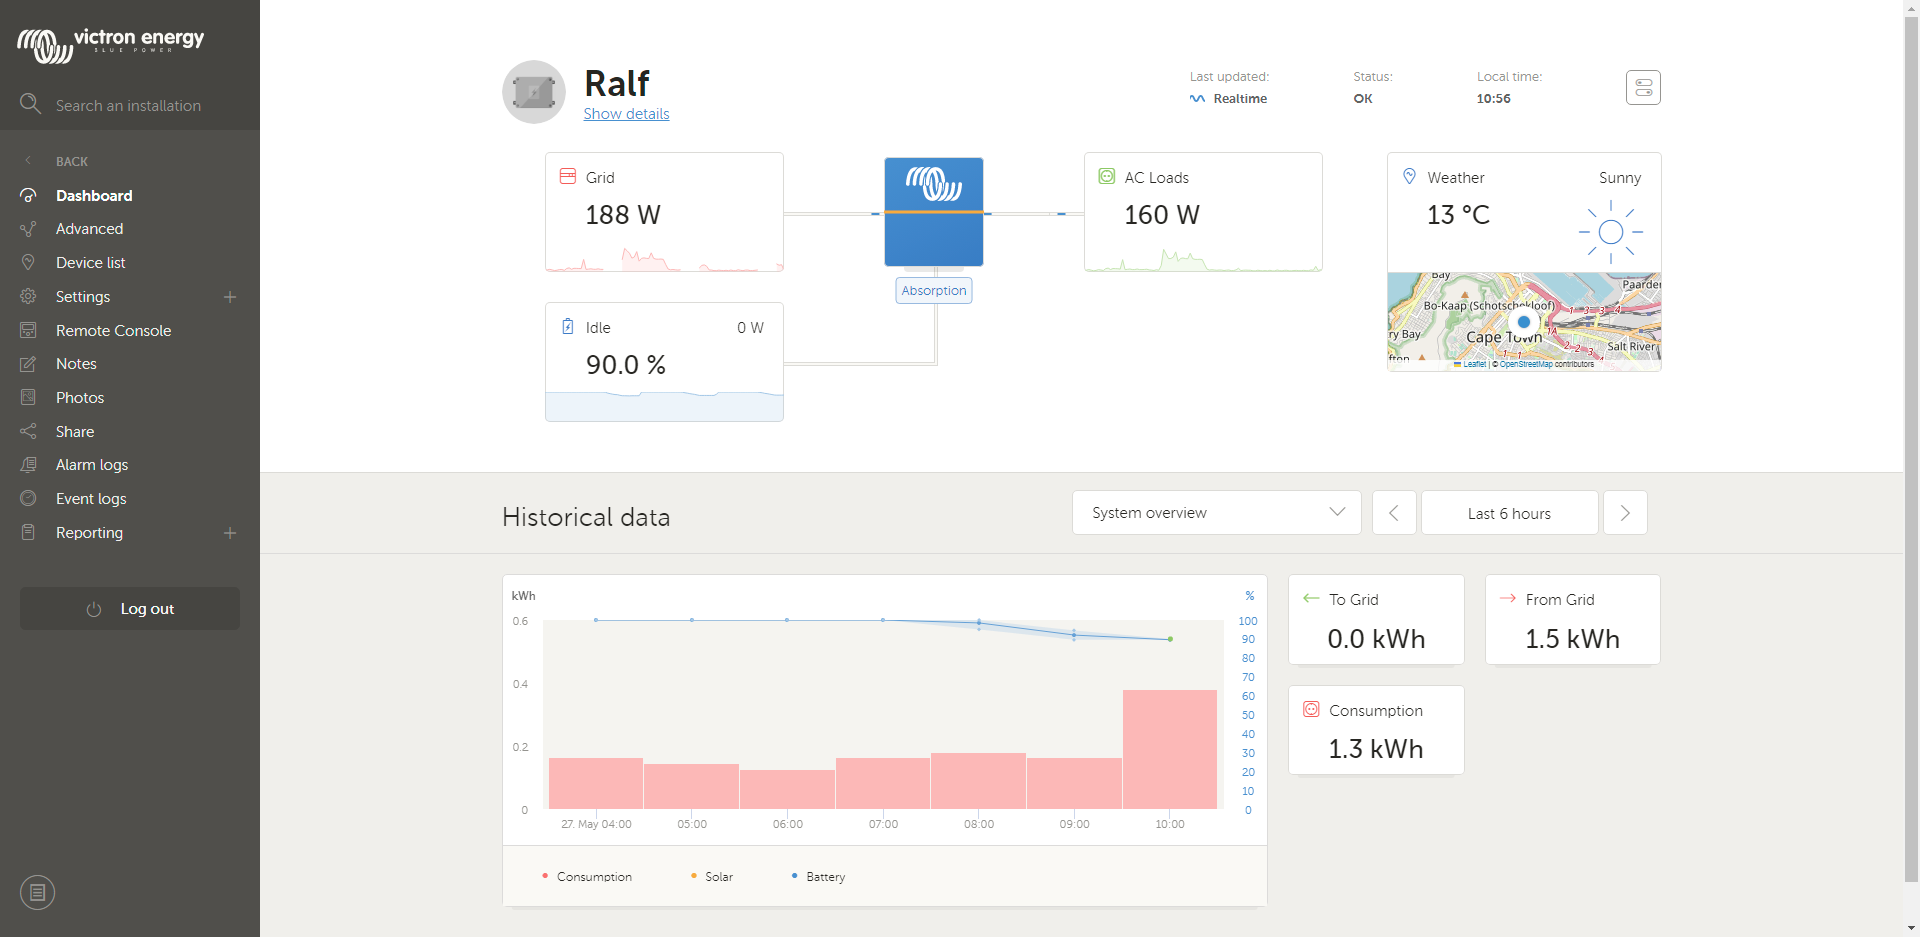
Thanks for responding. This morning, just after 10AM, I boiled a 2,400kW kettle three times (to fill several flasks), yet there's only one spike to 1,985W. The dashboard data is current and updating continuously (so the Wi-Fi is fine), but anything under 'Advanced' seems to be missing data. I've deleted all Victron cookies, but the problem remains the same. The 'missing' Grid data is due to power cuts, we have several 2-4 hour cuts per day, losing up to 10 hours. In principle, VRM is fantastic, but only if it provides true data.ralf-vrm-portal-2023-05-27-105418.pngralf-vrm-portal-2023-05-27-105607.pngralf-vrm-portal-2023-05-27-105523.png

0 Likes 0 ·
JohnC avatar image JohnC ♦ ralf-ct commented ·
@Ralf_CT

You have your Logging Interval set to 10 minutes. That's why the stored data is missing your load peaks.

0 Likes 0 ·
ralf-ct avatar image ralf-ct JohnC ♦ commented ·

That doesn't make sense. VRM offers logging options from 1 minute to 1 hour. I understand this to mean the data stored in the Cerbo GX will be uploaded from 1 minute to 1 hour, depending on the setting, not that it will log what happens every minute or hour.

Edit: I've changed the logging to 1m, it now seems to show the 2,400kW kettle if I use it at a specific time, if I request a graph for the last few hours, BUT, if I request a graph of the last several days the 'peak' at the time when I used the kettle only goes up to 848W. Why?

0 Likes 0 ·
JohnC avatar image JohnC ♦ ralf-ct commented ·
@Ralf_CT

A 10min log interval means just that. No data in between is sent to VRM.

0 Likes 0 ·
ralf-ct avatar image ralf-ct JohnC ♦ commented ·
So if one sets logging to 5 hours to save bandwidth (if using a GSM connection, for example), then the graph will only show what happens at the inverter for an instant every 5 hours? Nothing happening during those 5 hours is displayed? That doesn't sound right.
0 Likes 0 ·
JohnC avatar image JohnC ♦ ralf-ct commented ·
@Ralf_CT

The Log Interval is set in the GX, and the data saved there, for every minute if you have it set for a minute. How often you open comms with VRM is up to you, but that data will then be sent all at once. There are data storage limits on the GX devices, but usually under 24hrs is ok.

Re your edit. I think there's some averaging done when (say) 1 minute data is graphed over a day every 5 min. You can usually zoom it to get down to 1 min graph points again over a shorter length of time.

0 Likes 0 ·
ralf-ct avatar image ralf-ct JohnC ♦ commented ·

I think I may be getting somewhere. I just came across this, which will address my 'edit' issue above and show the maximum value over a given period:

Show range values

Accurately show peaks by plotting the min-max data.VRM data is recorded on sample basis, with the sample interval being the logging interval as configured on the GX Device.

0 Likes 0 ·
1234enough avatar image
1234enough answered ·

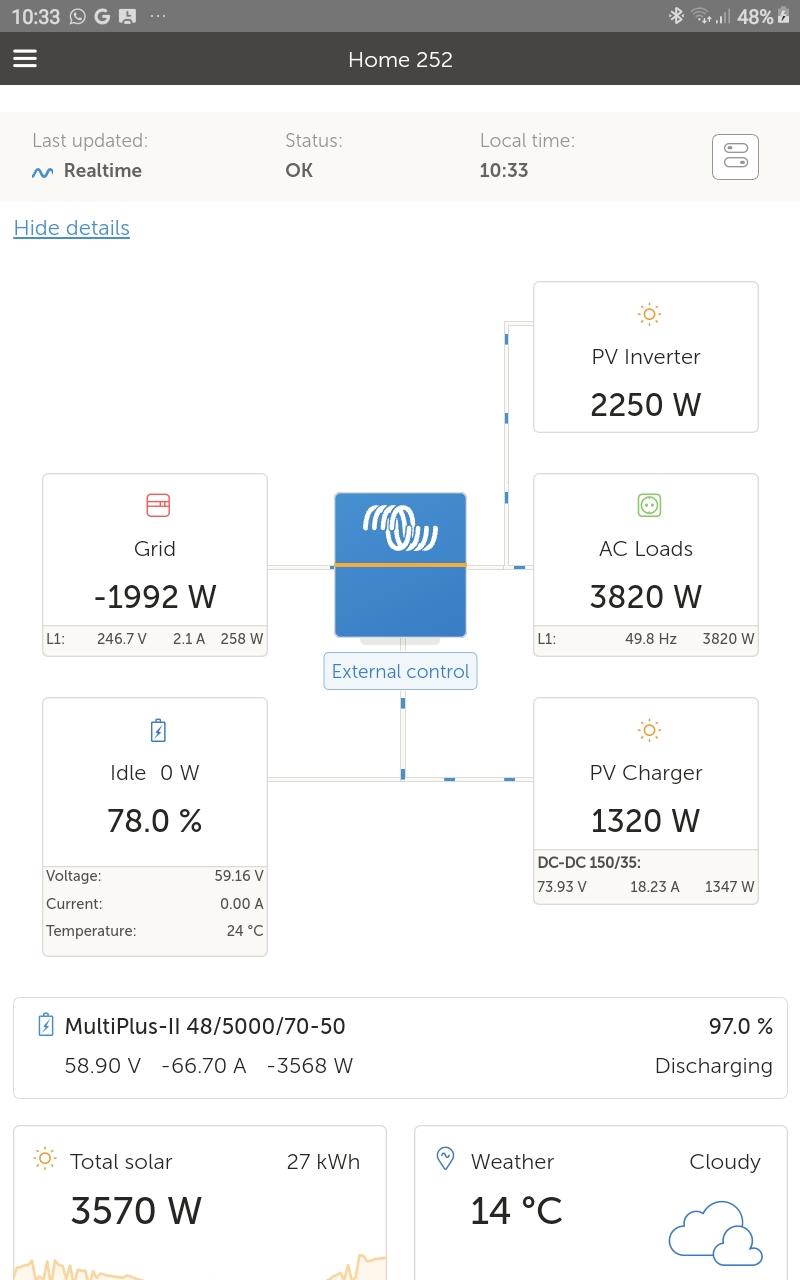
VRM not displaying correct, been discharging and display is showing idle, when charging it seems to display correctly. Seems to be all over the place since last update.screenshot-20230527-103322-vrm.jpg


2 |3000

Up to 8 attachments (including images) can be used with a maximum of 190.8 MiB each and 286.6 MiB total.

amgmaniac avatar image
amgmaniac answered ·

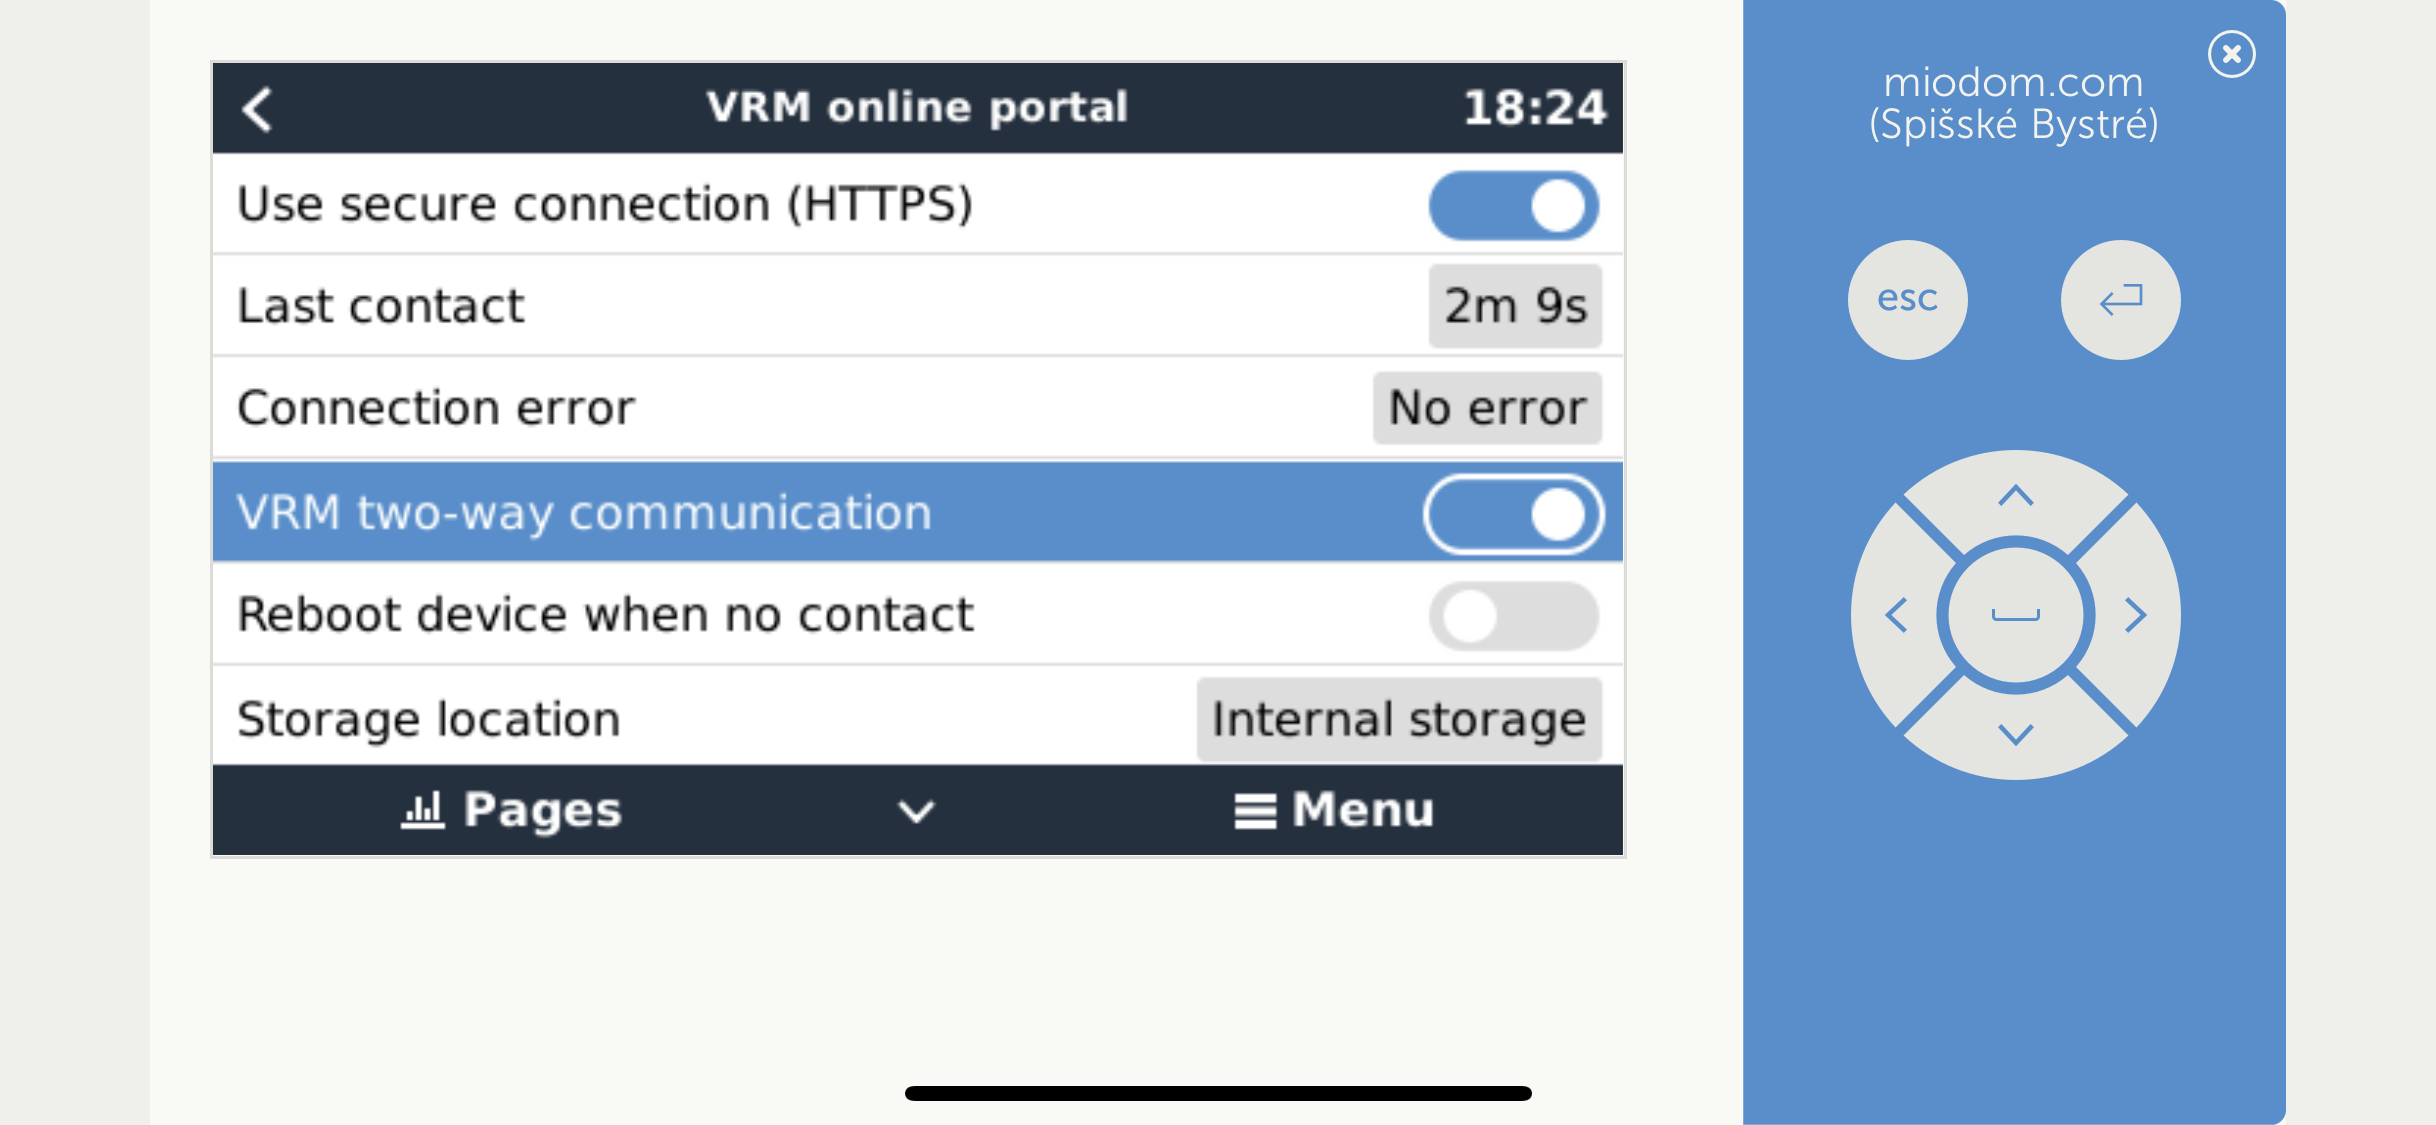
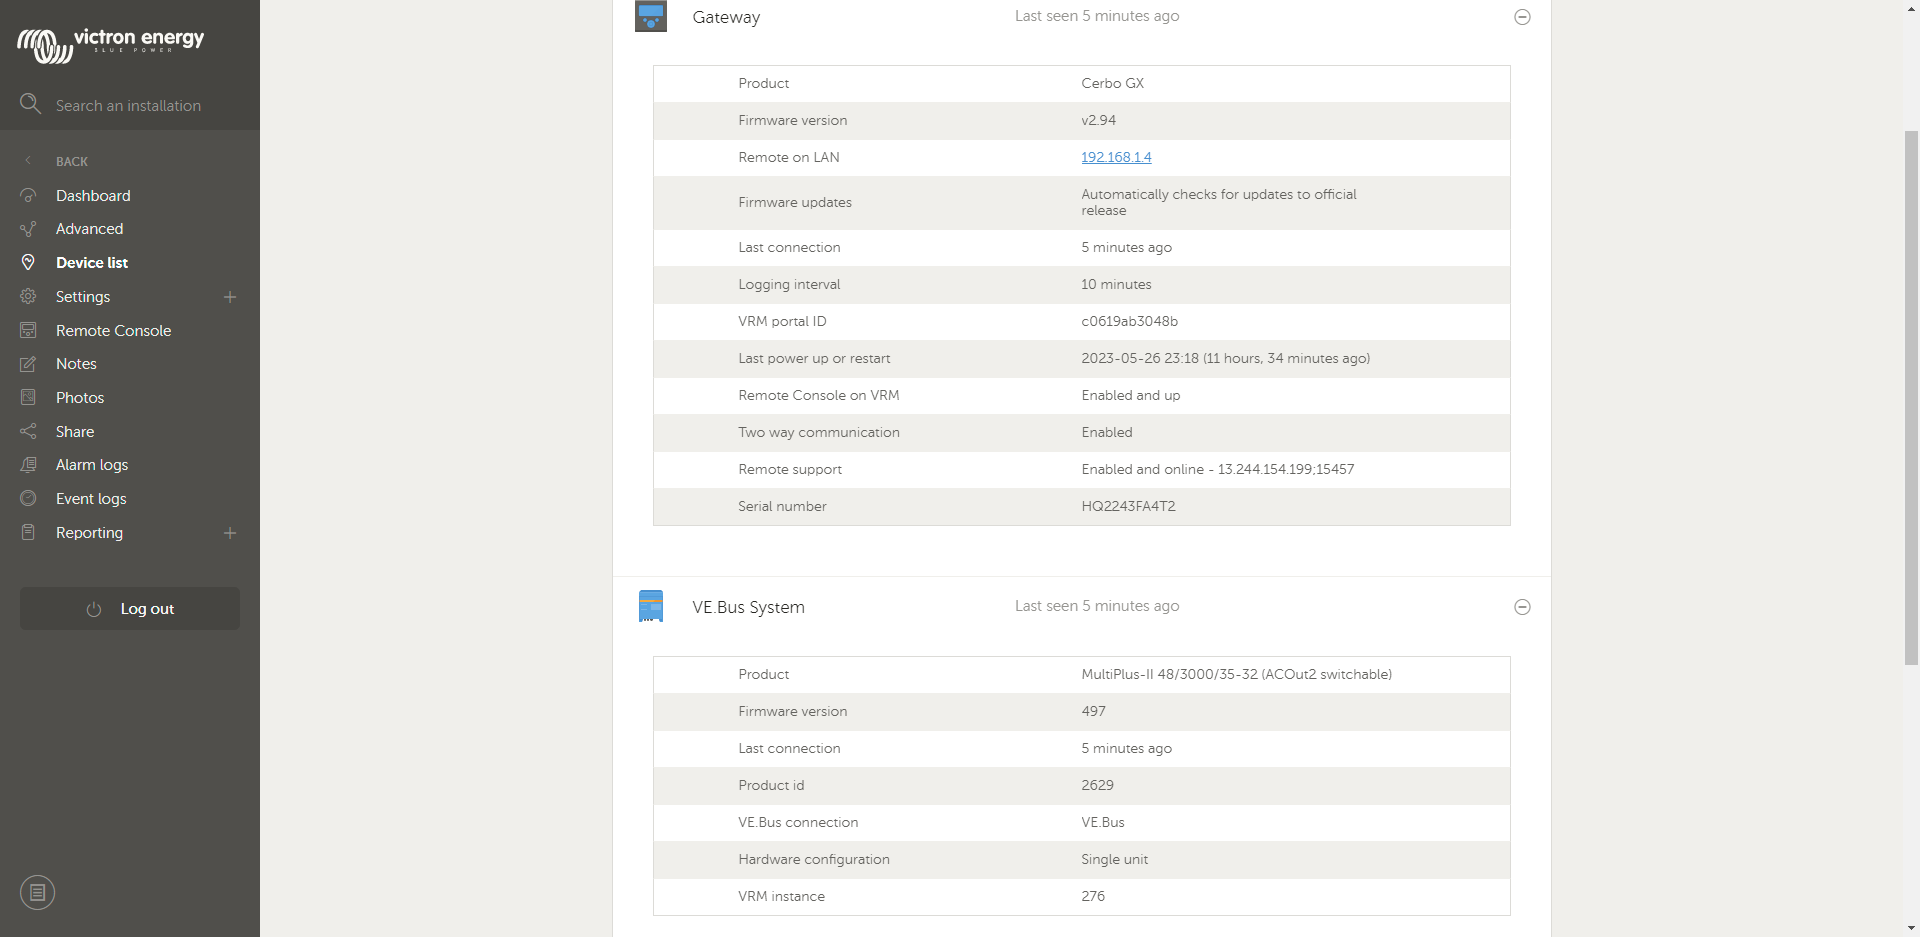
I've been experiencing this problem until just now. Through my Cerbo GX I navigated to Settings/VRM Portal/Log Interval and changed that to 1m. I then ticked the VRM two way connection to On and low and behold my online portal updated immediately and also now shows my Multiplus II which wasn't there before. It also now shows Real-time under last updated. Problem solved, for me anyway! Screenshot_20240210_102012.jpgScreenshot_20240210_102039.jpg


2 |3000

Up to 8 attachments (including images) can be used with a maximum of 190.8 MiB each and 286.6 MiB total.