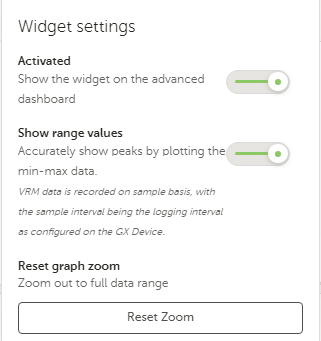
What happens when the " SHOW RANGE VALUES " slider is selected and where would someone see because i tried and cant see any difference same for the " RESET GRAPH ZOOM " they must do something but i cant see what or where .

This site is now in read-only archive mode. Please move all discussion, and create a new account at the new Victron Community site.
What happens when the " SHOW RANGE VALUES " slider is selected and where would someone see because i tried and cant see any difference same for the " RESET GRAPH ZOOM " they must do something but i cant see what or where .

How are you viewing the widget?
I have found the widget works better on my laptop.
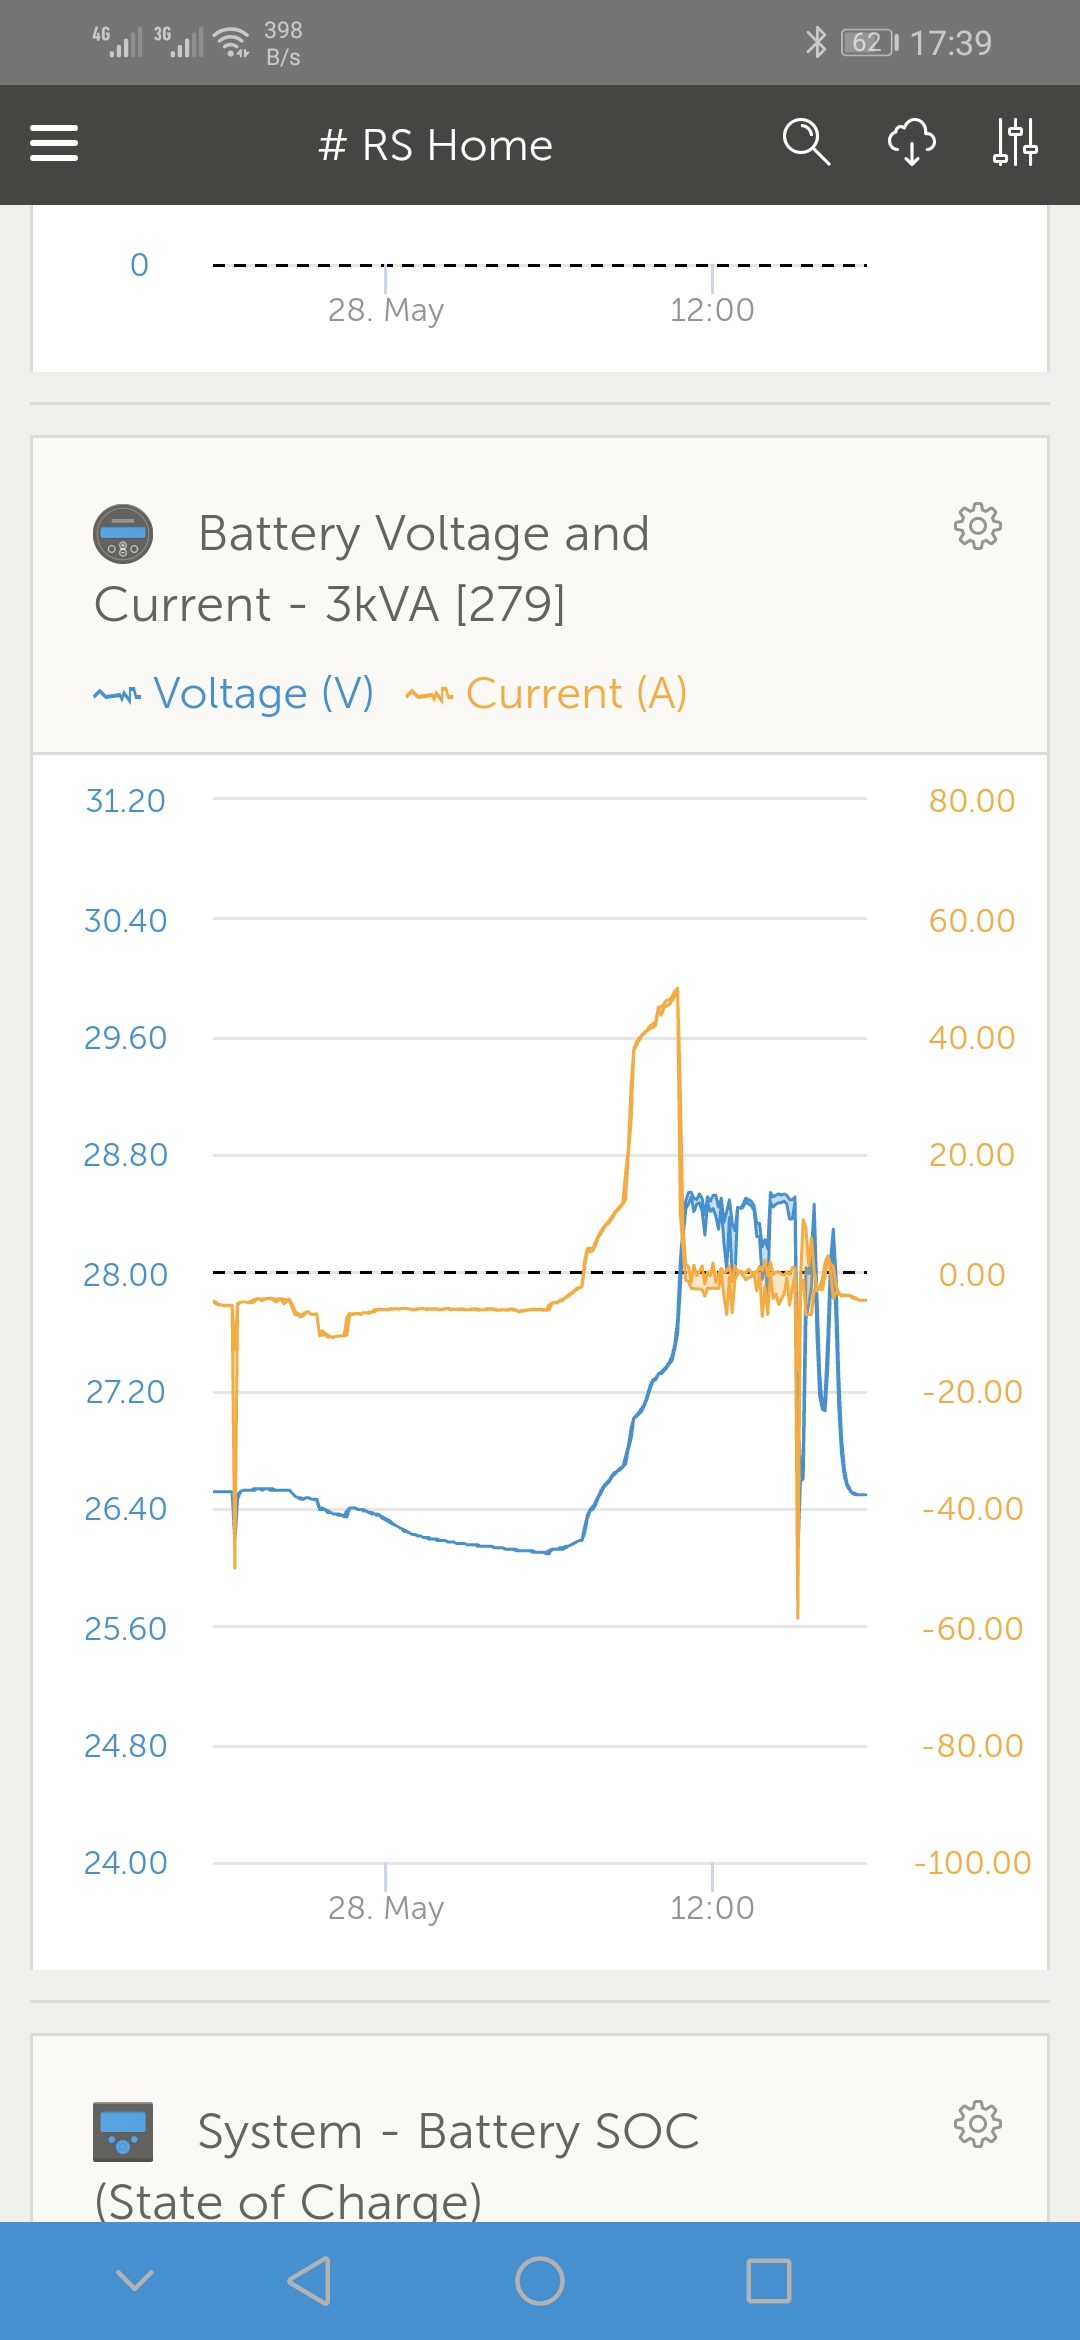
On the app not so much. And not all widgets.
See example from the app on my phone.
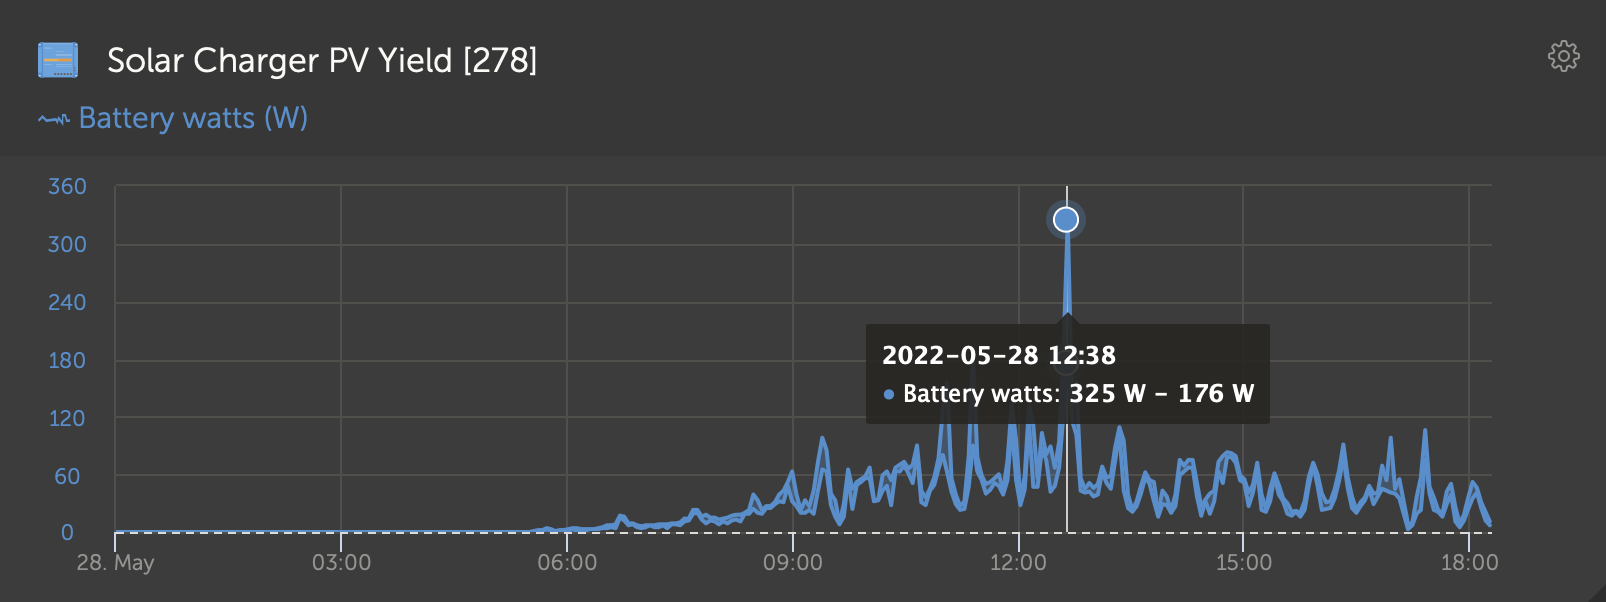
Example with range values on.
Yes i do everything on my Laptops Alexandra . I noticed that only some widgets have the settings option top right corner and their the ones that have the setting i dont understand and cant see .
What example form the app on your phone ?


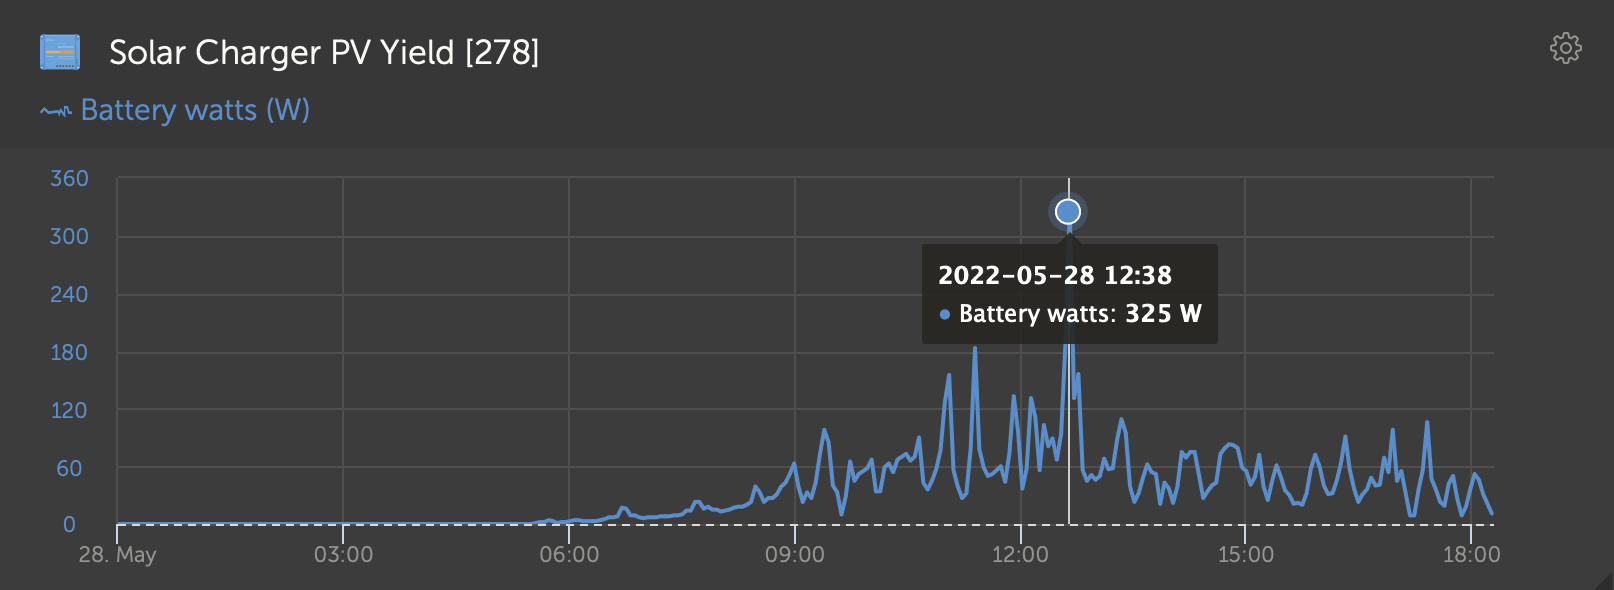
Thank you again Alexandra , i see it now , actually i did notice the data given 2 different figures yesterday but coincidentally it was after i had changed the log time from 1 min to 15 so assumed it was the variation during the time between logs .
Still unsure of the " ZOOM OUT TO FULL DATA RANGE " and RESET ZOOM , probably something obvious i just havnt noticed .
Additional resources still need to be added for this topic
25 People are following this question.