question

misullivan avatar image
misullivan asked

Odd behavior of easysolar-II GX when sun is strong.

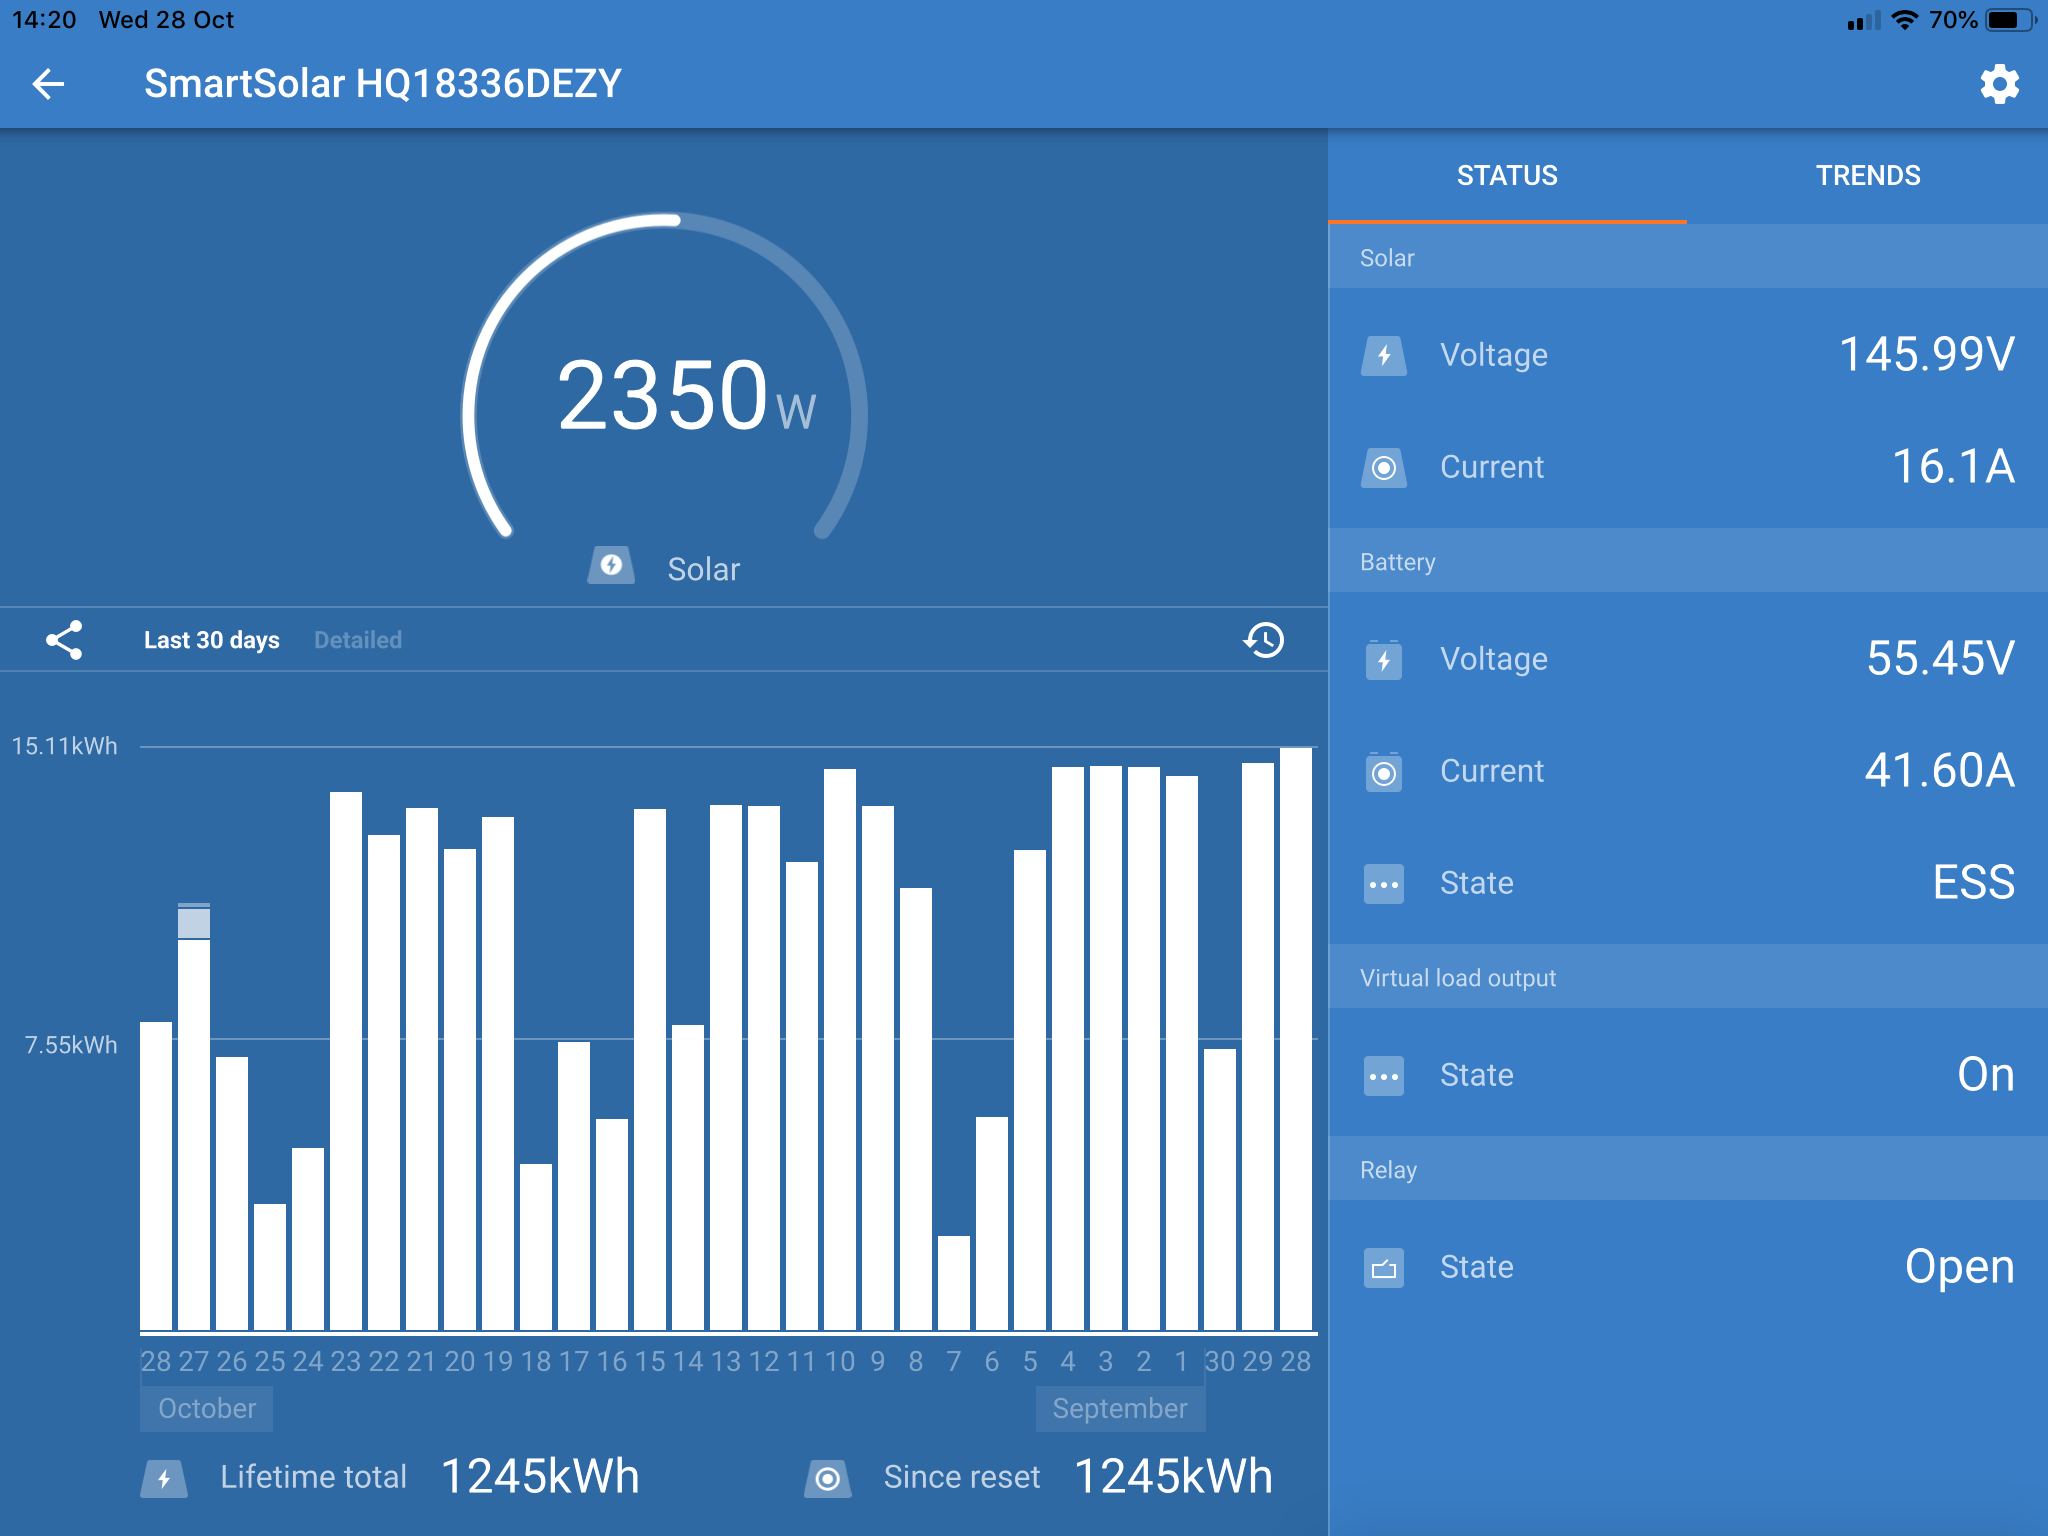
Setup: easysolar-II GX, the Smartsolar 250/70 has been replaced once already as it failed in three months.. needless to say I’m a little paranoid of it doing it again.. today for the third time the solar charge “disappeared” from the VRM and off console.. rebooted the GX, and it could see the charger but not the Multiplus.. second reboot of the GX and everything returned to normal..


Solar panels are Canadian Solar CS6P-250P connected 2Px6S VoC is well below 250v and should remain so down to -5C (it rarely goes below 4C here so should be safe from extremes).


BVM-712 connected (Ve.direct) and monitoring 4x200ah flooded batteries + midpoint.


Load is a bunch of computers and networking equipment (around 2000w continuous... 24x7).


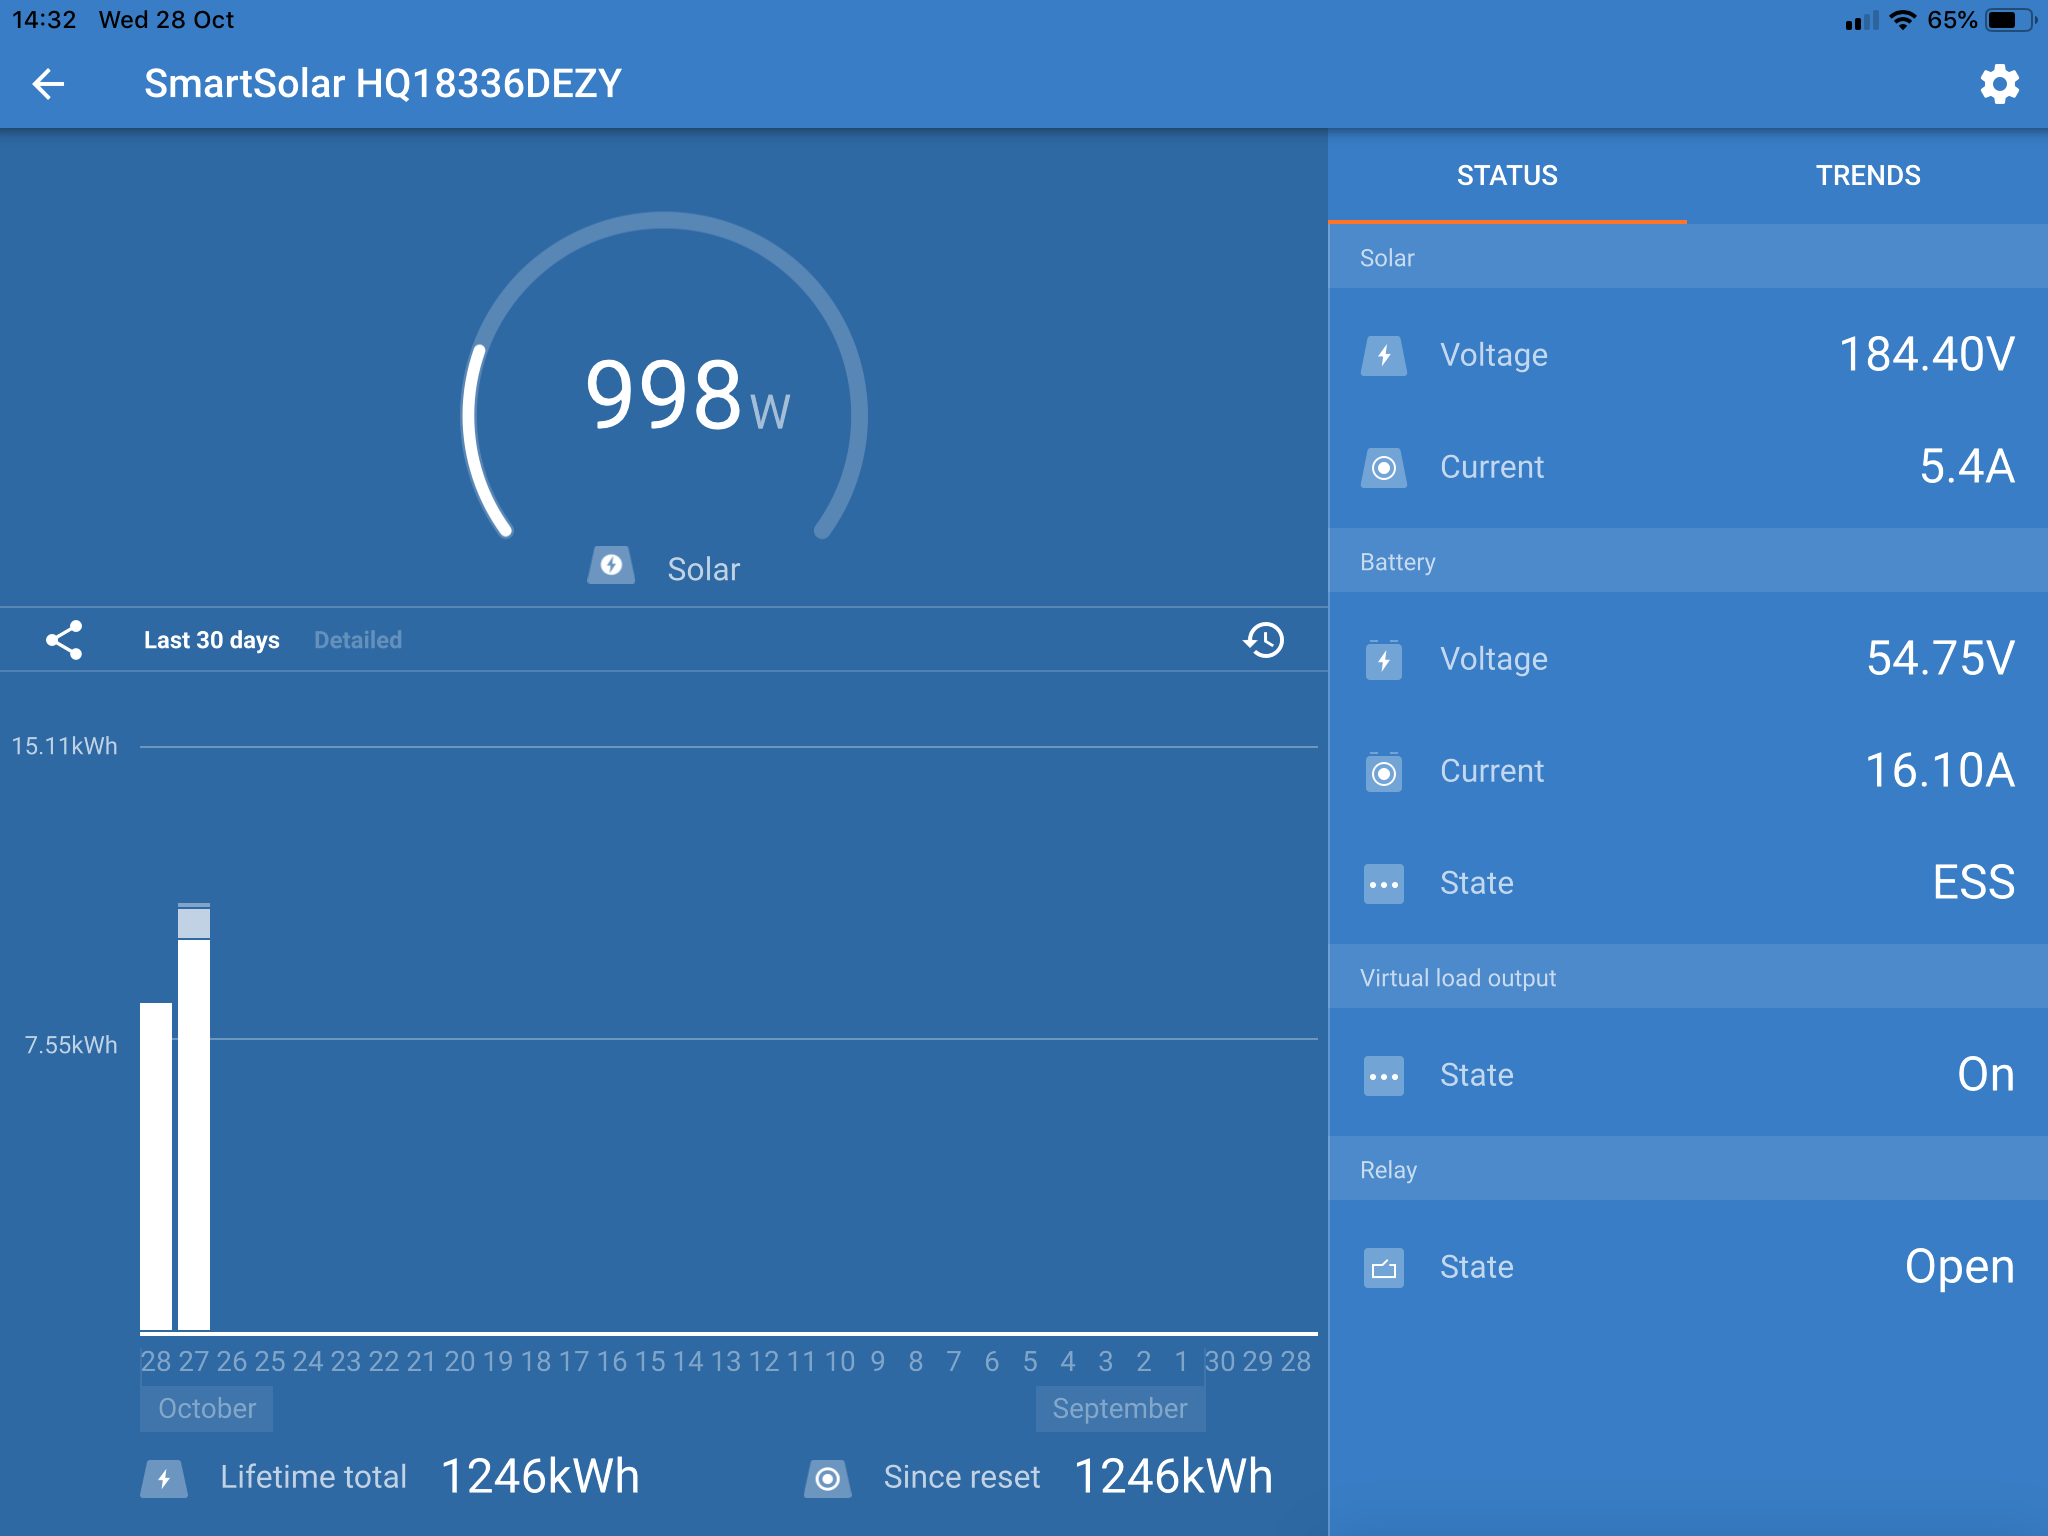
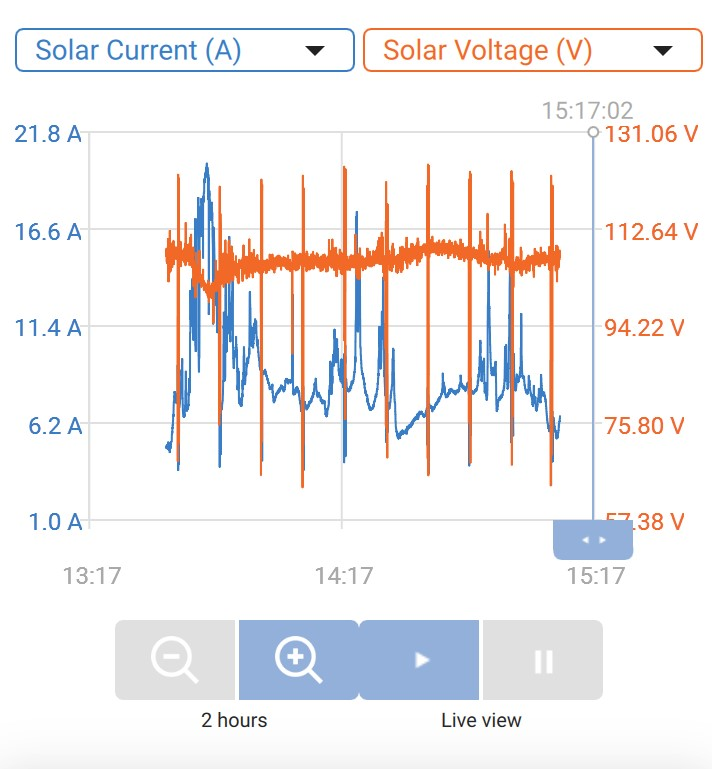
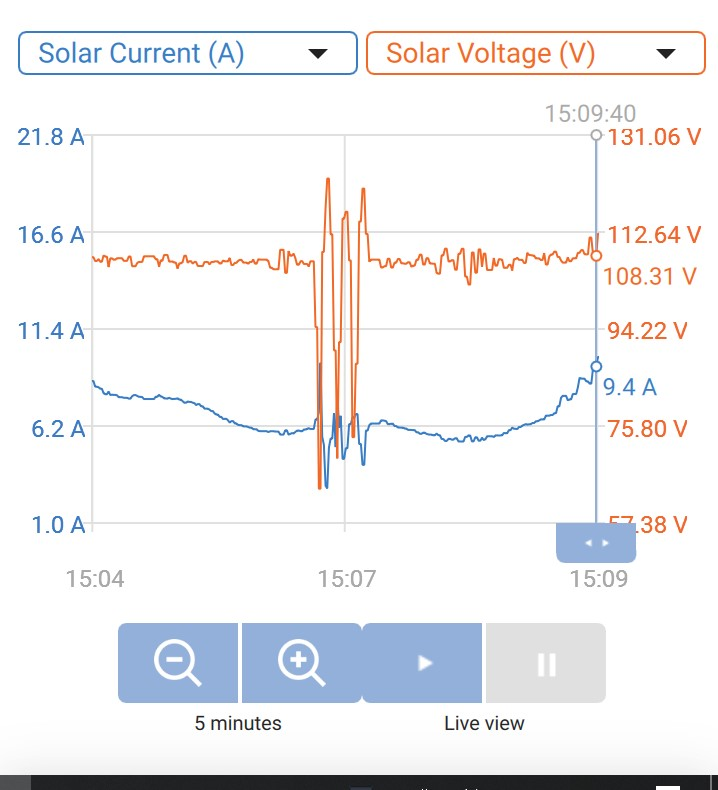
What I am seeing which concerns me is is everything is fine and stable until high clear sun (hazy sun is fine).. generated wattage goes up to around 2500w (mostly around 2000w)... however today was watching and when the sun was clear and strong it would generate 2800-2900 and immediately drop to as little as 4w before ramping up again, then dropping, then ramping... littlehaze or cloud comes across and it ramps up to less than 2550w and it’s stable again... that clears and back again to completely unstable over 2700w.


Anyone else seen this? Any idea why? Victron staff you’re welcome to remote connect or check the data in VRM... I don’t want to see this blow the solar unit again and I am getting concerned as if there is a fault in the inverter it’s going to be a real pain in the proverbial as the computers are part of a global server farm and it provides UPS services for the farm. (Hopefully will have 2 more soon so it won’t be such a problem if one dies.. but also worried about reliability in all cases.)


Thanks,


Michelle

EasySolar All-in-One
2 |3000

Up to 8 attachments (including images) can be used with a maximum of 190.8 MiB each and 286.6 MiB total.

2 Answers
dan3i avatar image
dan3i answered ·

I looked at the panels you mentioned, they have a Voc of 37.2v with 6 in series your at almost 225v...without being in front of your system with a meter id say your hitting the over volt protection, verify your voltage from the pv during those bright sunny days. you may have gotten more bang for your buck with those panels.

6 comments
2 |3000

Up to 8 attachments (including images) can be used with a maximum of 190.8 MiB each and 286.6 MiB total.

the-doon avatar image the-doon commented ·

Was thinking the same thing.

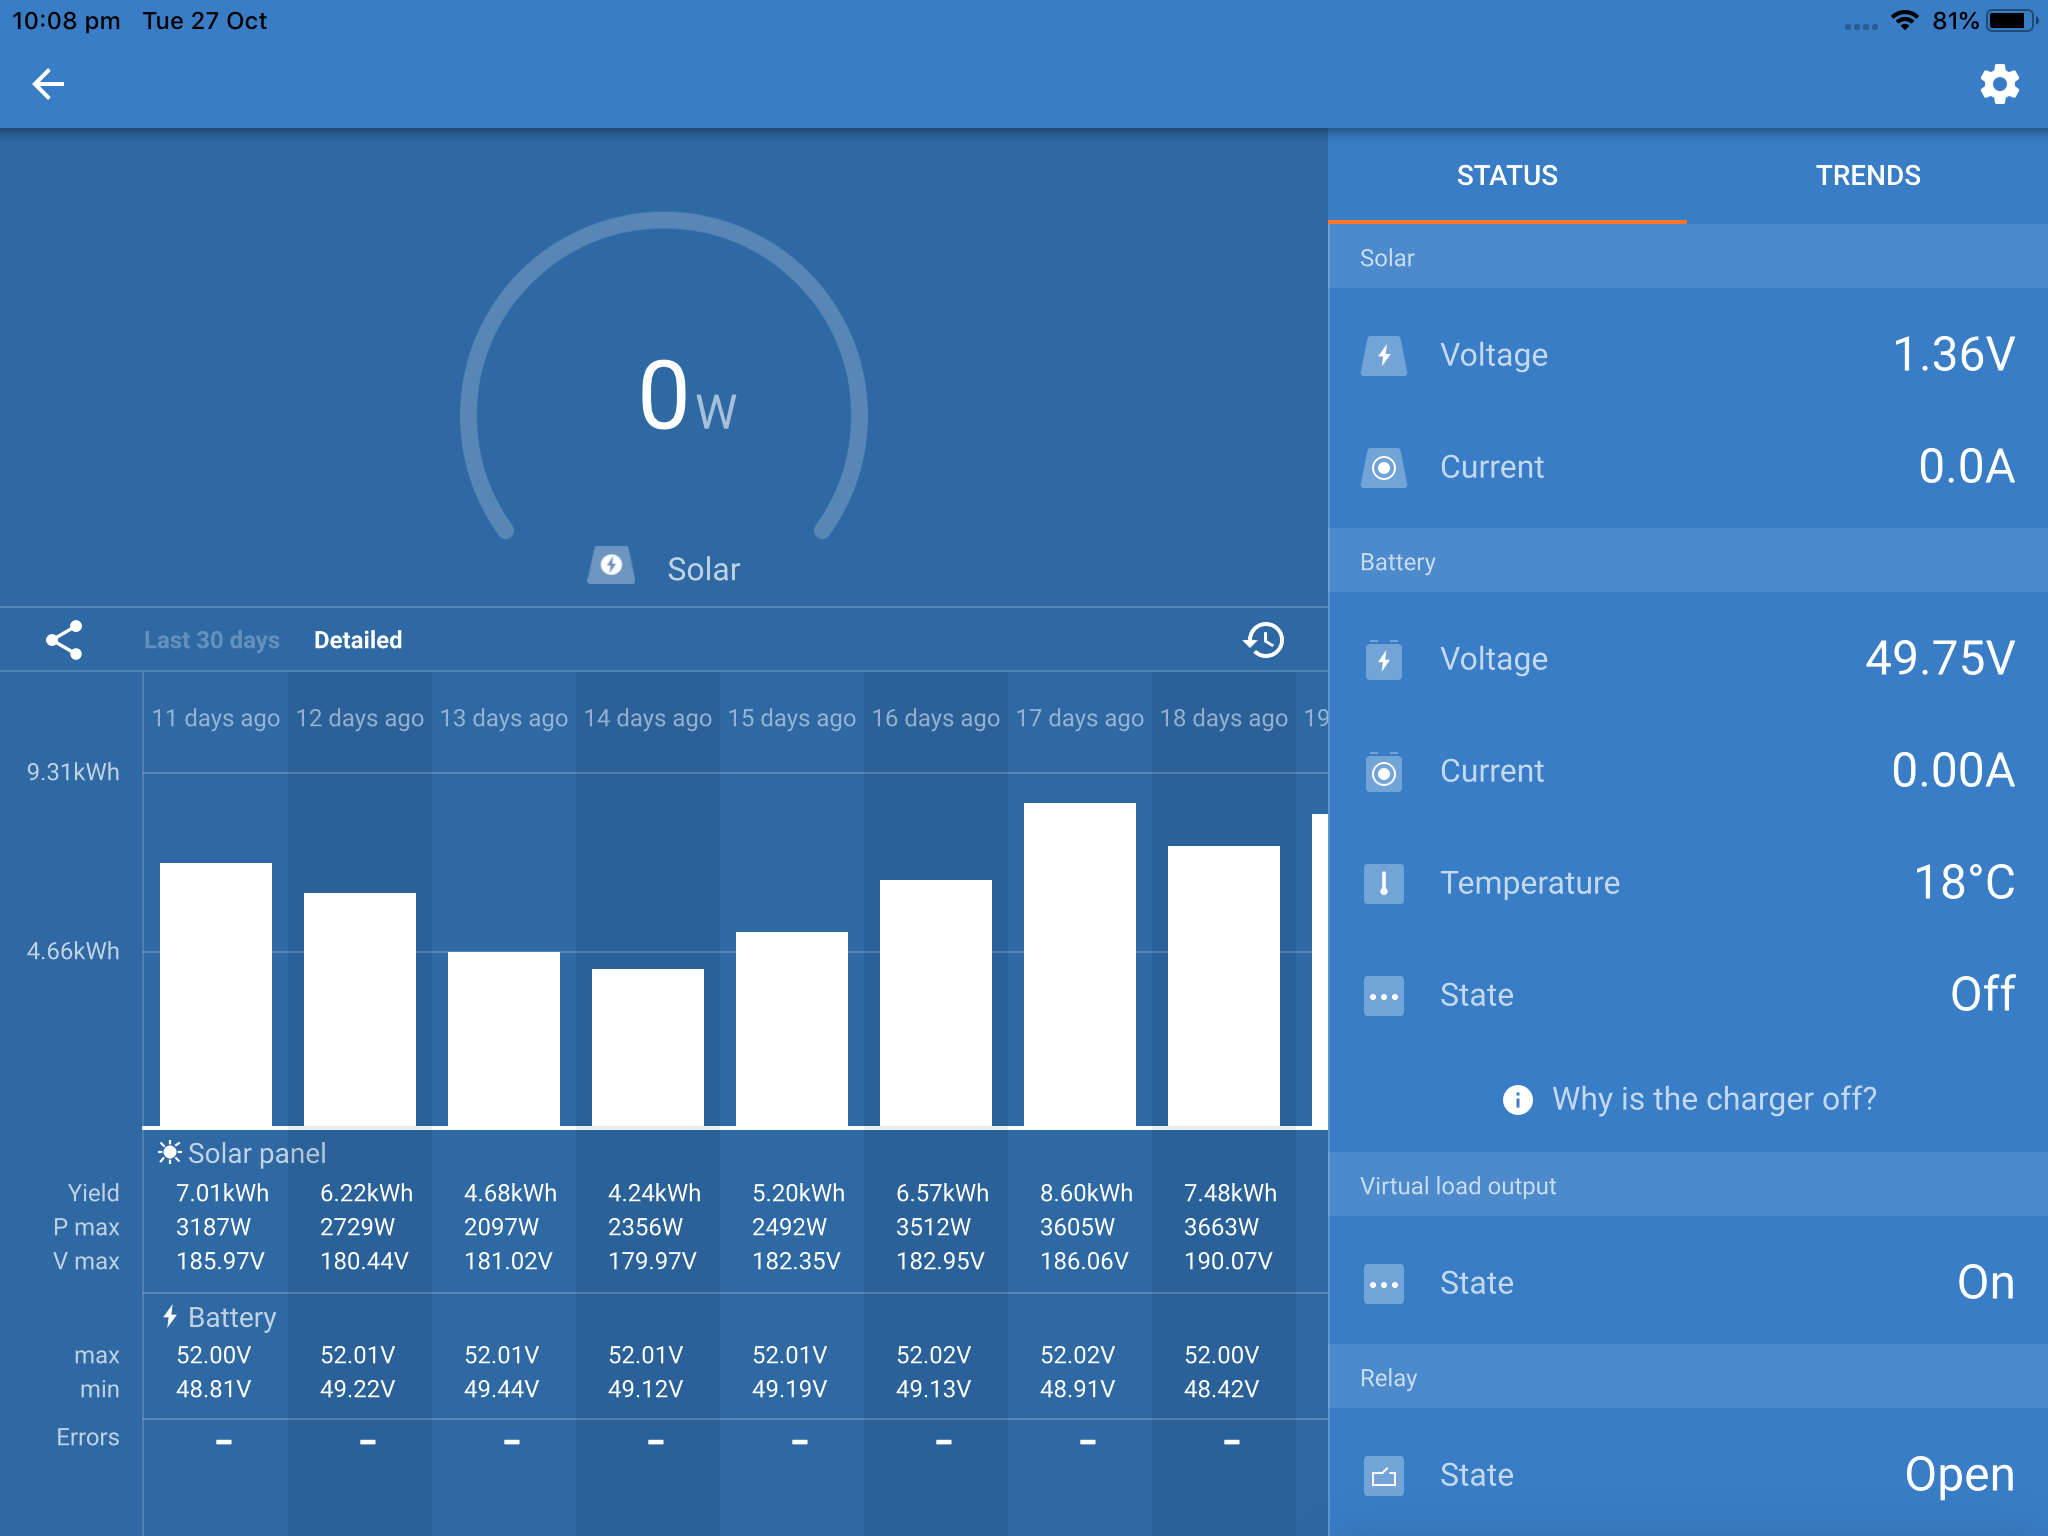
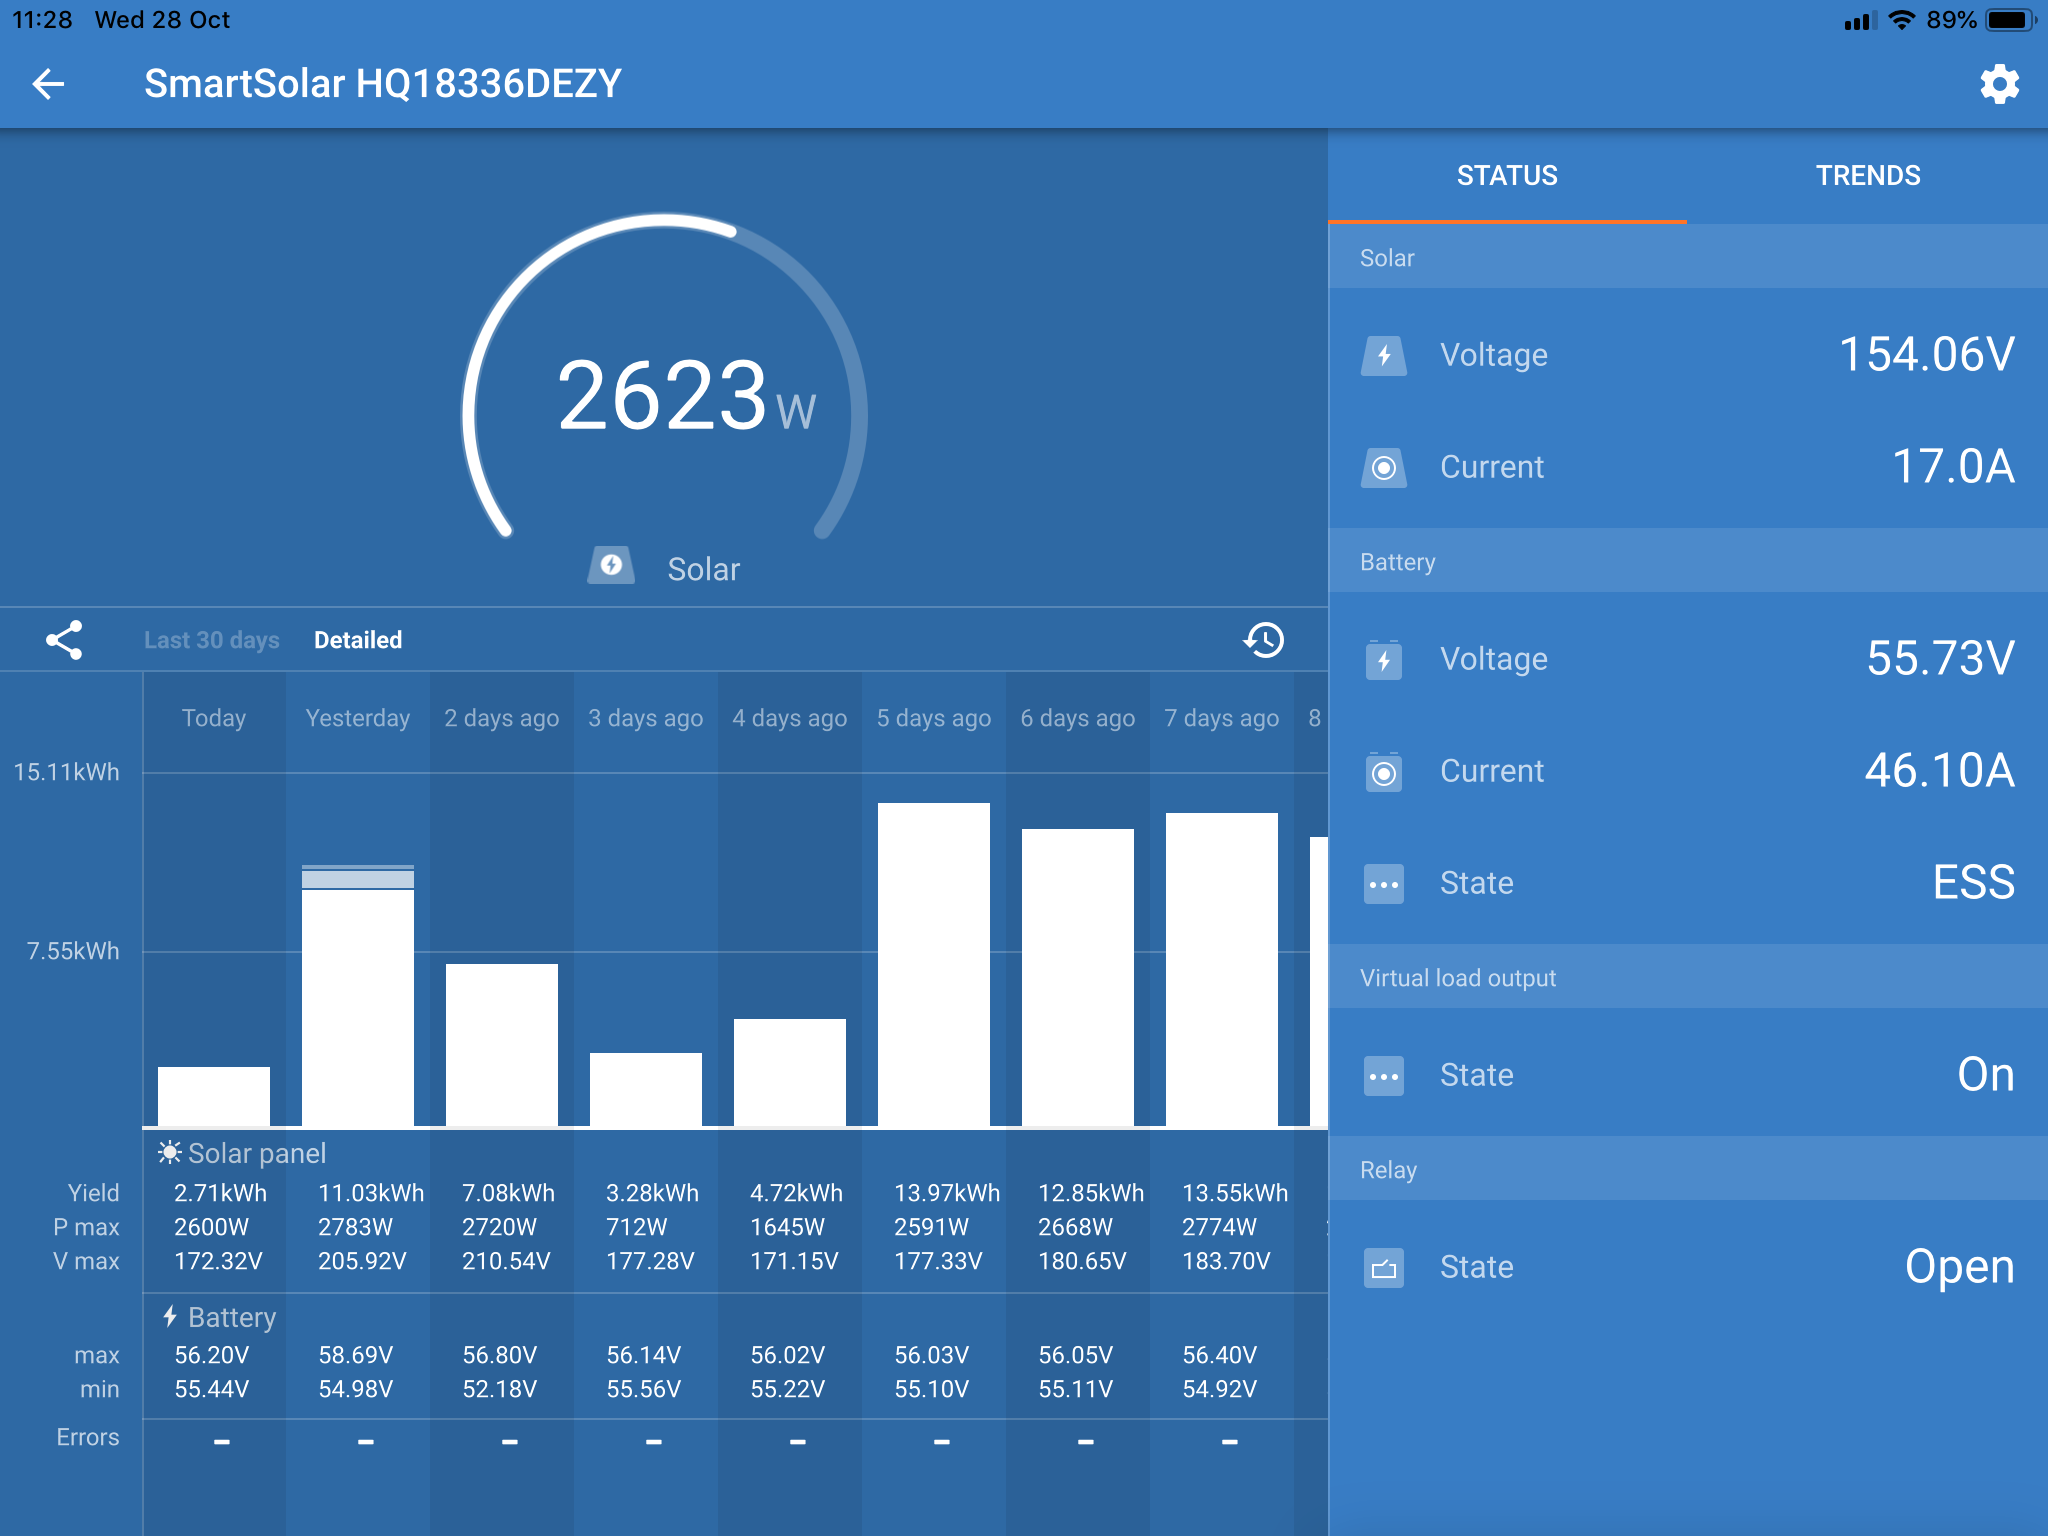
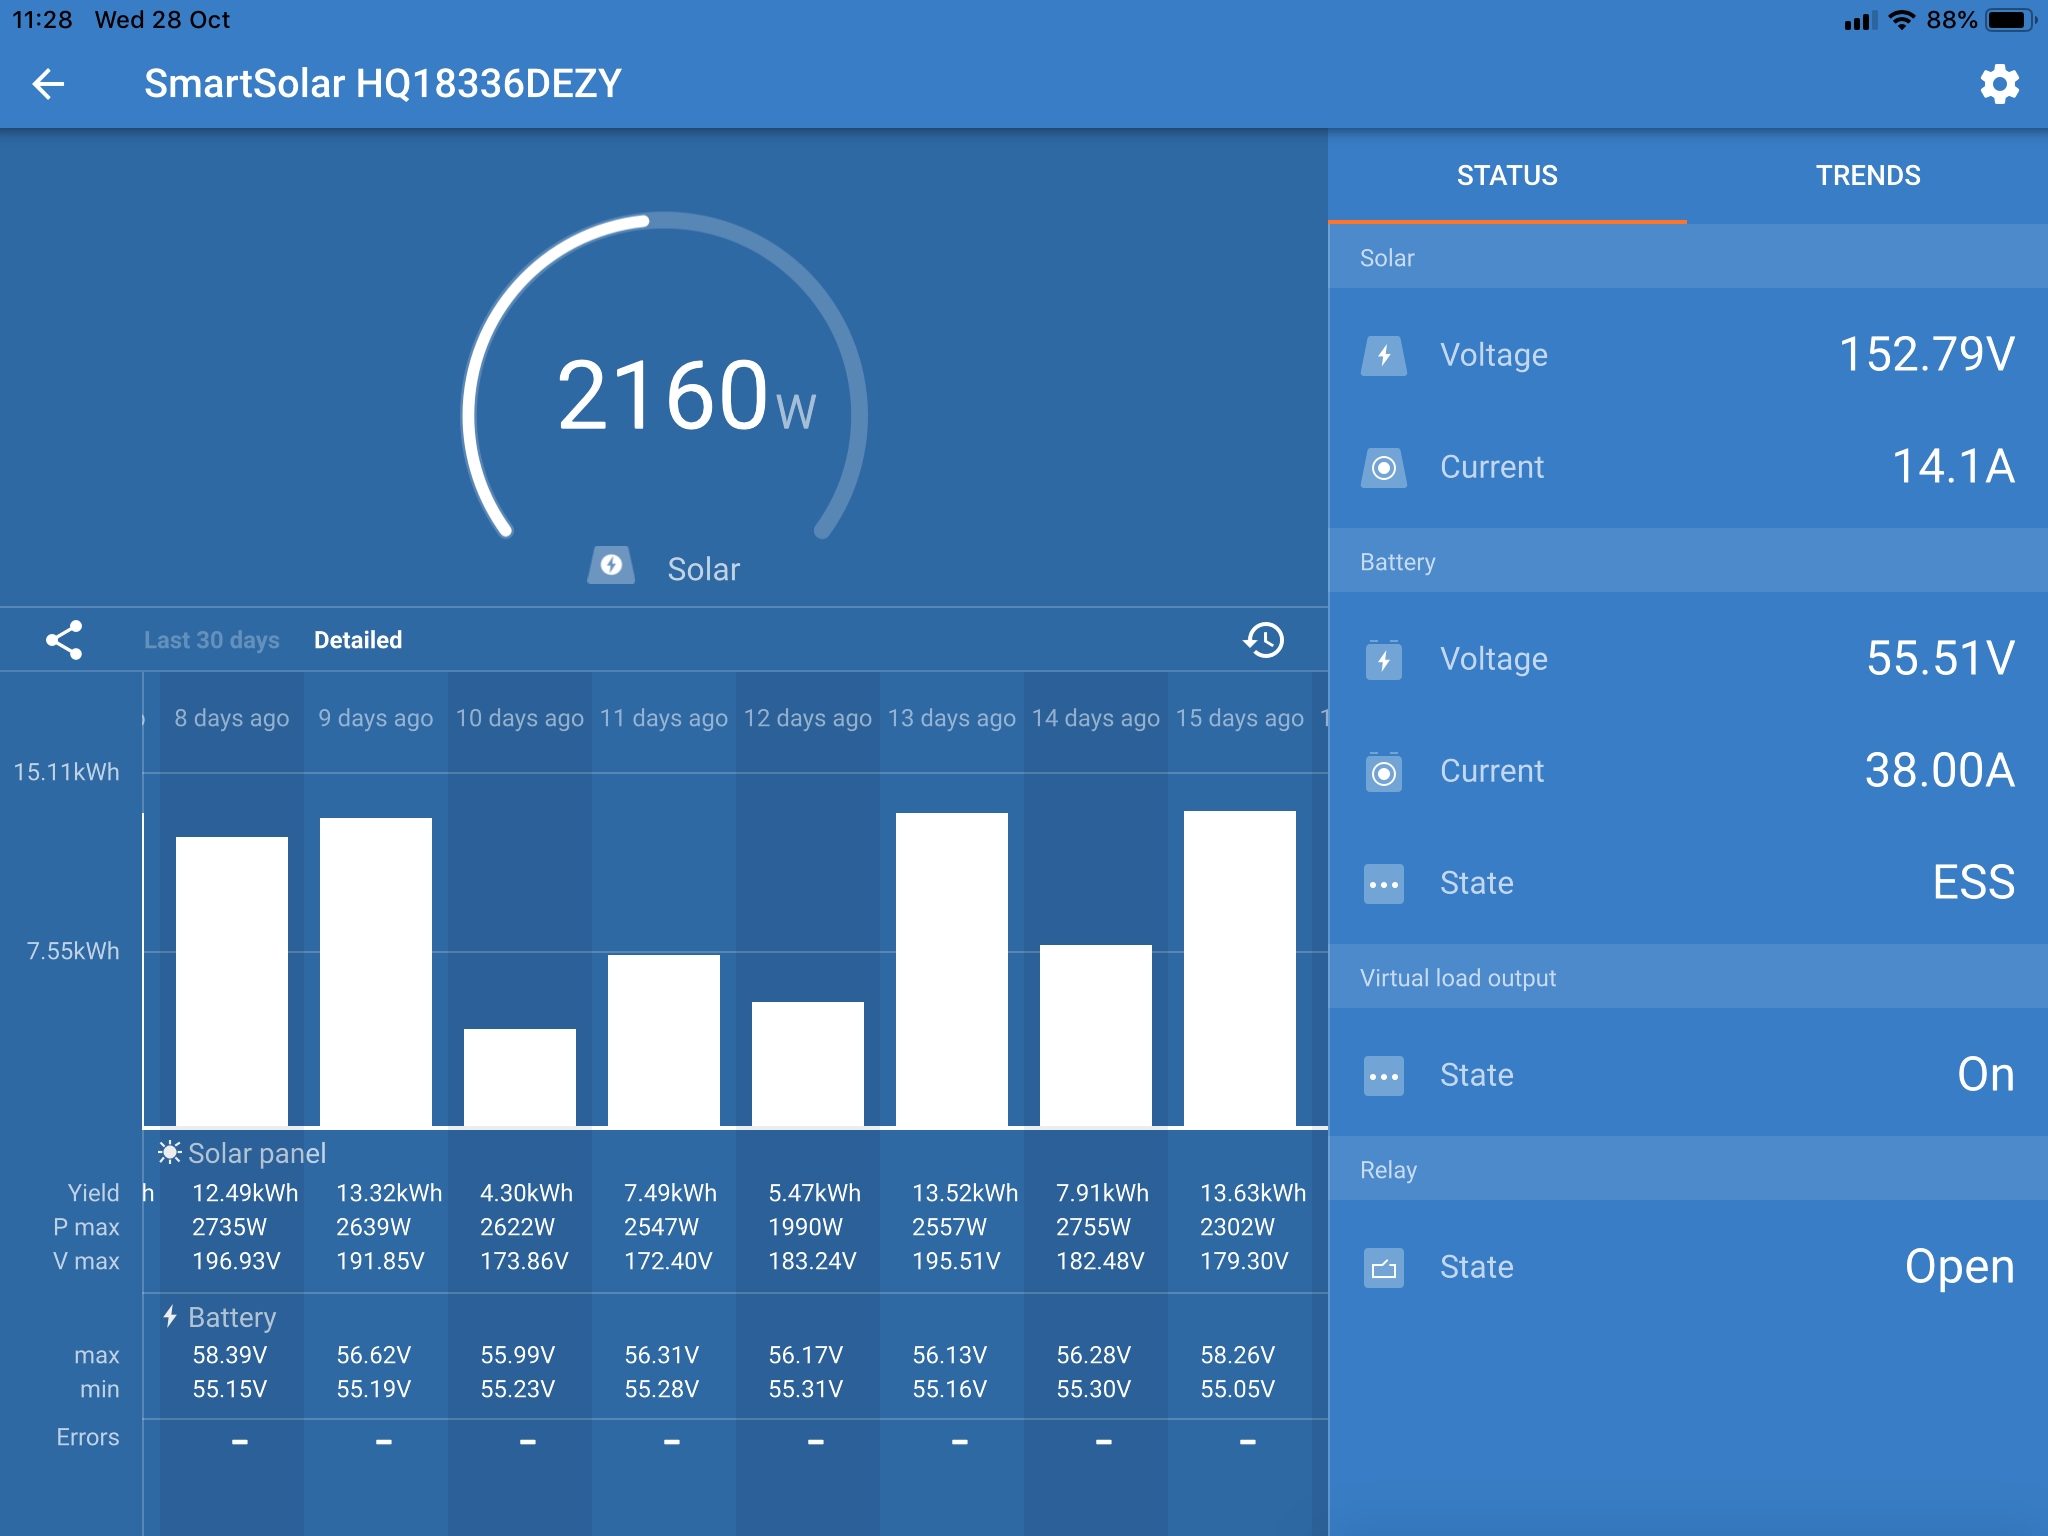
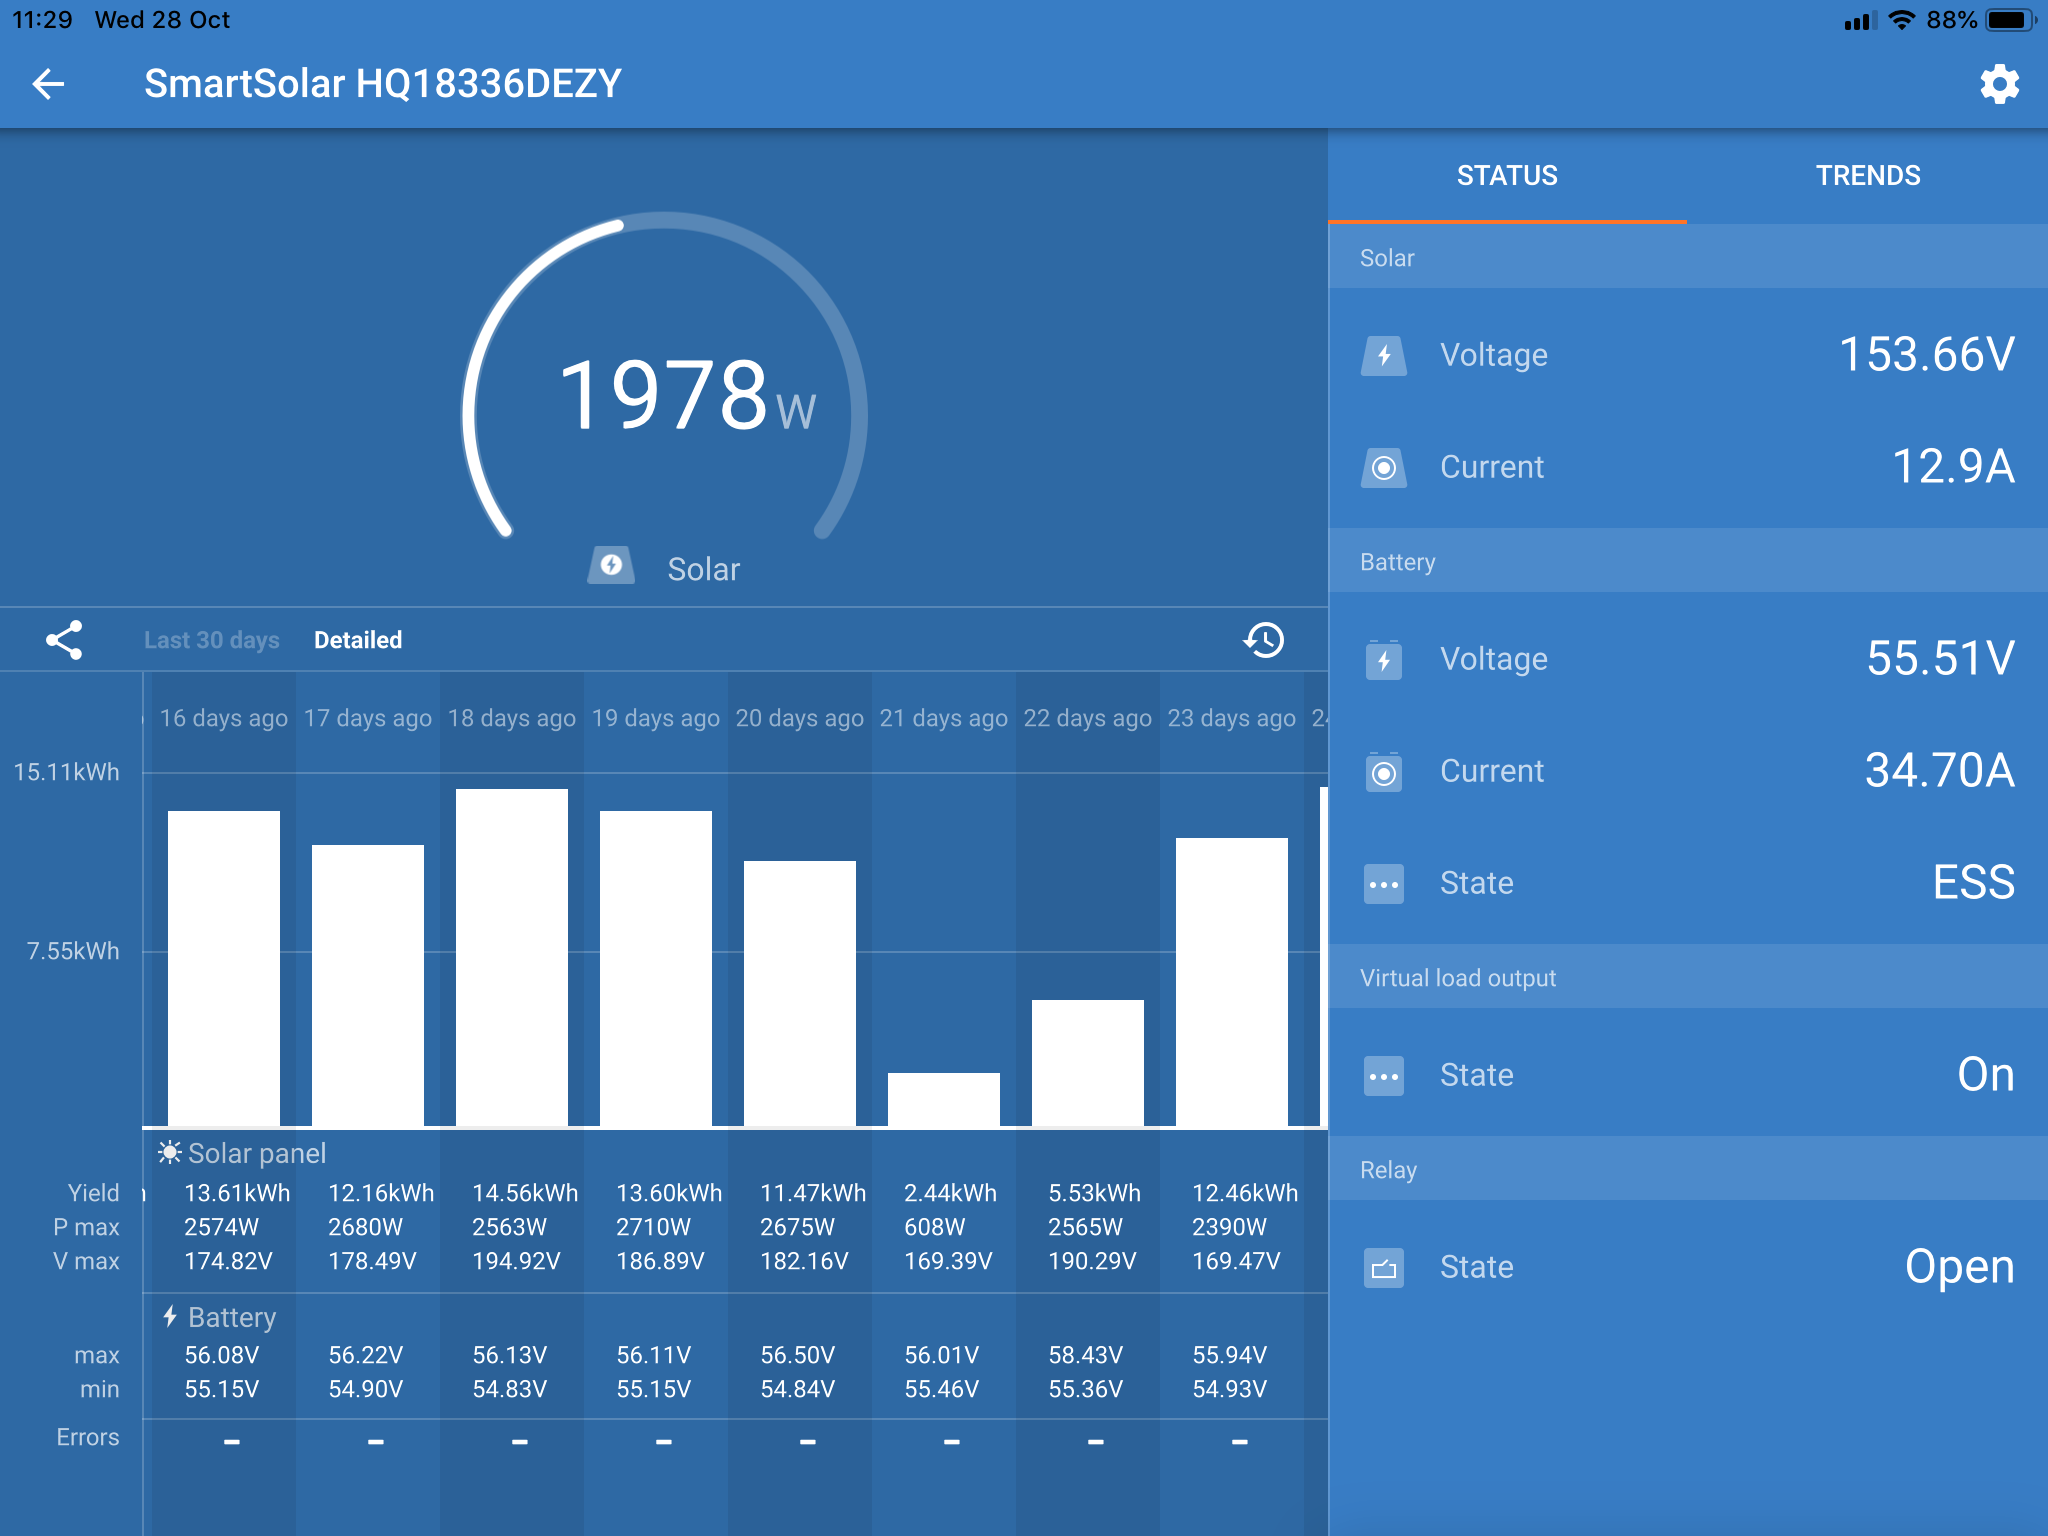
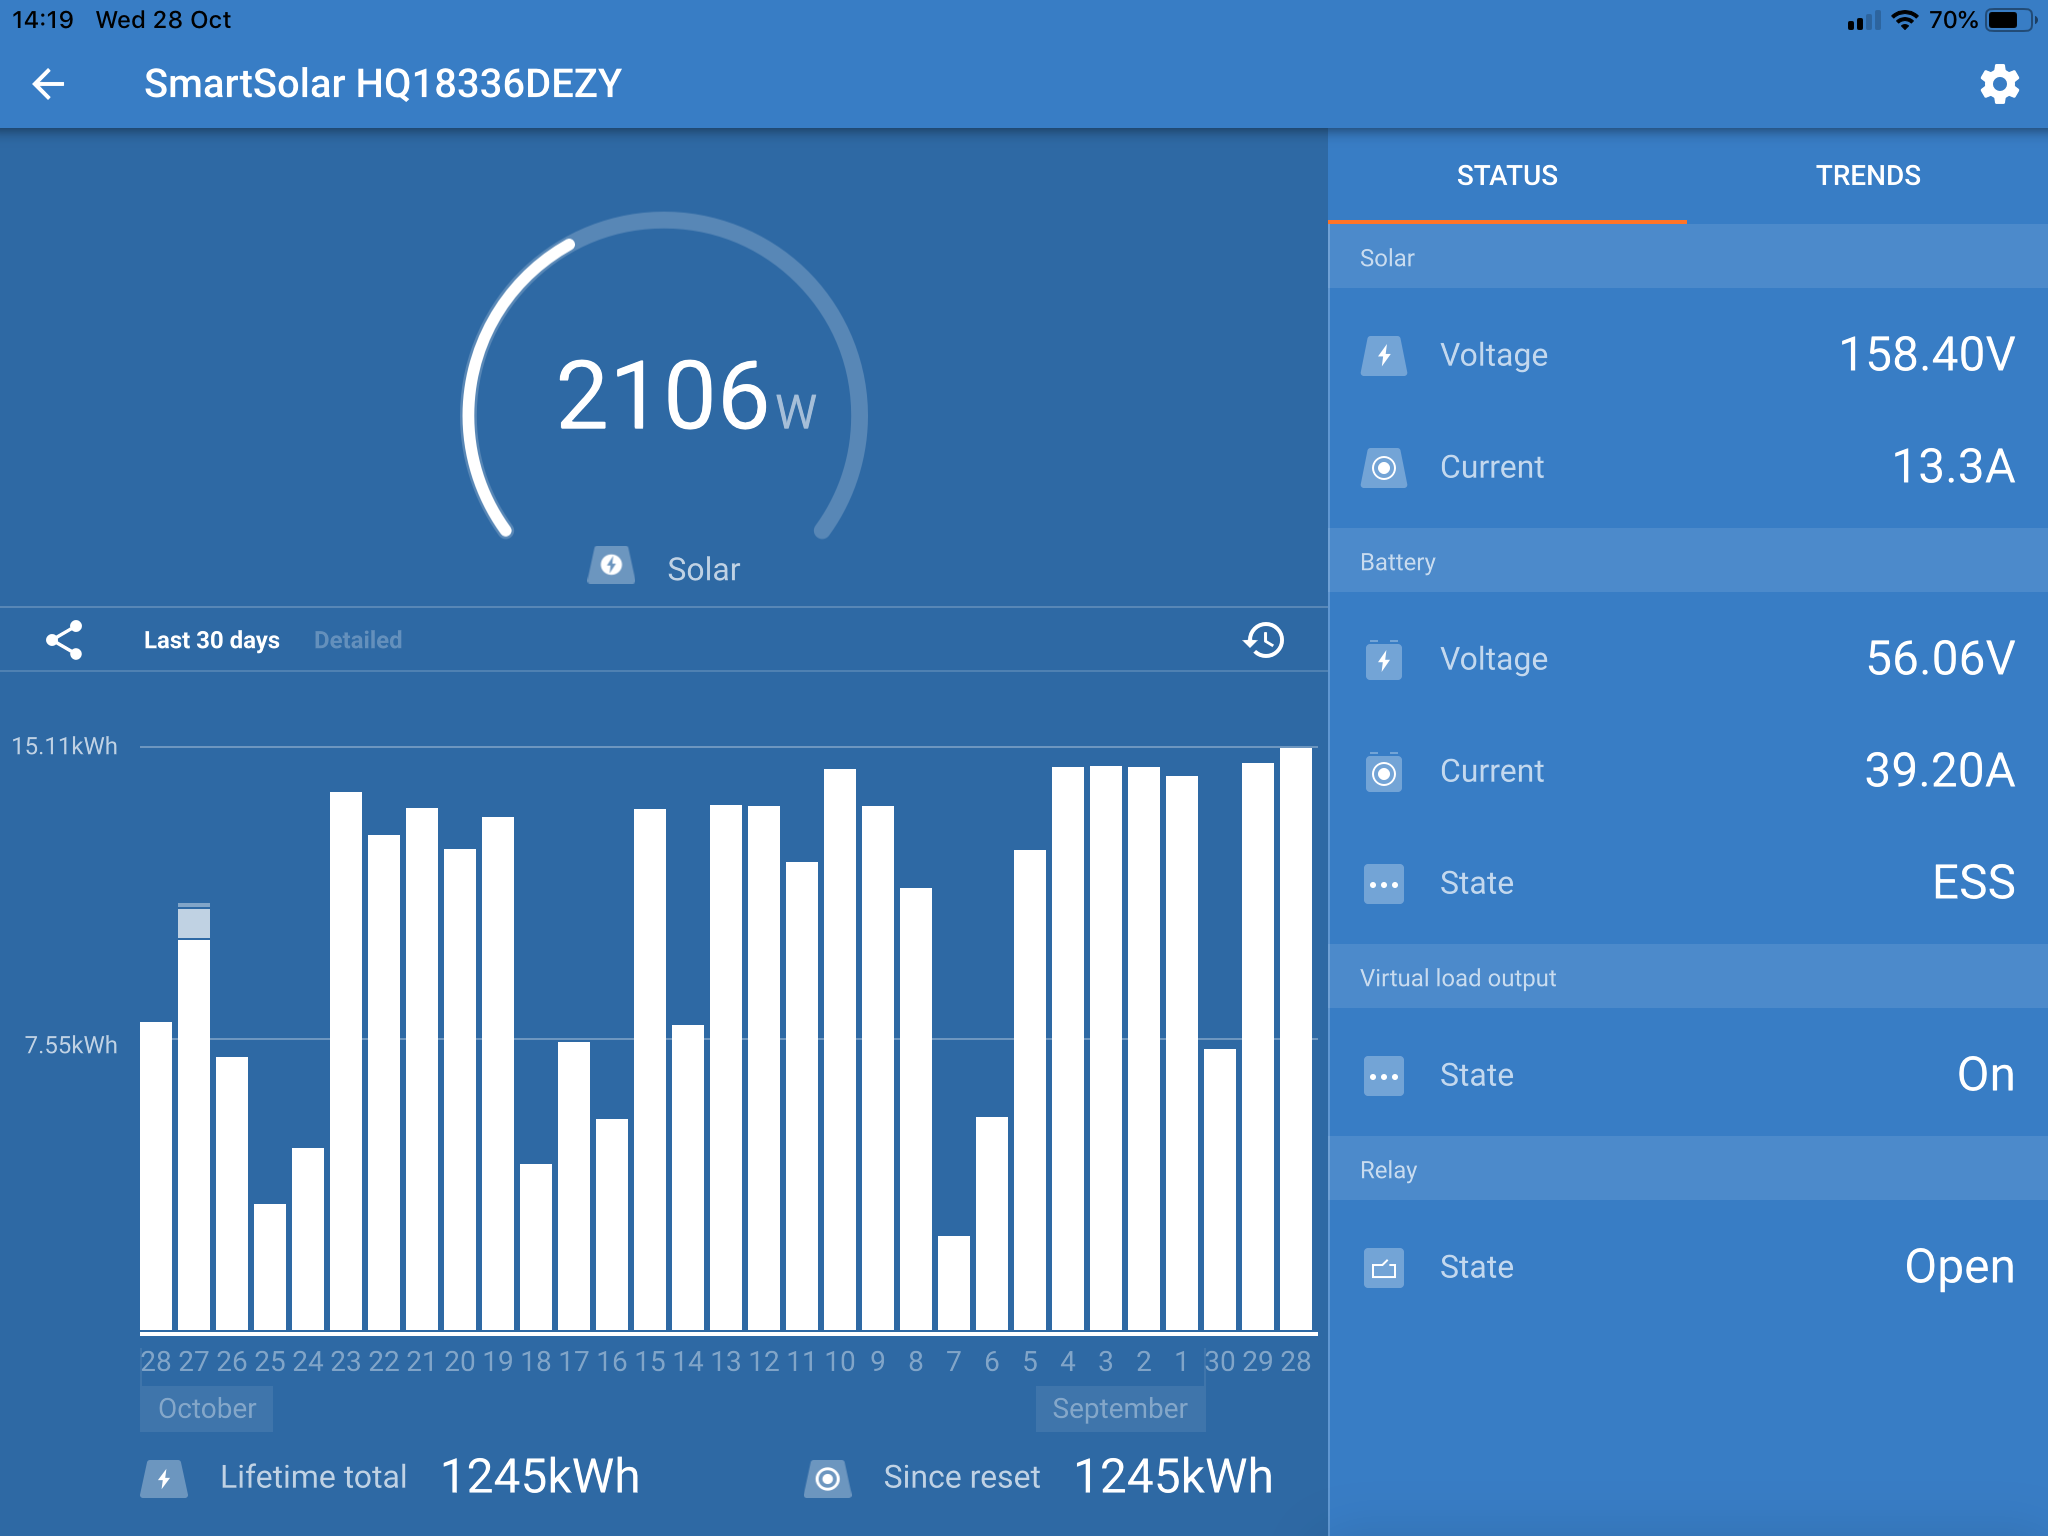
Michelle, can you go into the SmartSolar through Victron Connect and see what the V max figure is getting up to. I changed my solar to 5S 3P as I was getting very close to 250V and the weather wasn’t that cold in the mornings.

Looking for this page-

0 Likes 0 ·
misullivan avatar image misullivan commented ·

Already checked VoC on the coolest day of the year, still only 237v... nominal (when connected) is 206v... peaking under direct sun it runs up to 218v before it cuts... thought this was 250max?

0 Likes 0 ·
misullivan avatar image misullivan misullivan commented ·


That’s all I can get atm.. sun is coming and going today.. got the last 24 days of detail though...


0 Likes 0 ·
dan3i avatar image dan3i misullivan commented ·

Ya looking at those voltages your def not hitting any limits, id imagine the system would also alert you if such conditions existed. Ive never personally dealt with such a situation, good luck sorting it out

0 Likes 0 ·
misullivan avatar image misullivan dan3i commented ·

FWIW I did do all the calculations.. including the thermal environment adjustments for worst (coldest -5C) case then left a 10v+ overhead. If you do the full spec calculations with a -5C ambient taking into account manufacturing variance as worst case.. IIRc it works out to either 243v or 237v (done a few since so can’t remember which)... probably more diligent than most installers (most around here install fronius so they get to play Upto 800vdc)

0 Likes 0 ·
misullivan avatar image misullivan misullivan commented ·

https://www.willyweather.com.au/climate/weather-stations/nsw/illawarra/point-perpendicular.html?superGraph=plots:temperature,grain:daily,startDate:2020-09-29,endDate:2020-10-28&climateRecords=period:all-time&longTermGraph=plots:temperature,period:all-time,month:all&windRose=period:1-year,month:all-months


Lowest ever recorded temp was 4.7C :)

0 Likes 0 ·
Guy Stewart (Victron Community Manager) avatar image
Guy Stewart (Victron Community Manager) answered ·

Hi @misullivan

The MPPT disappearing from GX, sounds like a bad connection at least that is the easiest thing to inspect / fix. I would remove the VE.Direct cable from both ends, inspect the terminal pins for damage, and then re-insert / replace the cable.


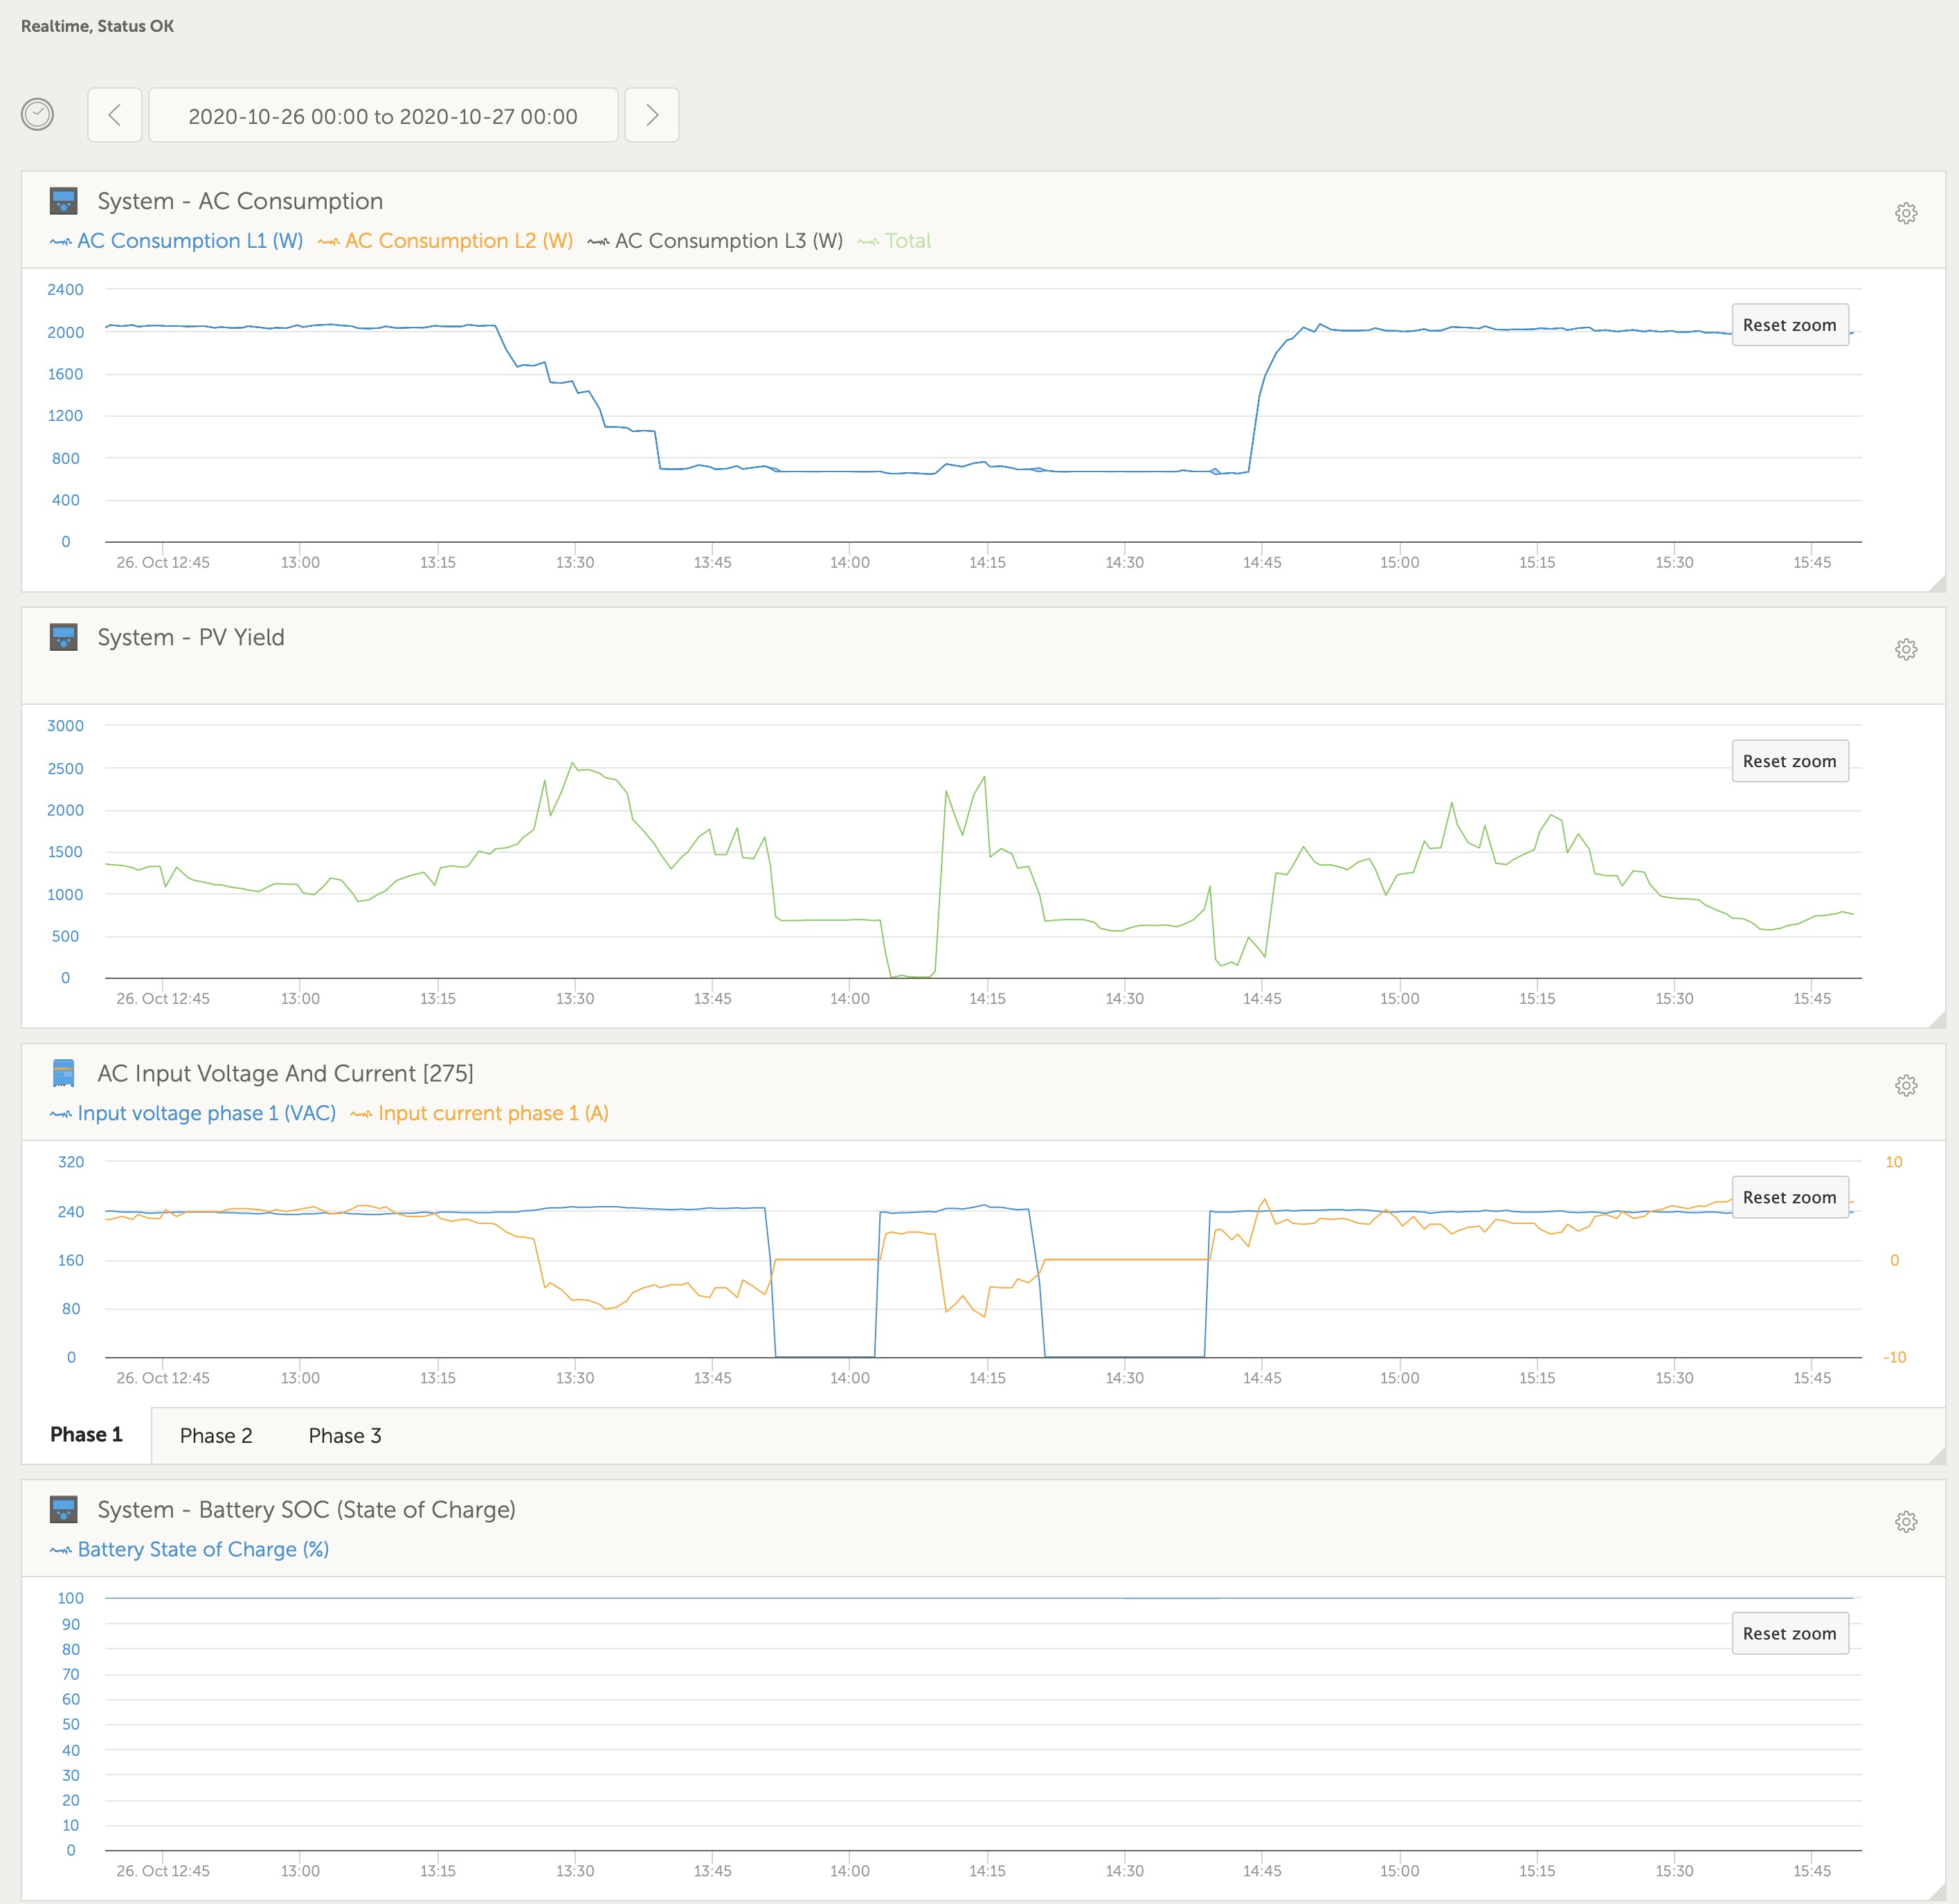
MPPT reducing power suddenly, I had a look at the VRM site for times when the MPPT output was dropping suddenly, and it appears to me that either the grid is dropping out, or your load is reduced suddenly for some reason, and the MPPT has to adapt and re-adjust with the batteries also picking up some of the load too.

As your ESS system is not exporting, the MPPT is a bit overly sensitive and reactive to changes in load when batteries are at 100%, and very little current is required to keep them at the target voltage. So battery over the target voltage is reflected in a sudden drop in MPPT output, and some time to readjust.

Enabling DC PV export (if allowed) would help smooth this out, but it also is fine for it to over-compensate and re-adjust.


12 comments
2 |3000

Up to 8 attachments (including images) can be used with a maximum of 190.8 MiB each and 286.6 MiB total.

misullivan avatar image misullivan commented ·

You may have looked when I took it off grid for a short time whilst doing some down stream maintenance... (Monday 26th) have a look at other days... it happens most commonly around 1-1:30pm (current daylight settings)... which is around Pmax for the angle at this time of year.

0 Likes 0 ·
misullivan avatar image misullivan misullivan commented ·

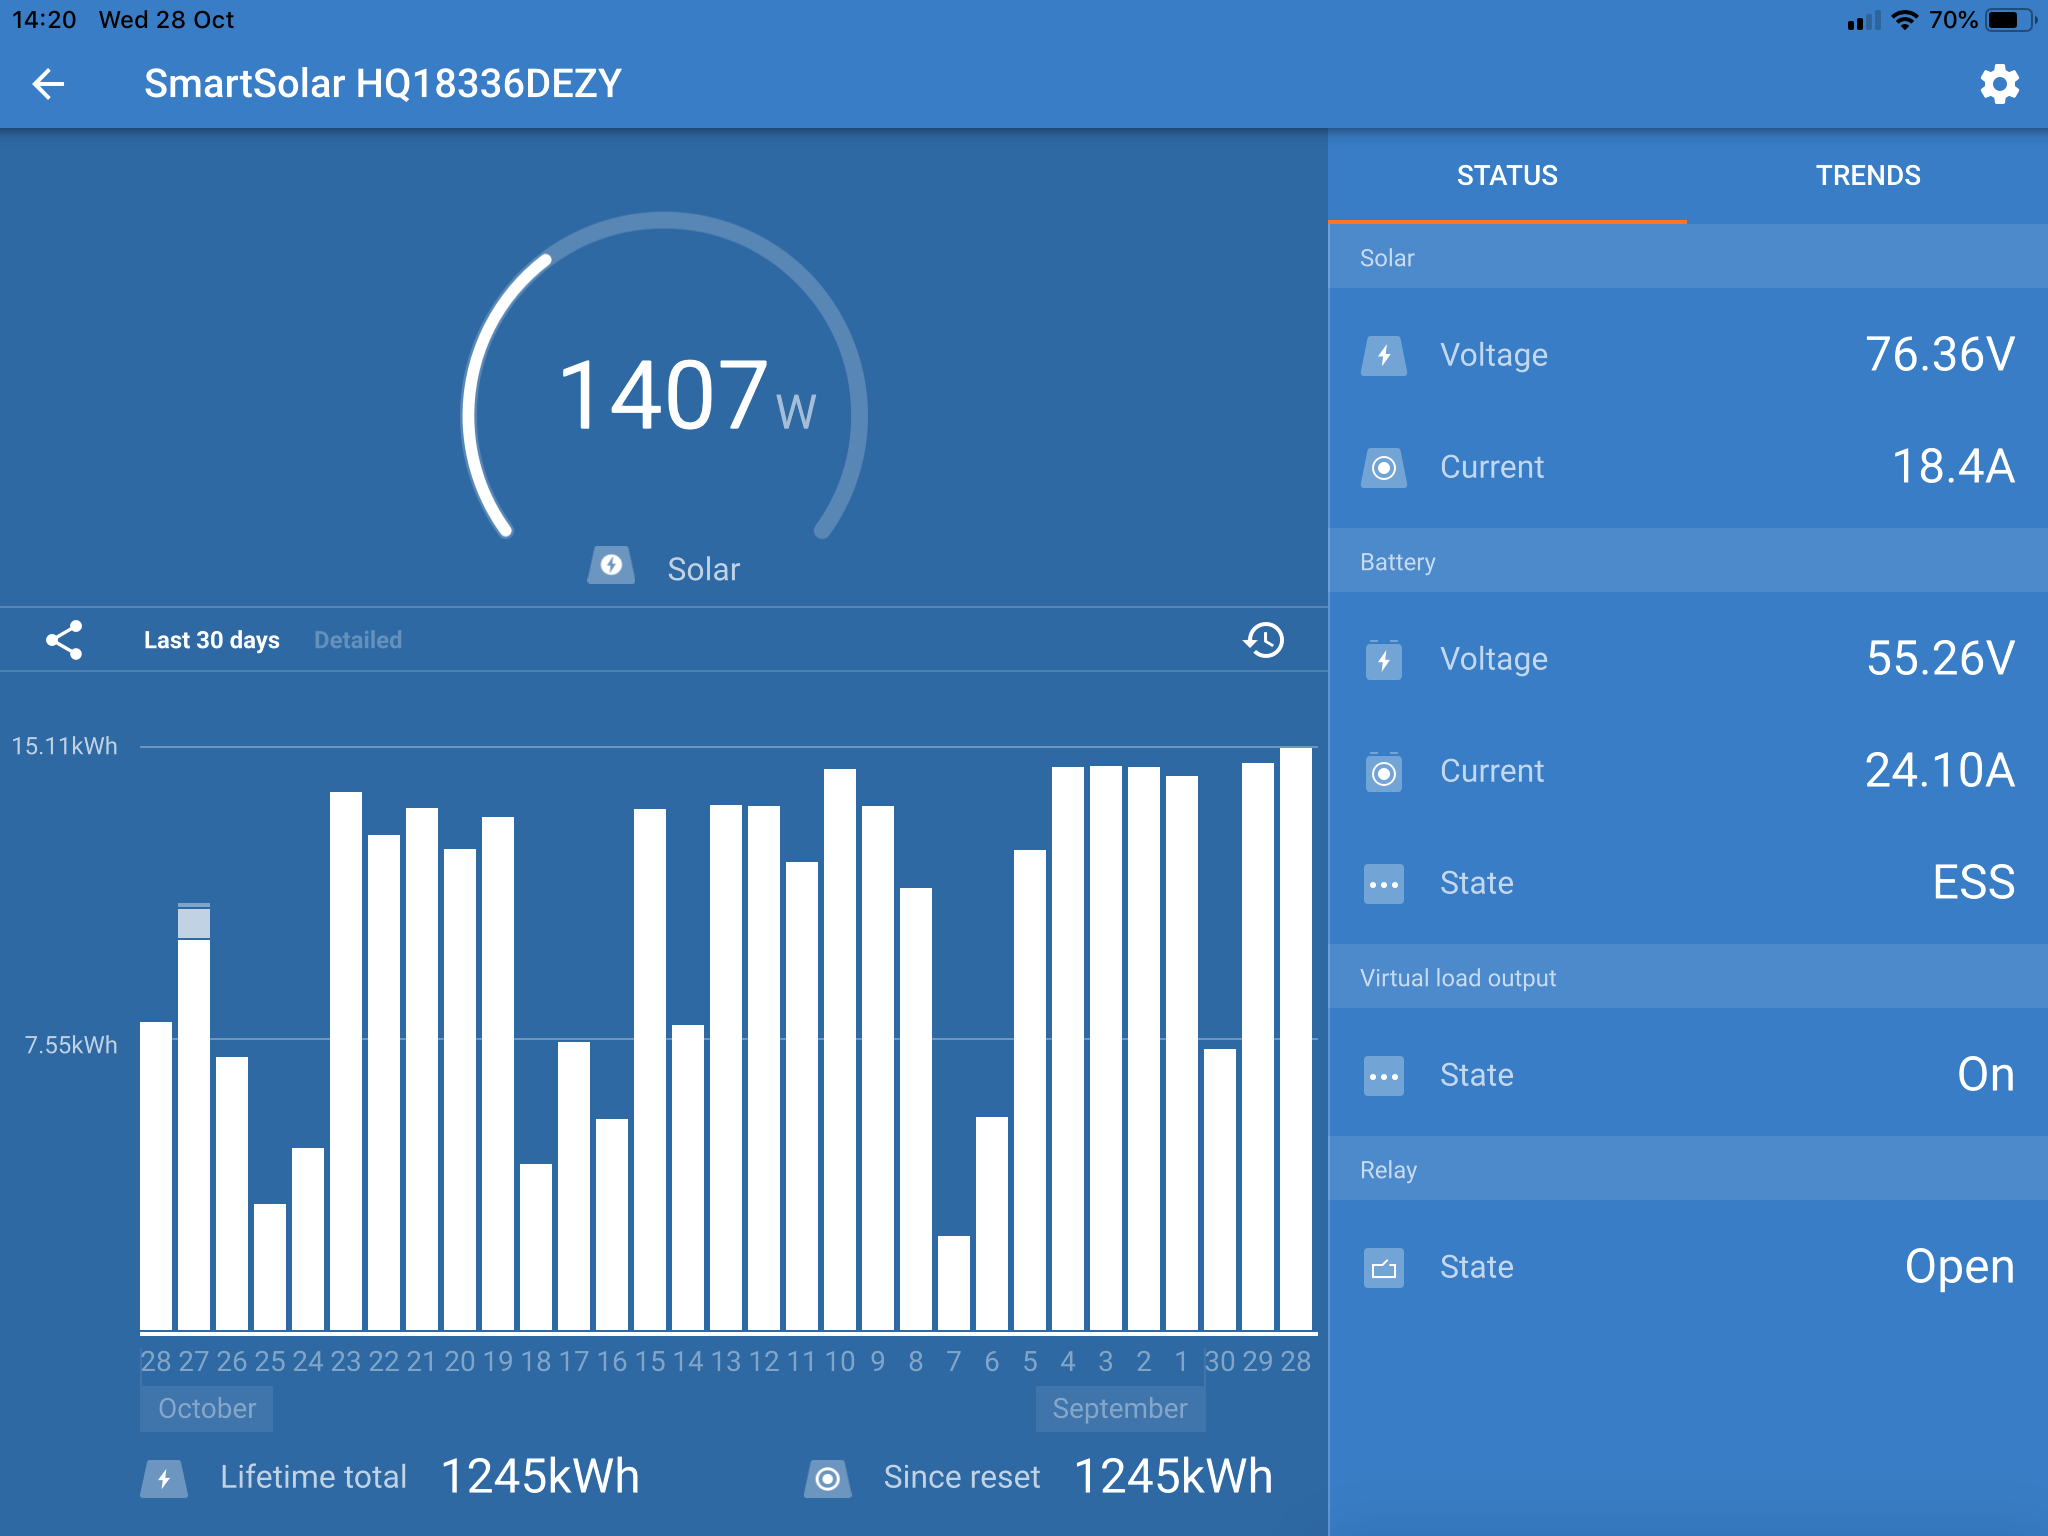
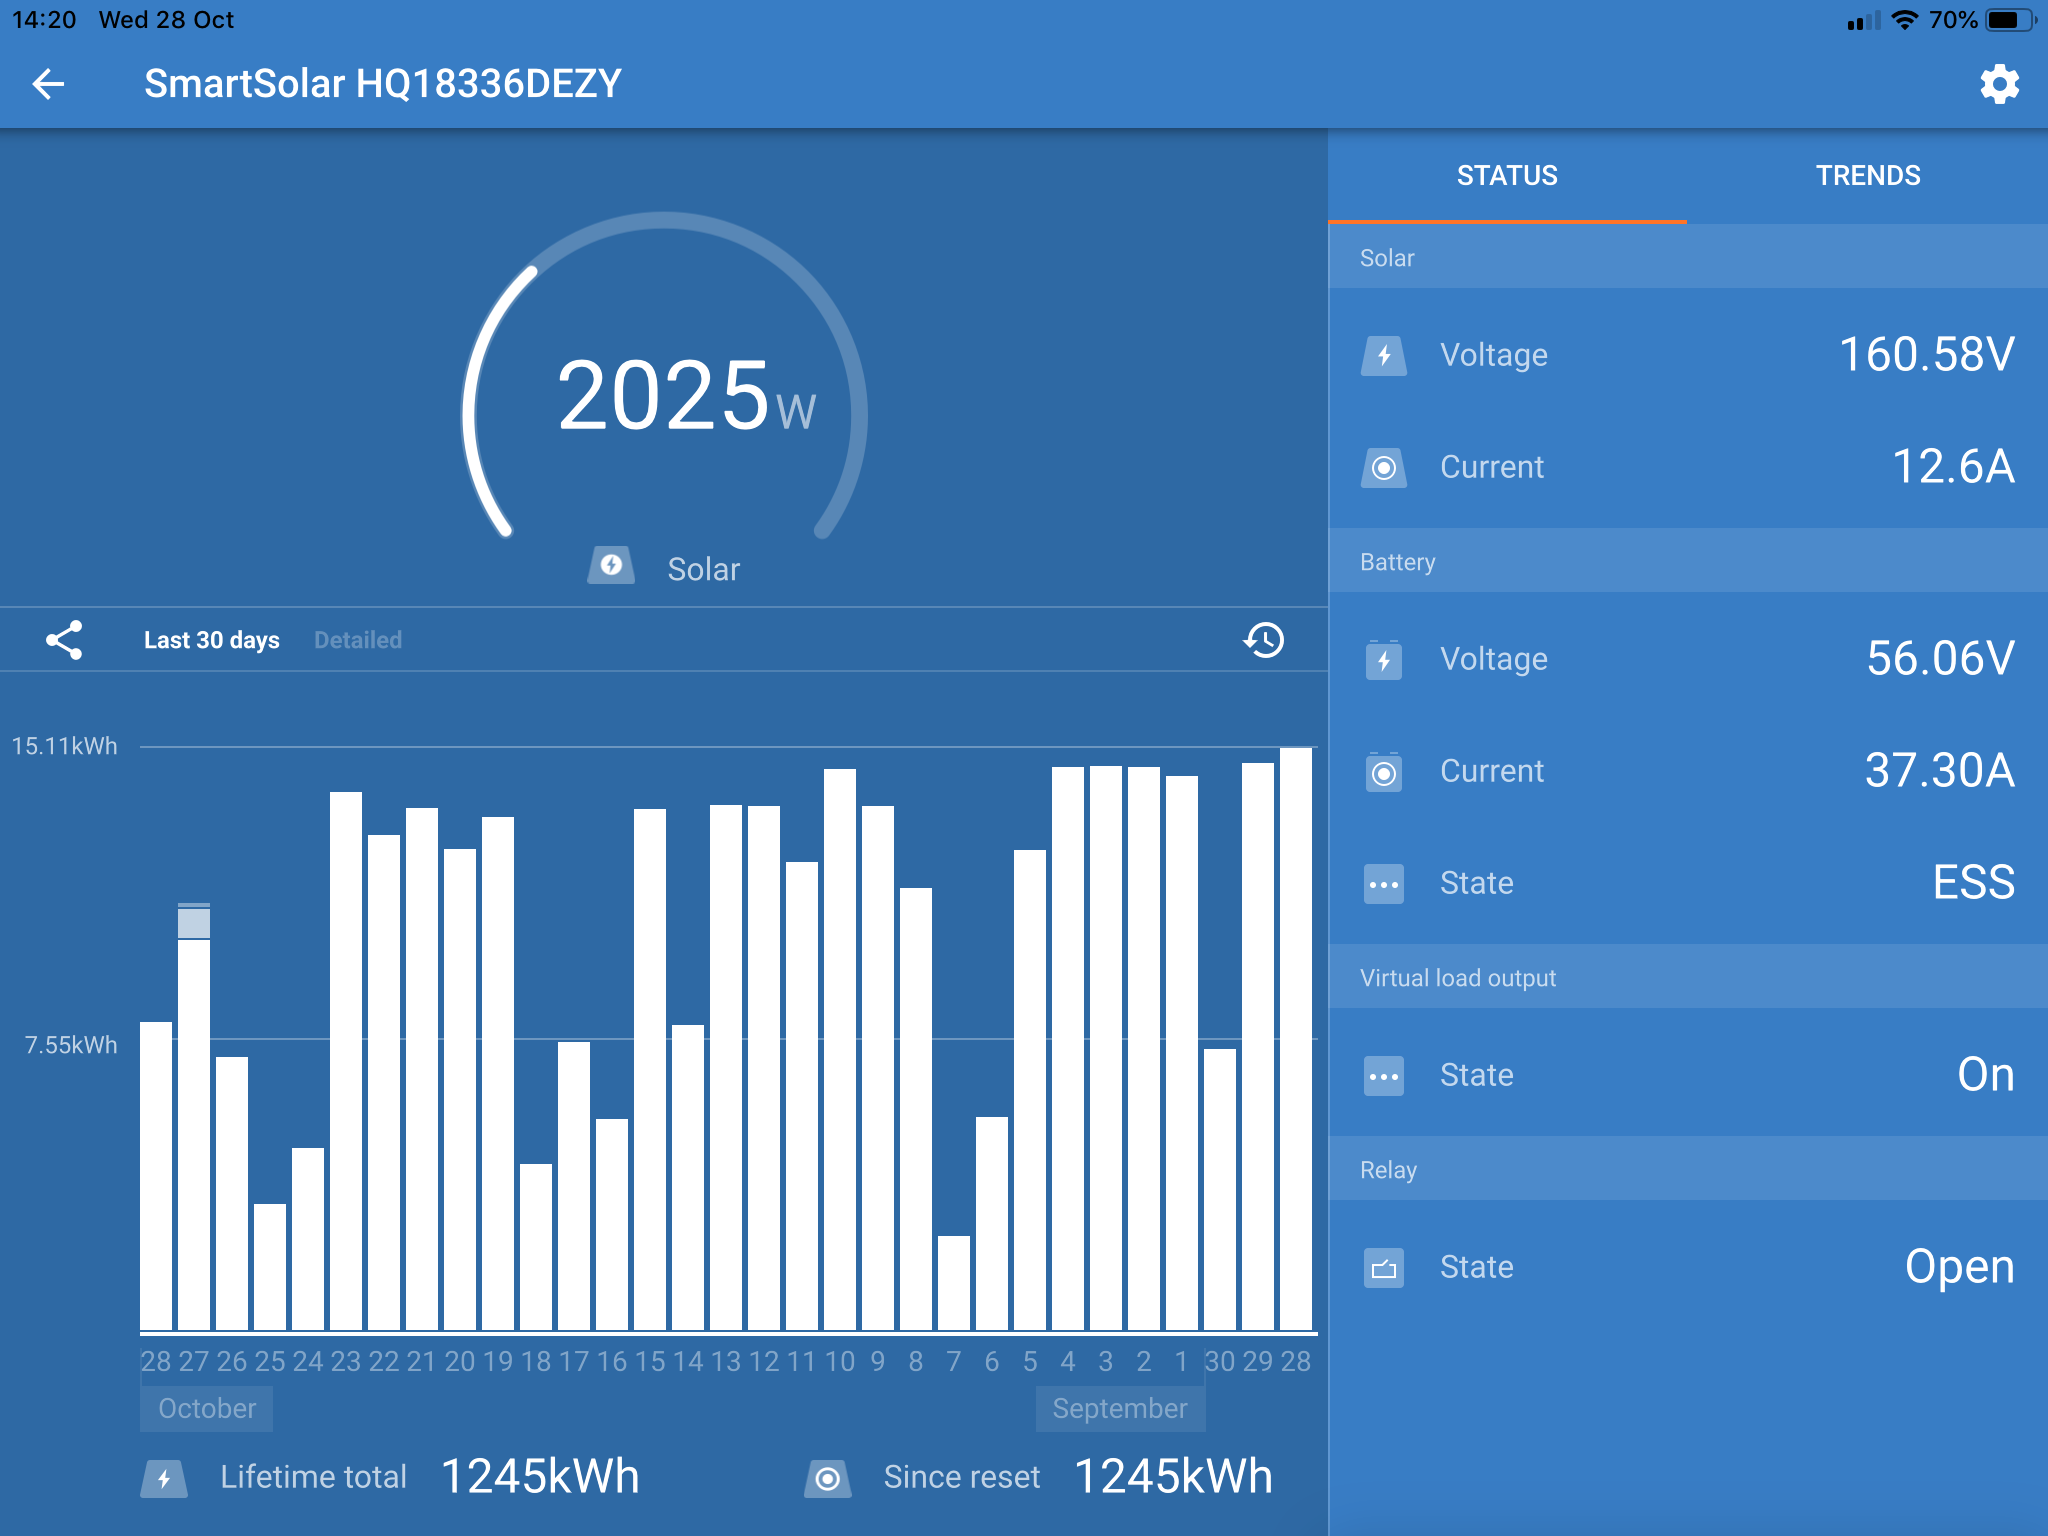
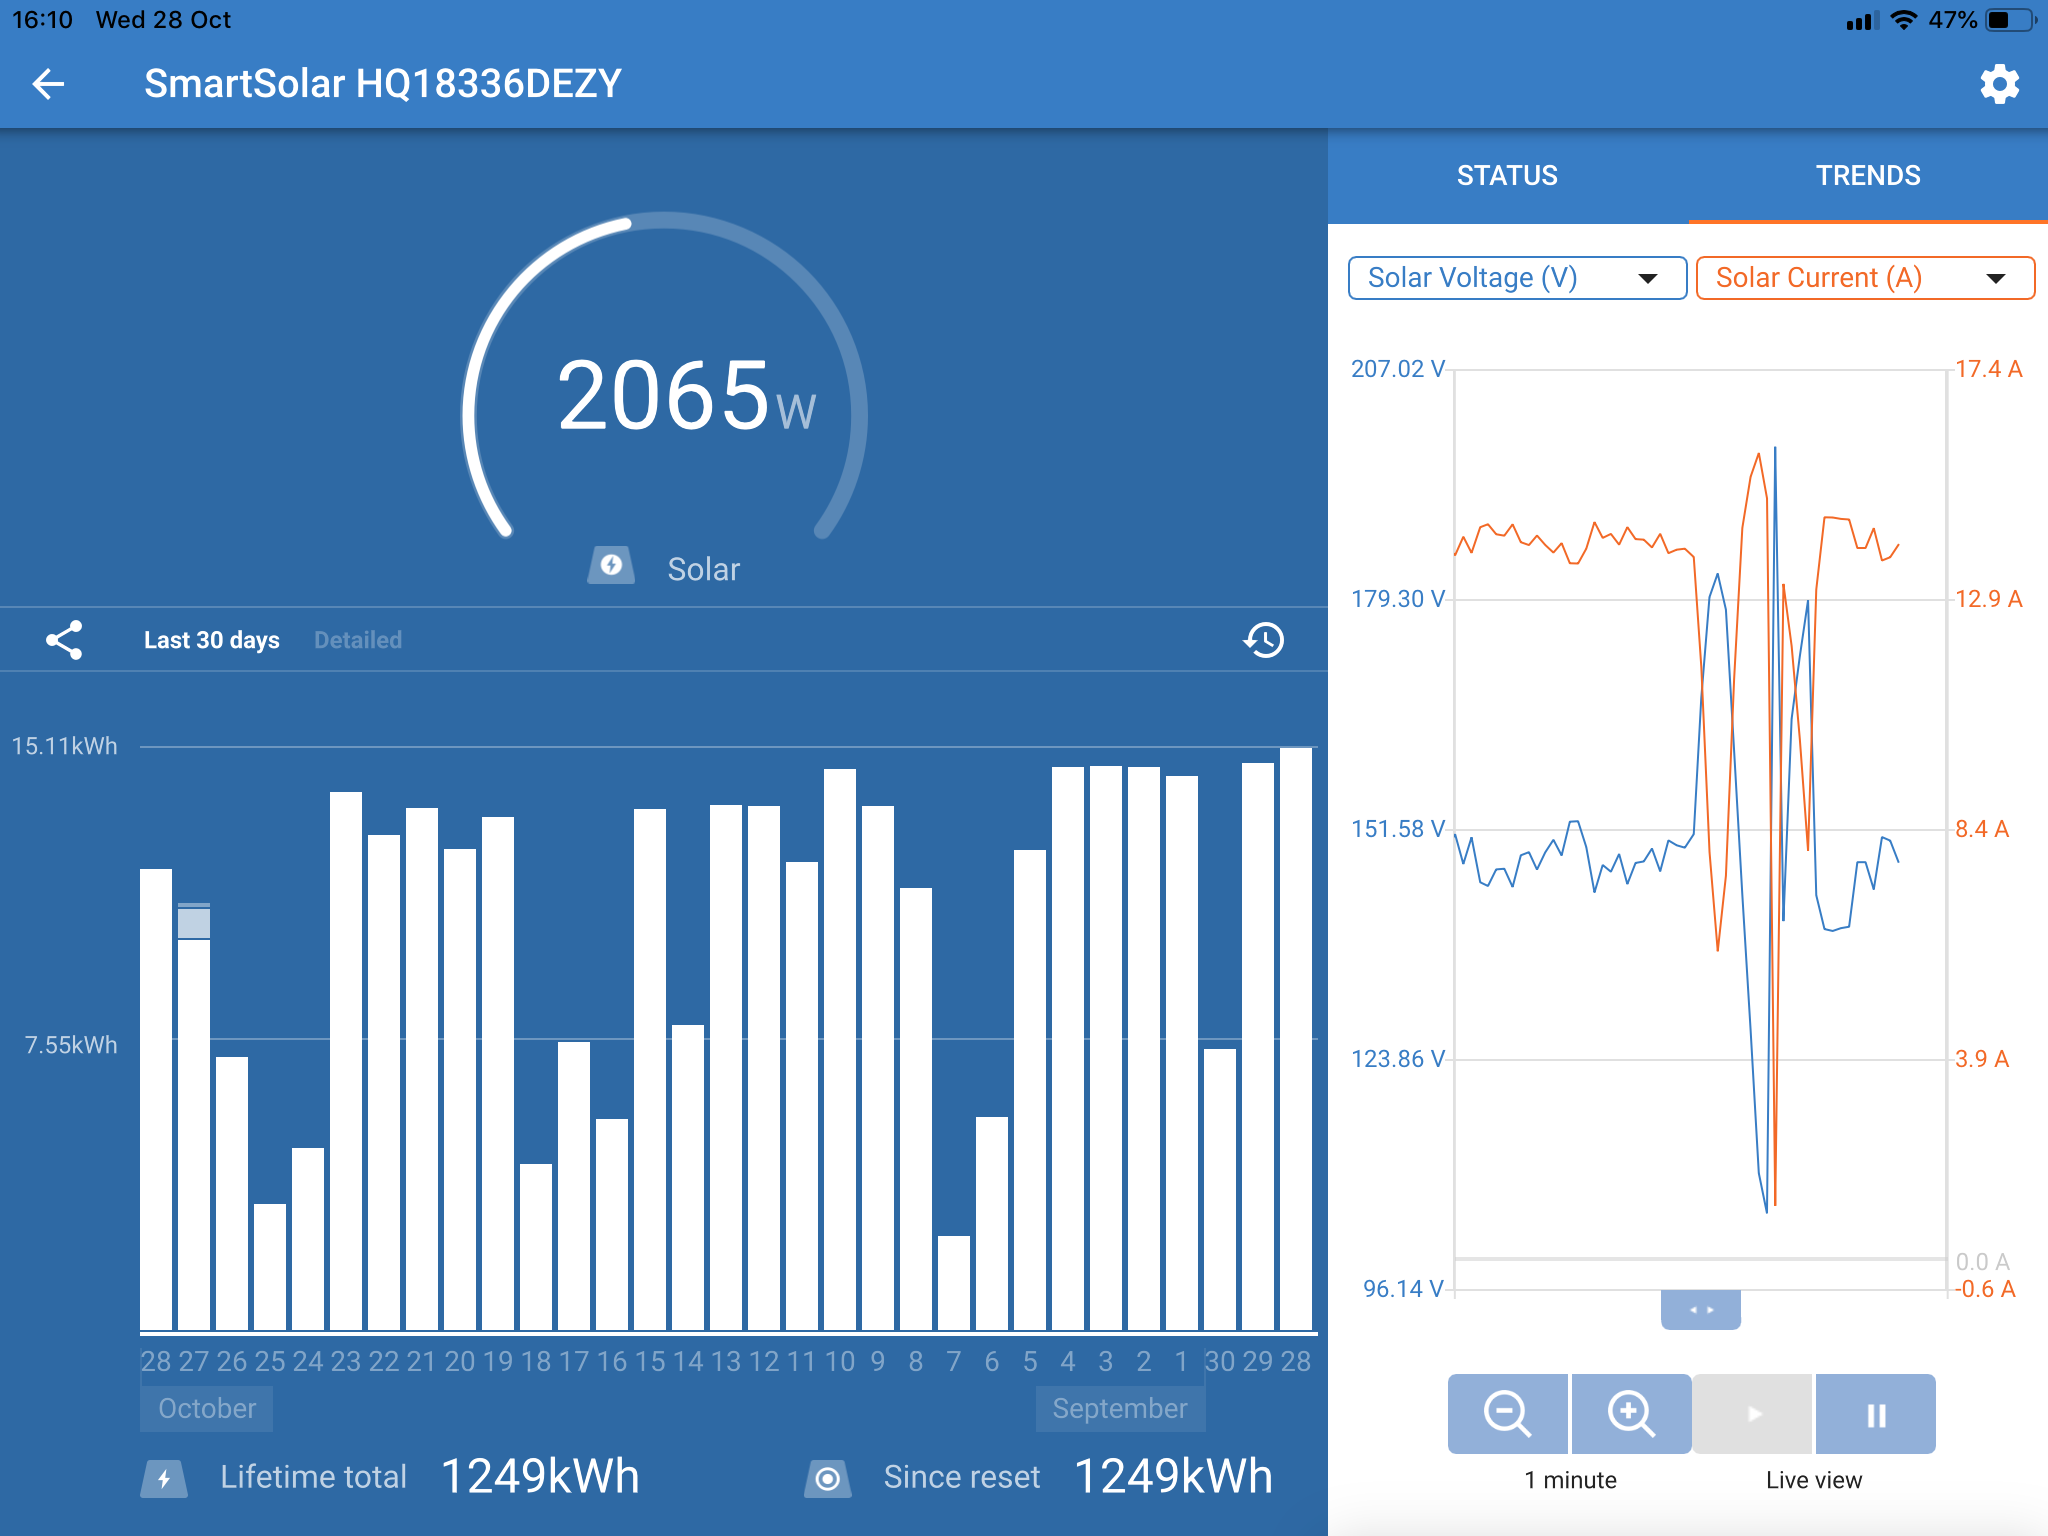
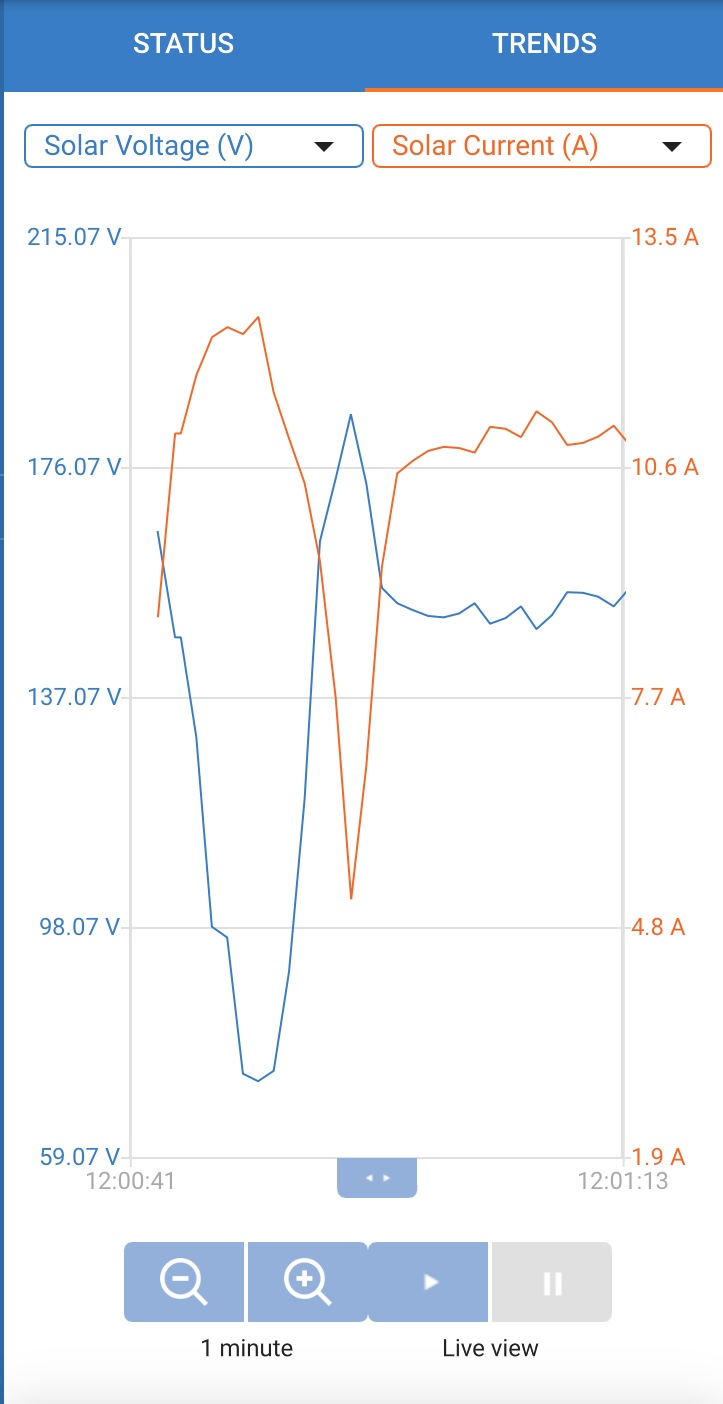
Based on observations it seems the drops/spikes happen when the MPPT tries a higher voltage and to some (lesser) extent a lower voltage.. just caught the tail end of one here... high (tail end recovery), normal, low... will do it every so often... (not in the correct order.. damn iPad!)


As for the loss of communication don’t think it’s the lead.. it didn’t do it before the BVM was connected... normally the solar drops out.. yesterday (for the first time) after the reboot it couldn’t see the multiplus... as a programmer my thoughts are device I’d negotiation failed.. like in the old days when you had sound cards and parallel ports on the same Irq.. some worked, some never worked.. some worked most of the time...


Regards,


Michelle

0 Likes 0 ·
misullivan avatar image misullivan misullivan commented ·

Got a “high side” just as it was loading...


0 Likes 0 ·
Guy Stewart (Victron Community Manager) avatar image Guy Stewart (Victron Community Manager) ♦♦ misullivan commented ·

The 'trends' view might be useful here.

0 Likes 0 ·
misullivan avatar image misullivan Guy Stewart (Victron Community Manager) ♦♦ commented ·

It would.. if it’s sunny tomorrow will endeavour to capture.. its sunny and clear now but Pmax has past (and I only see it at Pmax.

0 Likes 0 ·
misullivan avatar image misullivan misullivan commented ·

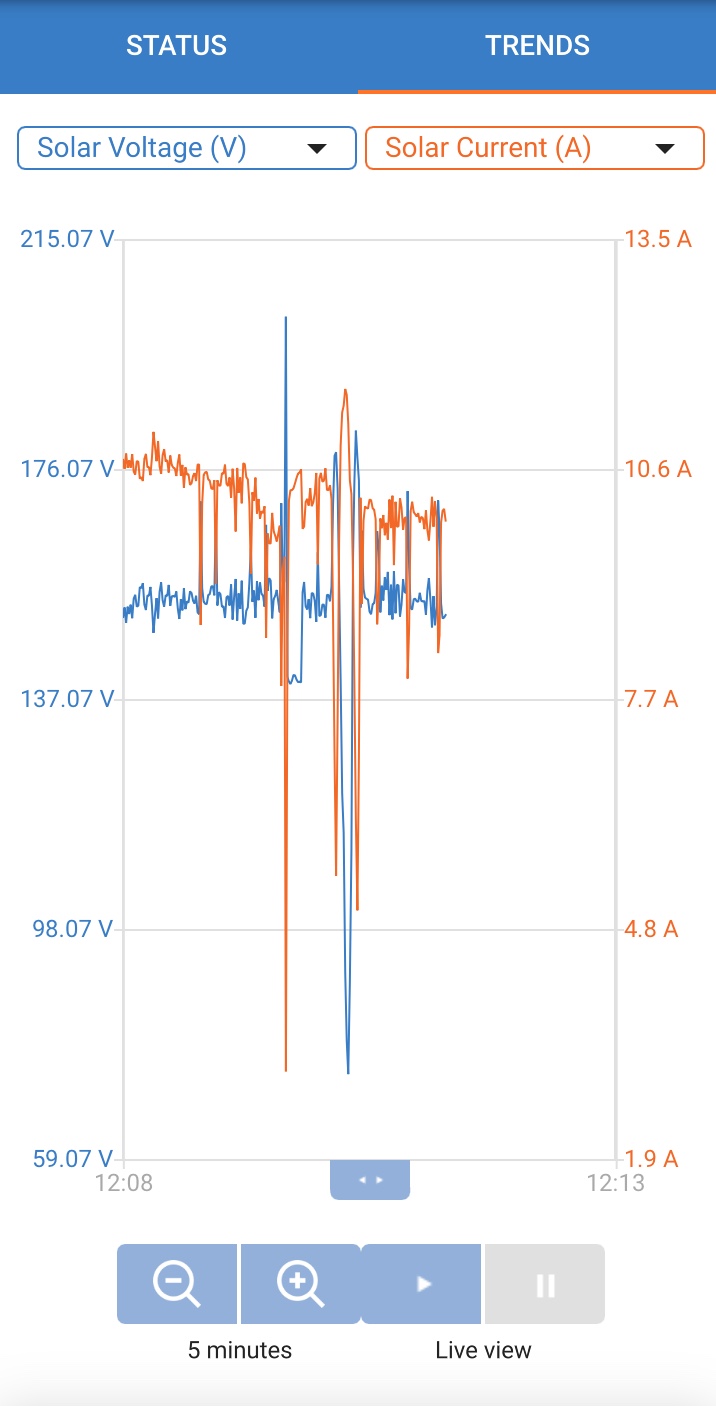
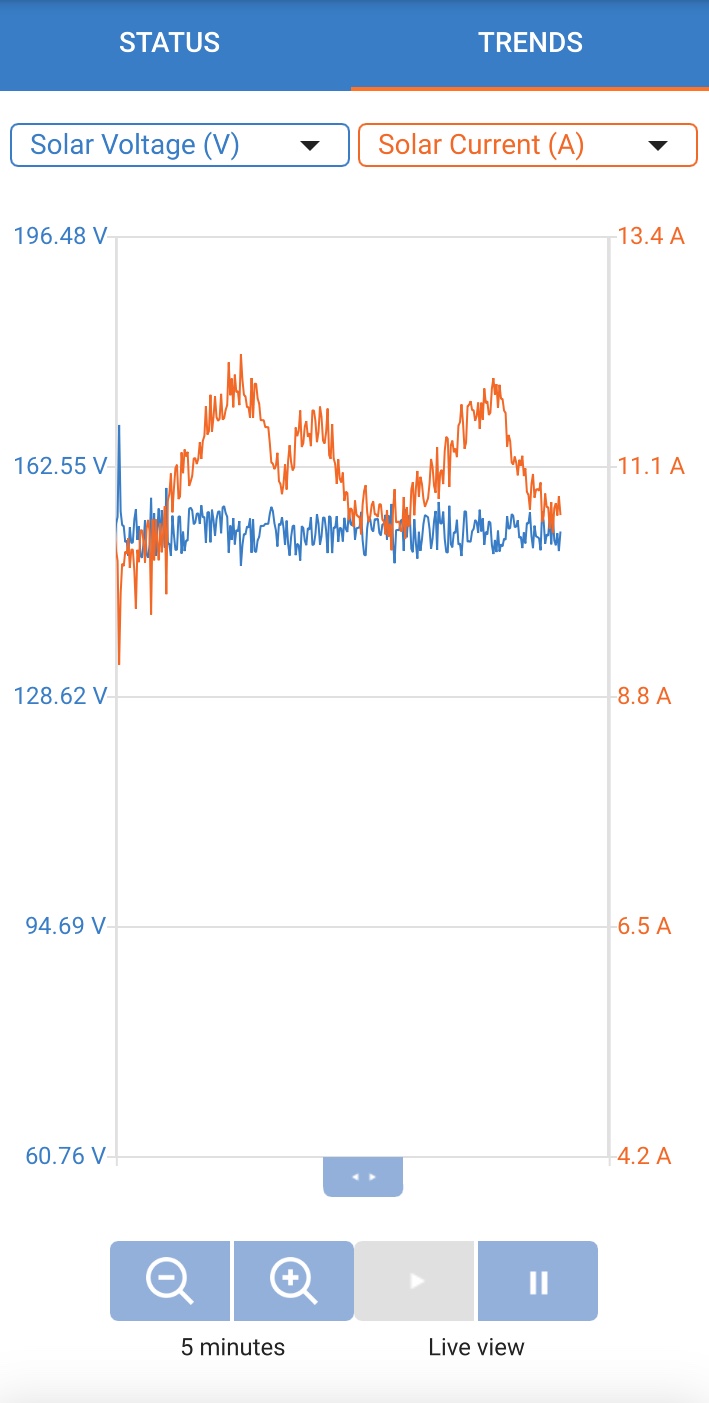
Spoke too soon.. just did it again... trends view :)

0 Likes 0 ·
JohnC avatar image JohnC ♦ misullivan commented ·

@misullivan

That trends graph looks awfully like the mppt tracking, although mine doesn't take quite that long.

It will do this every 10 minutes if it is trying to reach Abs/Float, but won't do it if solar power is being throttled.

This might not be your issue, but you should be able to see that tracking clearly if you set the graph to say 2 hours. So you won't confuse it with something else that might be happening..

0 Likes 0 ·
misullivan avatar image misullivan JohnC ♦ commented ·

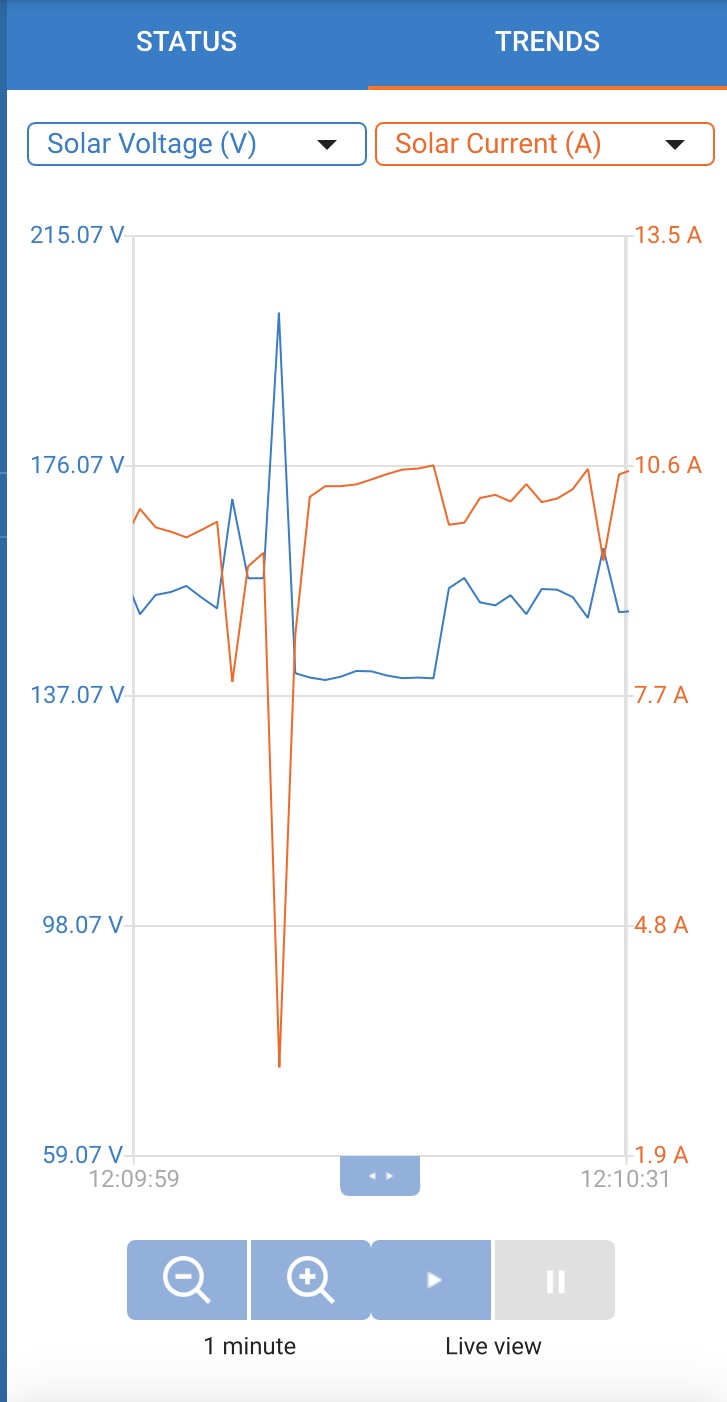
Battery SoC 100%.. ESS is on though.. and yes my thought was MPPT.. but is goes absolutely wild for a second or two.. the higher the power available the worse it gets... looks to me like it just suddenly tries to retrain the MPPT from max and min voltages to work out where it should be.. which considering it almost always goes back to where it started from it seems a little excessive. The load is mostly constant being it’s all computers (servers) that average 2kw 24x7.. (mostly because cooling fans spin up and down based on CPU and enclosure temps etc...)

0 Likes 0 ·
misullivan avatar image misullivan JohnC ♦ commented ·

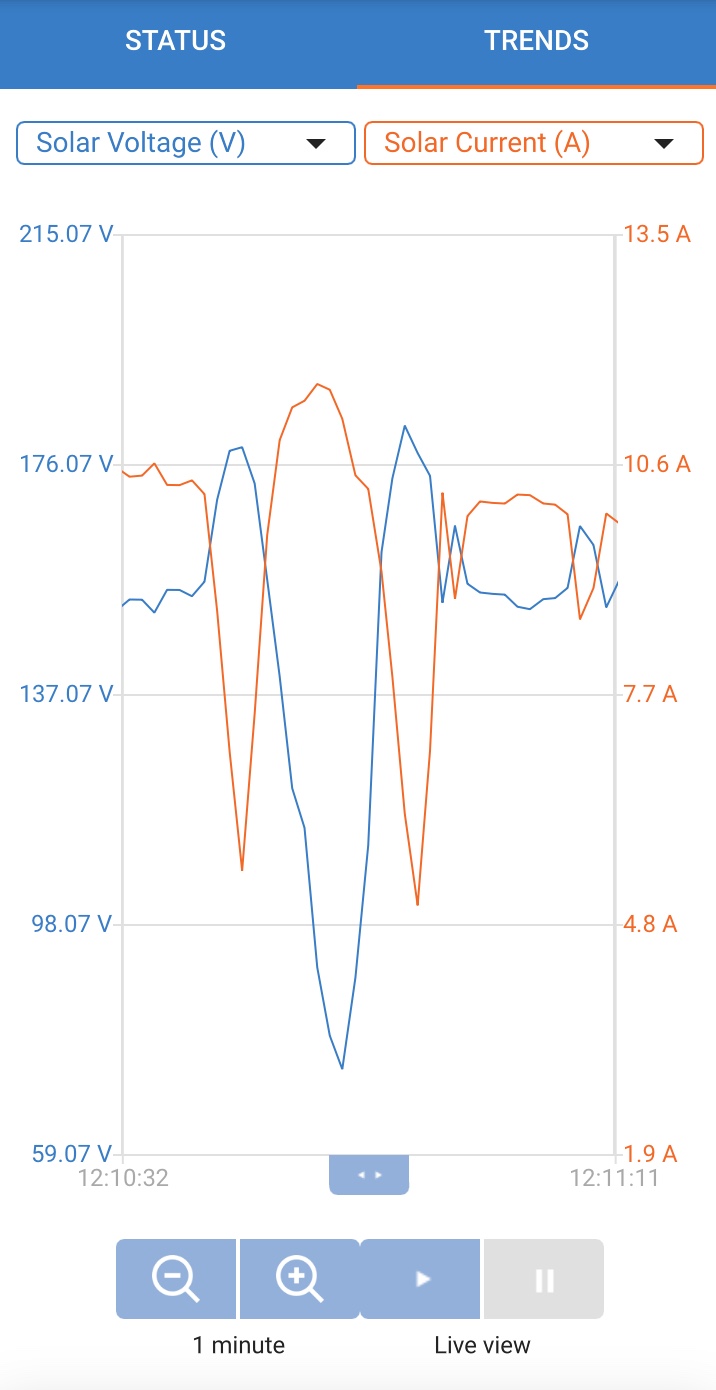
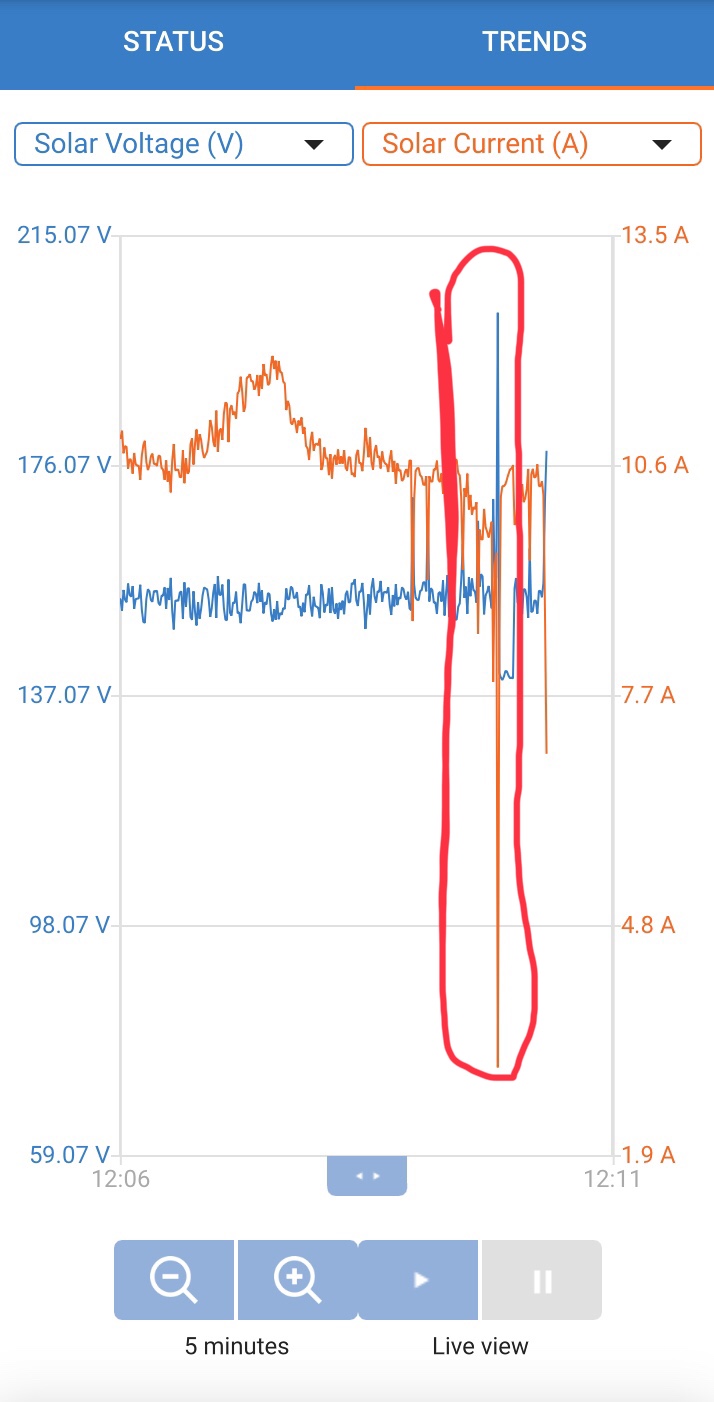
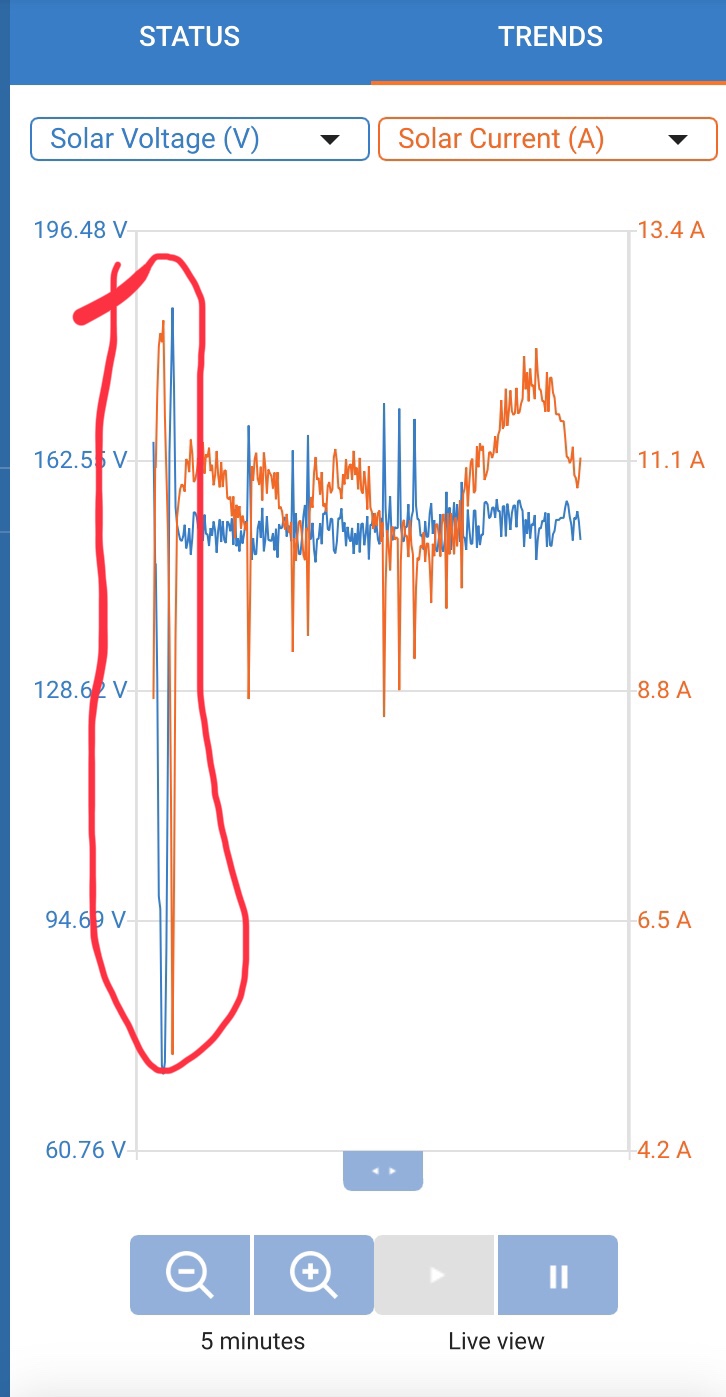
Here’s some more trends... I’ve marked my are of concern which I keep seeing... you’ll note the other smaller spikes.. this I can see easily being MPP tracking and/or something like a bird flying over the panels etc... today is a hazy but cloudless day at the moment so sun strength should be the same.. no trees/shadows anywhere near the panels.


If it is normal MPPT, great I learned something, but to me at the moment it looks like a problem.. the rest looks very much normal MPPT operation as I’d expect to see.

0 Likes 0 ·
misullivan avatar image misullivan misullivan commented ·

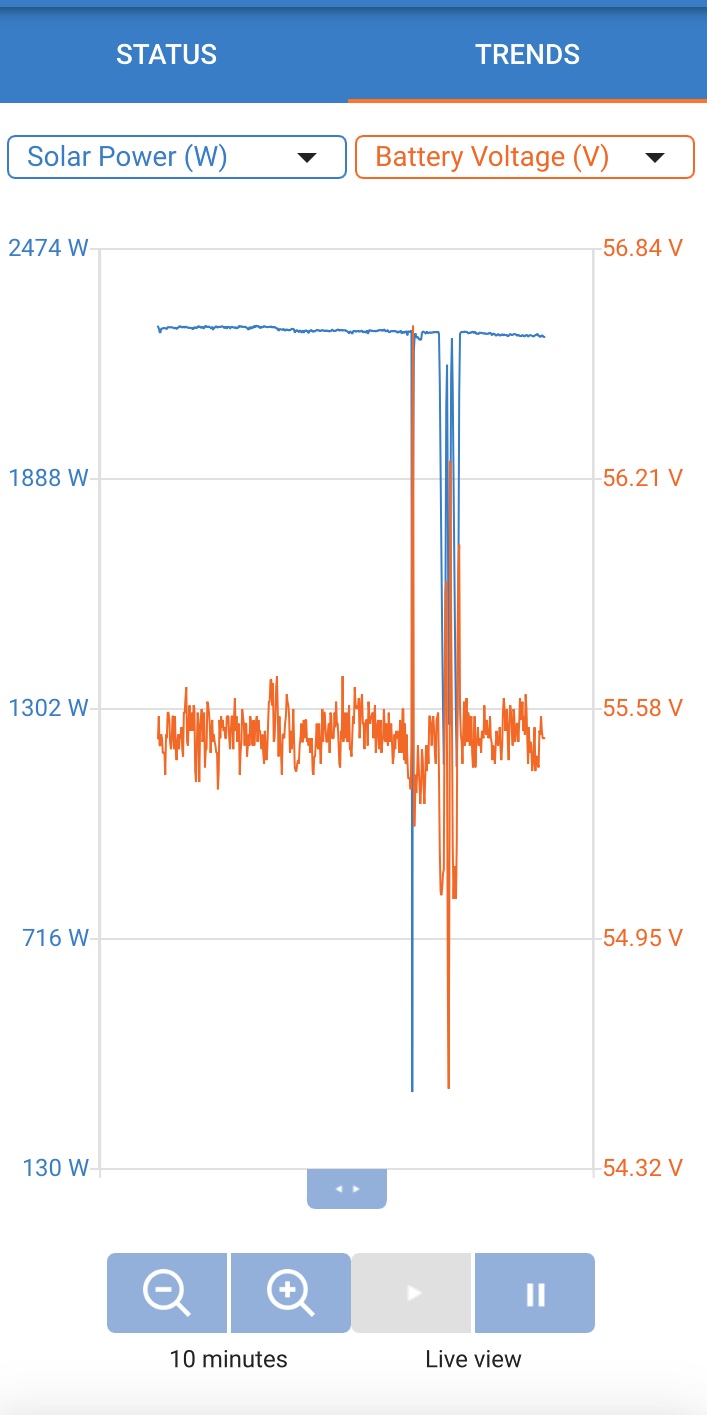
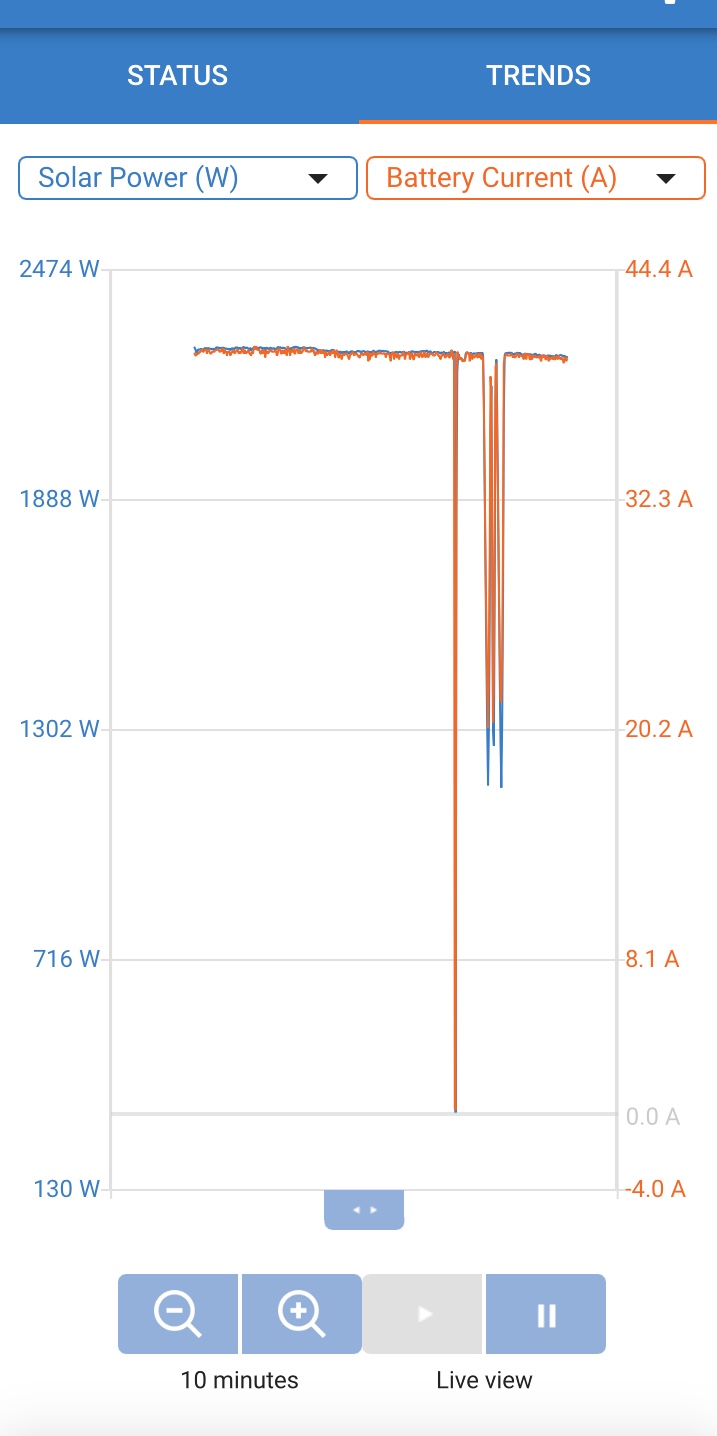
This is possibly more enlightening...


(No clouds)

0 Likes 0 ·
JohnC avatar image JohnC ♦ misullivan commented ·

@misullivan

This is my 150/100 today (a foul cloudy day):

1604031744719.png

You can clearly see the tracking spikes every 10 minutes. The next screen is the last spike expanded:

1604031910361.png

I didn't use W, but you get the idea.. see this and you can safely eliminate as being normal, and to be expected.

0 Likes 0 ·
1604031744719.png (286.1 KiB)
1604031910361.png (233.7 KiB)
misullivan avatar image misullivan JohnC ♦ commented ·
I will do a two hour run on the charger tomorrow and check that - but ok... it's surprising to me, but hey, I learned something, thank you for taking the time!


0 Likes 0 ·