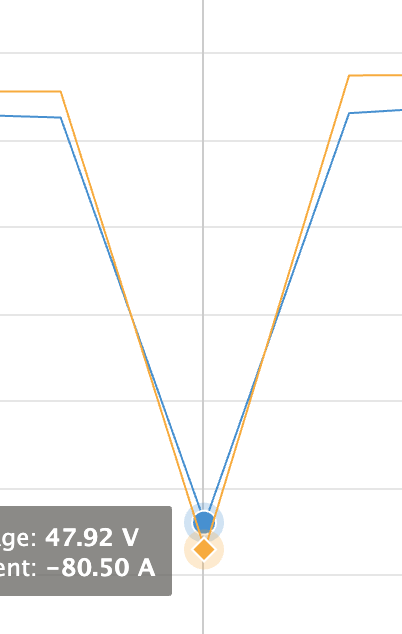
Hi, I installed a Venus GX to monitor a solar system, it works very well and I found the problem... the customer was sucking -80amps @ 50v (yes 4kw !) using the system to make tea and toast at the same time !
The system overloaded and shutdown (funny that !) so it was maybe only at 4kw for 10-15 seconds.
The strange thing is... a few hours later I logged in and the -80amps was clearly depicted on the V/A graph, clear as day and a pleasure to see.
But when I go back in to show the customer the logging, the particular -80amps plot is not there anymore, all of the days data is there, I am familiar with logging software I have triple checked the dates, times etc, I have stretched out the data to the hour that it was covered in, I have downloaded and reviewed the xls file,
But there are no xls timing gaps, there are no graphical gaps, it is like the software has 'smoothed' the 10-15 seconds of -80amps down to a more consistent -10amps for that time of the day.
How I wish I had taken a screenshot.... and now I'm even questioning did I really see it !
NB the shutdown was an Outback Inverter so there is no Victron error log, likewise no low battery alerts as none were set.
Appreciate any comments.

