question

nigelw avatar image
nigelw asked

Grid export shows as self consumption in VRM

Hi

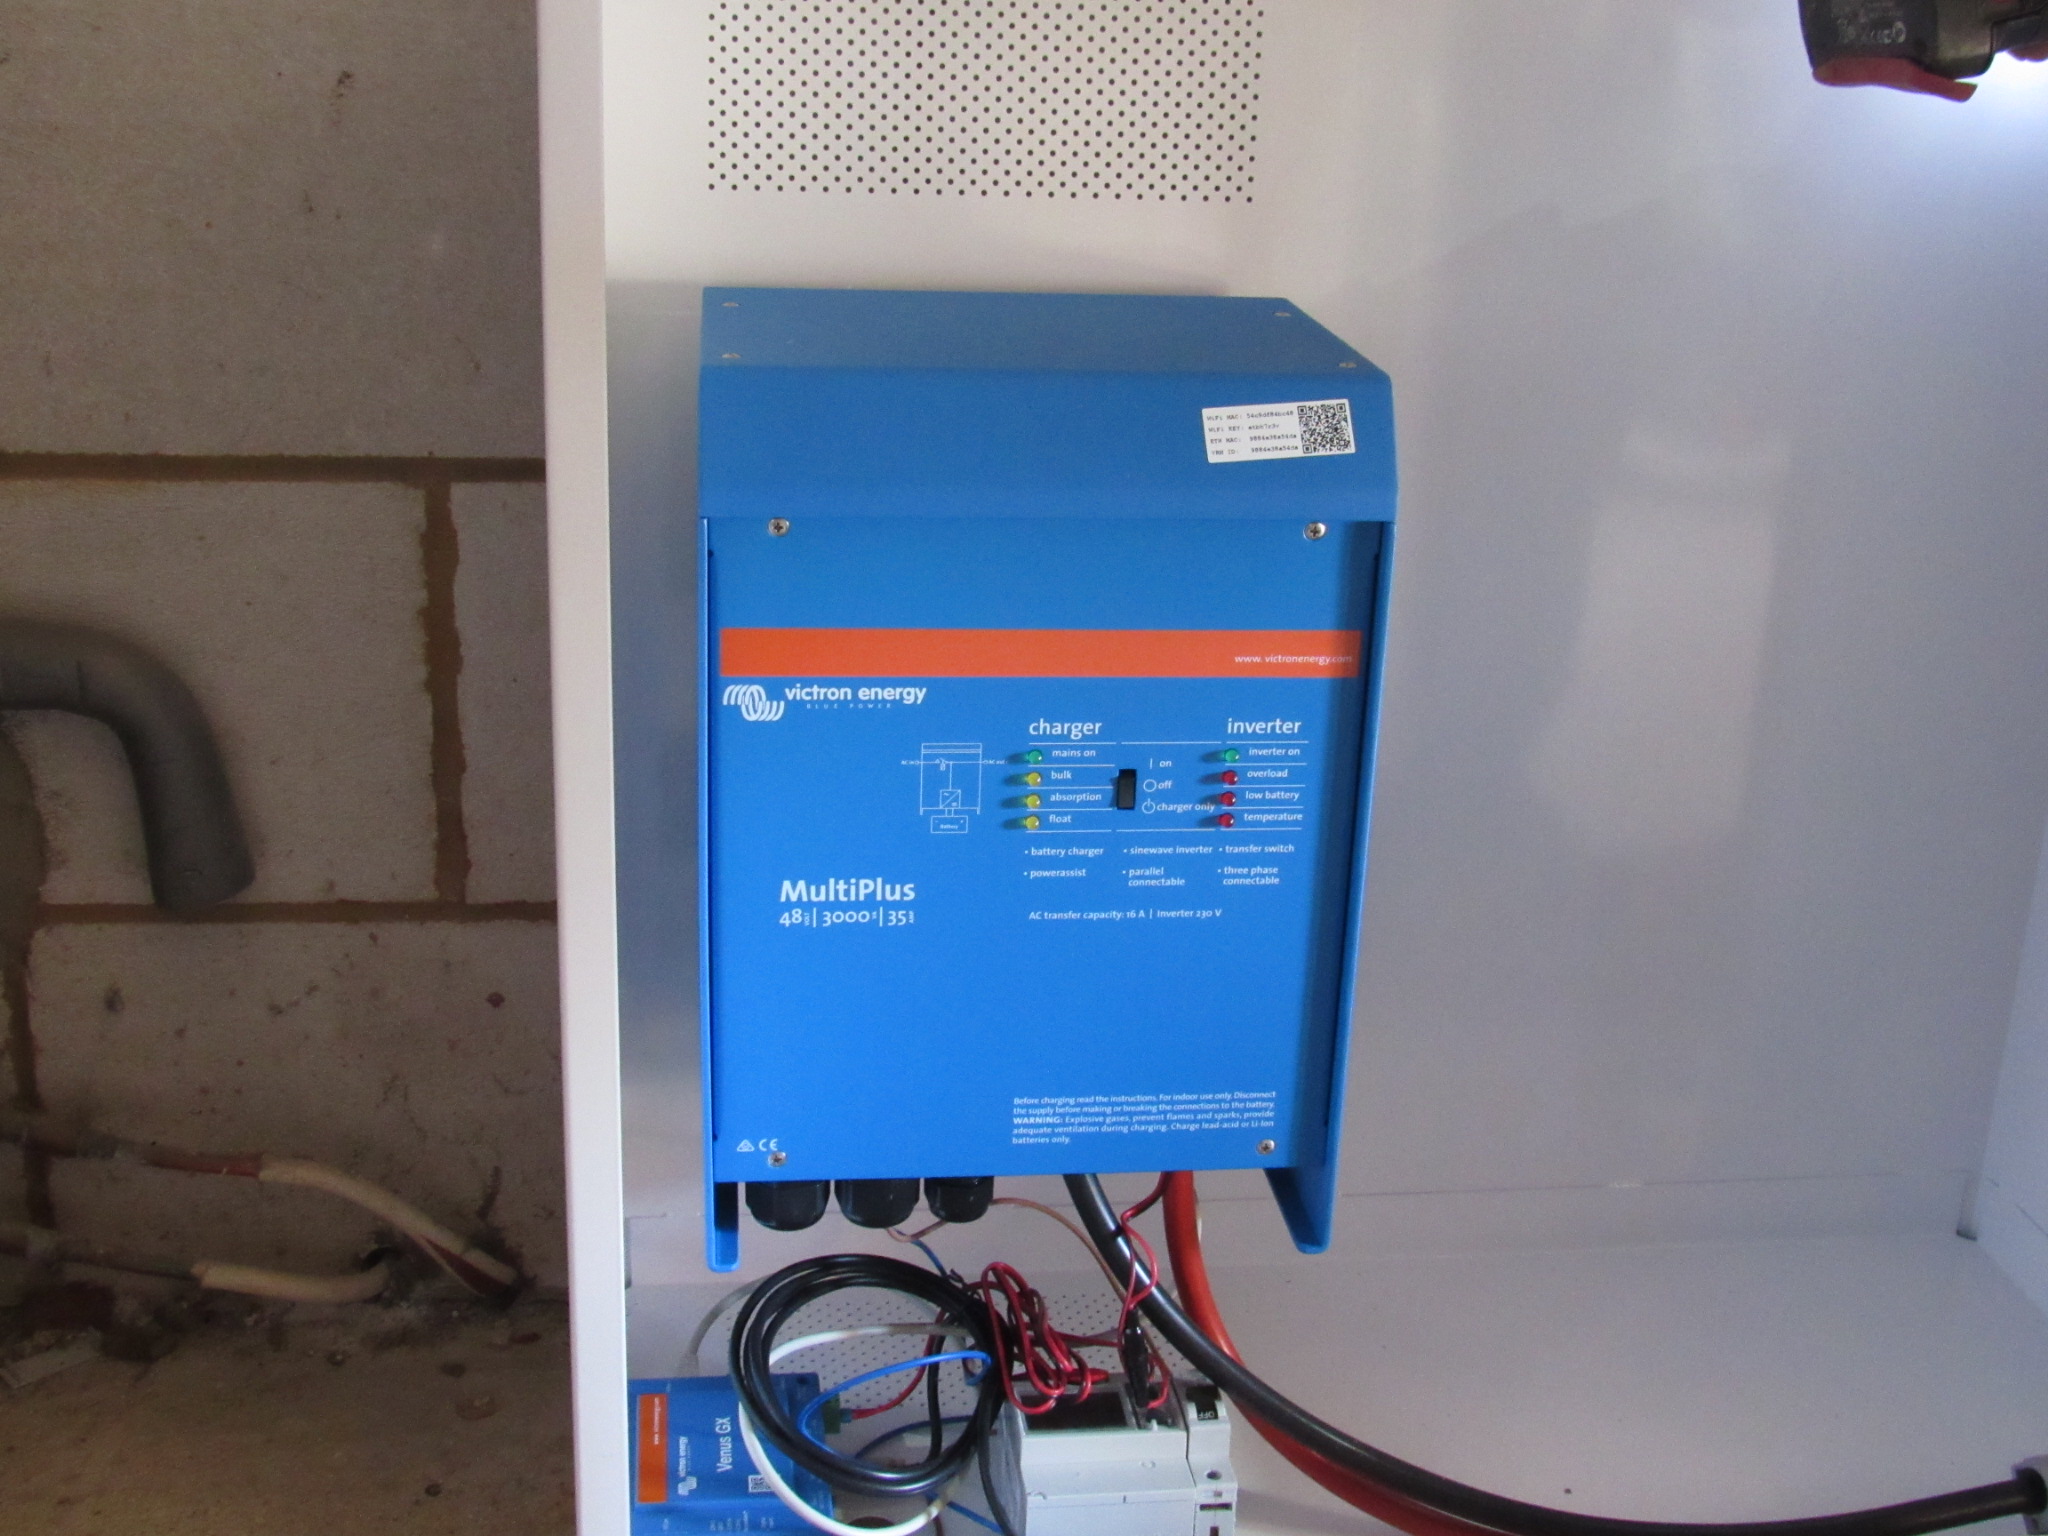
I'm a new user with a multiplus 48/3000/35 and Venus GX using a Puredrive 4.8kwh battery.


I'm disappointed with VRM data and graphs as the complete simple view of energy flow and consumption isn't visible. Firstly, grid export doesn't show in the graphs despite the legend showing a red metric for TO GRID. Instead it shows as self consumption?

Grid import is reasonably accurate.

PV solar yield is reasonably accurate.

I love the time frame quick links but the graph itself doesn't easily show values. Eg, yesterday's energy use. From grid, from battery, from solar. Just the kWh numbers or a pie chart with the numbers.

Pie like charts are available for 24hrs, 7days month and 365 days, clickable to see the kWh values but with small values they're not usable and the timeframes don't match. It'd be much better to have selectable graph types instead of the main bar charts, converting to numerical totals for the period and pie type charts.

The data is clearly there and the time frames are excellent so it's just the visual representation that's weak.

Oh and not forgetting grid export isn't showing on the graphs despite being visible in the downloadable data.


Does my system need adjustment or is grid export just not visible graphically?

Kindest regards


VRM
4 comments
2 |3000

Up to 8 attachments (including images) can be used with a maximum of 190.8 MiB each and 286.6 MiB total.

Matthias Lange - DE avatar image Matthias Lange - DE ♦ commented ·

Please give us some more details about the components and the wiring in system.

0 Likes 0 ·
nigelw avatar image nigelw Matthias Lange - DE ♦ commented ·

The battery is AC connected between the solar inverters, after the generation meters and before the consumer unit.

CTs are connected to the grid AC wire between the house meter cupboard and the consumer unit.

Solar CT is connected to the AC connection seeing both solar arrays output collectively.


If the system can see accurate import why can't it see accurate export, it's the Grid CT it should be using not derived calculated number?


The battery connection point isn't ideal and will be changed . At present the solar CT value excludes any energy going to the battery due to the connection point being after the CT point for the Solar arrays but I can't imagine how this might prevent any export whatsoever being visible.


Not sure what else I can share. The Victron components are effectively ore installed in the Puredrive cabinet with very little Installation being needed...so I thought.


0 Likes 0 ·
20200316104038.jpg (674.8 KiB)
nigelw avatar image nigelw commented ·

Multiplus firmware 424

Venus firmware online updated 2.53

0 Likes 0 ·

Please get in touch with your installer about a firmware update to the current version for the MultiPlus.

That is the first and necessary step before investigating any further.

0 Likes 0 ·
1 Answer
Guy Stewart (Victron Community Manager) avatar image
Guy Stewart (Victron Community Manager) answered ·

Hi @Nigelw,

Grid export should be shown visually in the graphs.

The first thing to do is confirm that all Victron devices (and specifically the GX device, and MultiPlus) are running the latest, current firmware.

For the MultiPlus, this update usually means the support of a qualified installer.

2 |3000

Up to 8 attachments (including images) can be used with a maximum of 190.8 MiB each and 286.6 MiB total.