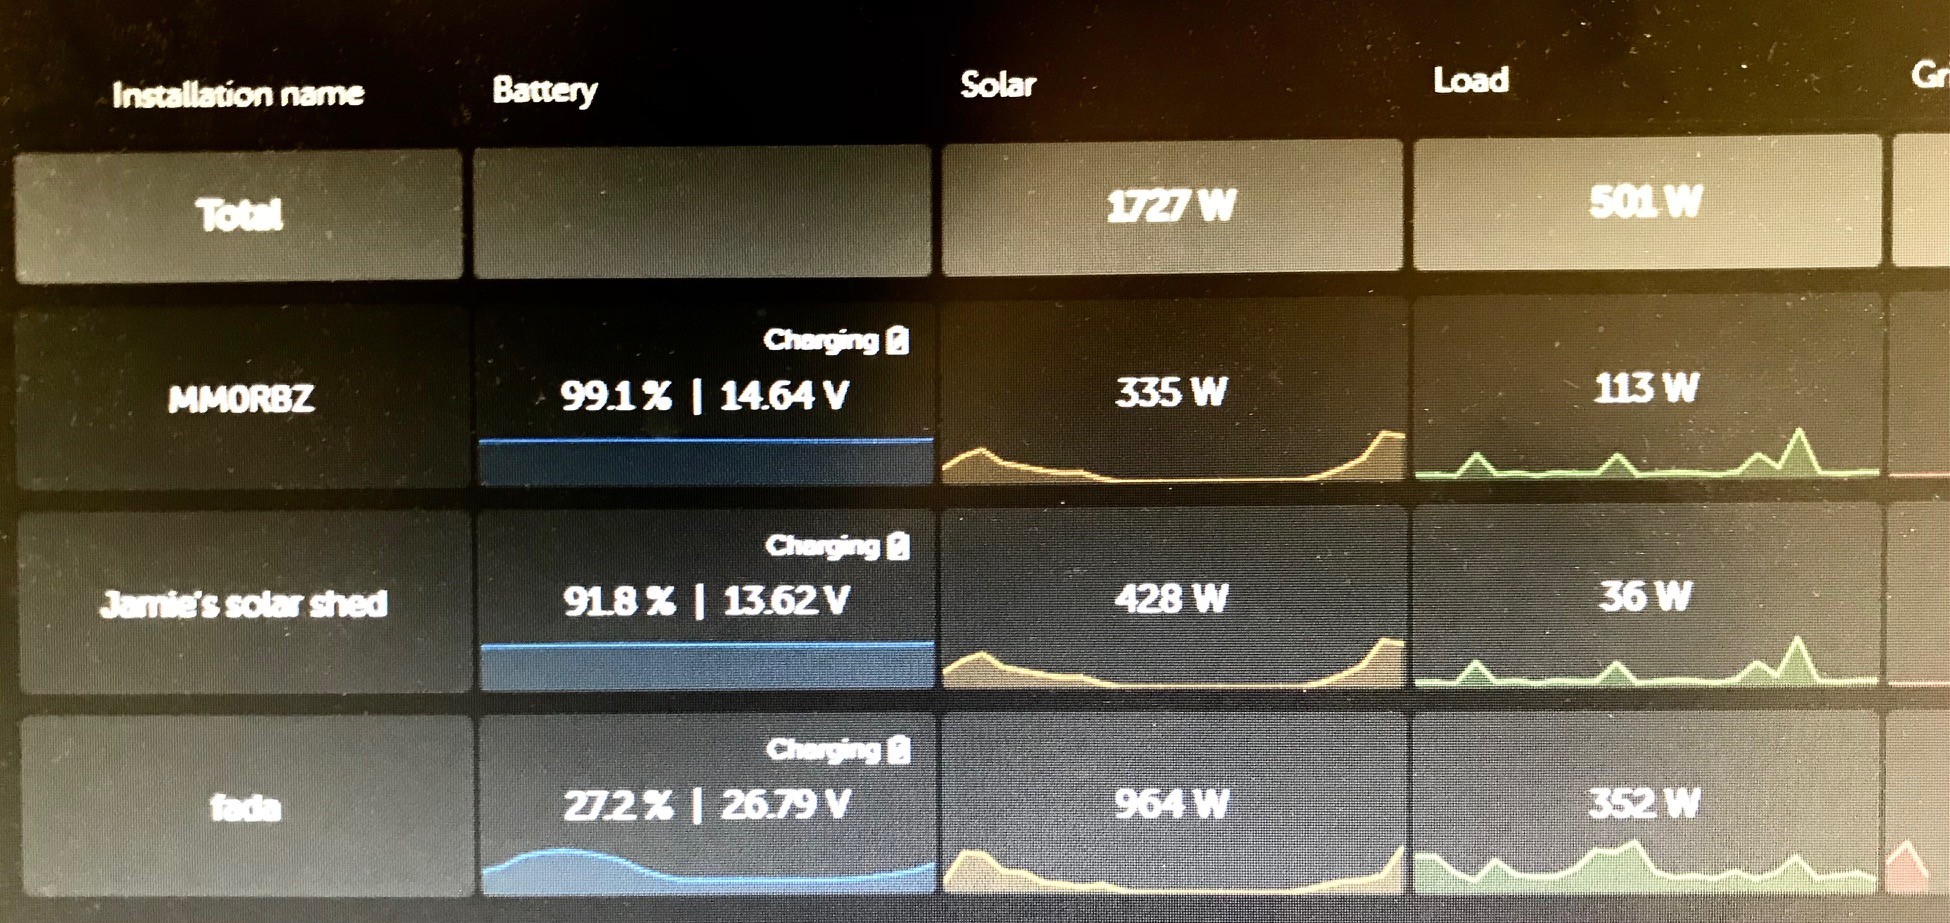
Release Announcement: New mini-graphs Feature on VRM Installation Overview
We are happy to announce the latest enhancement to our VRM platform – the introduction of mini-graphs on the installation overview!

What’s New?
The new mini-graphs feature provides you with detailed insights into the loads, solar, and grid performance of different sites in your overview for the last 24 hours. This addition is designed to help you monitor and optimize your energy systems with greater precision and ease.
Key benefits:
- At a glance insights: Understand the current status of multiple sites, without the need to open each one of them separately in VRM
- Proactive management: Quickly identify and address potential issues, ensuring your sites run smoothly and effective
- Signal load spikes early on: Get a clear view of the load patterns at each site, allowing for more informed decisions on energy usage and management
How to Access the mini-graphs:
The mini-graphs are available in detailed mode in your installation overview. Simply log in to VRM, select the settings button in the installation overview, activate detailed mode, and start exploring the enhanced data insights.

Any feedback on this feature is more than welcome!


