
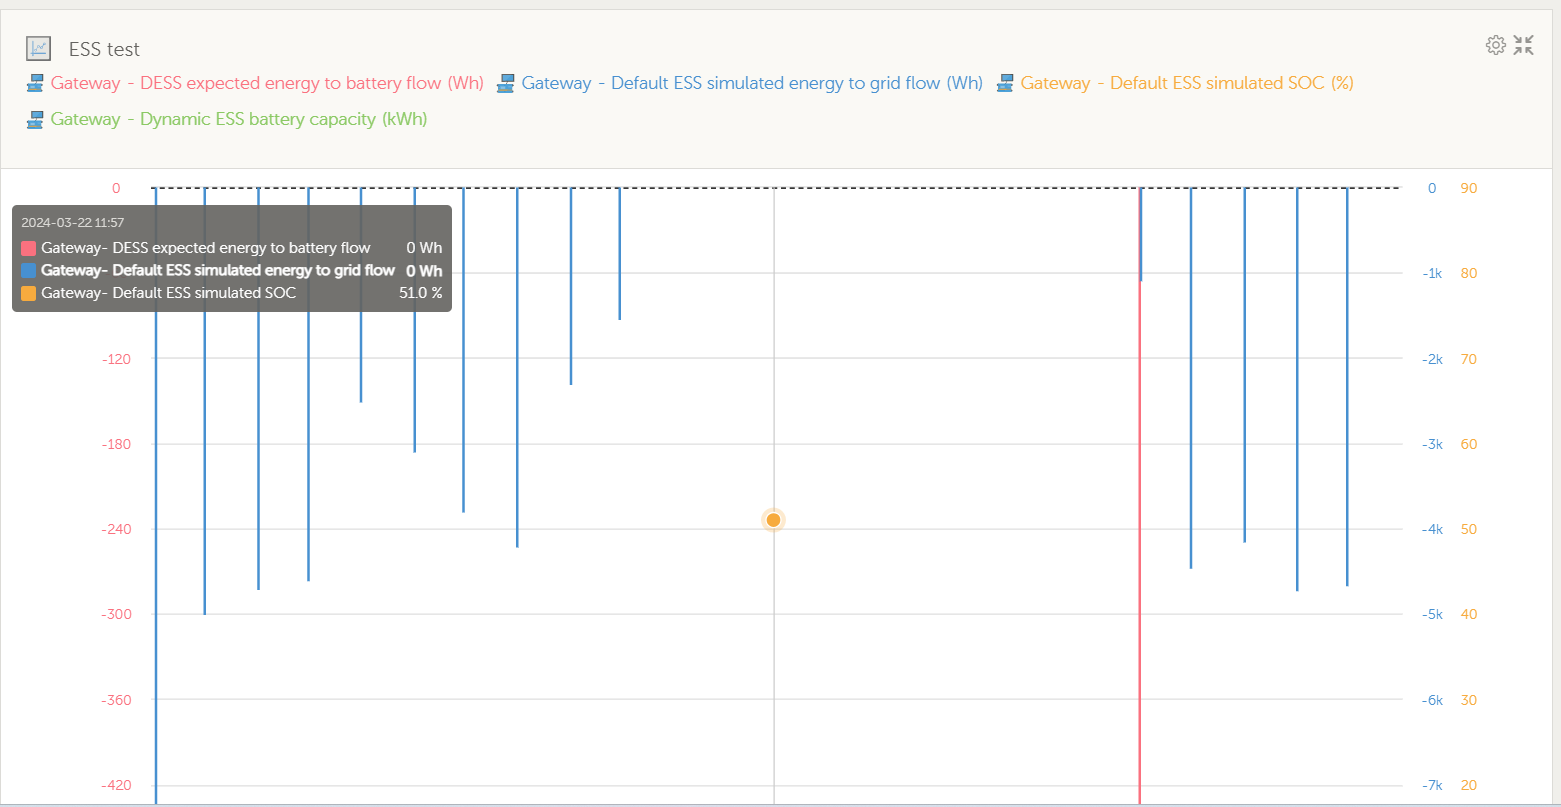
Some graphs are missing trend lines, like this "Gateway - Default ESS simulated SOC (%)".
Also, when a graph is maximized, it minimizes by it selft about every minute.
This site is now in read-only archive mode. Please move all discussion, and create a new account at the new Victron Community site.
Some graphs are missing trend lines, like this "Gateway - Default ESS simulated SOC (%)".
Also, when a graph is maximized, it minimizes by it selft about every minute.