Hi,
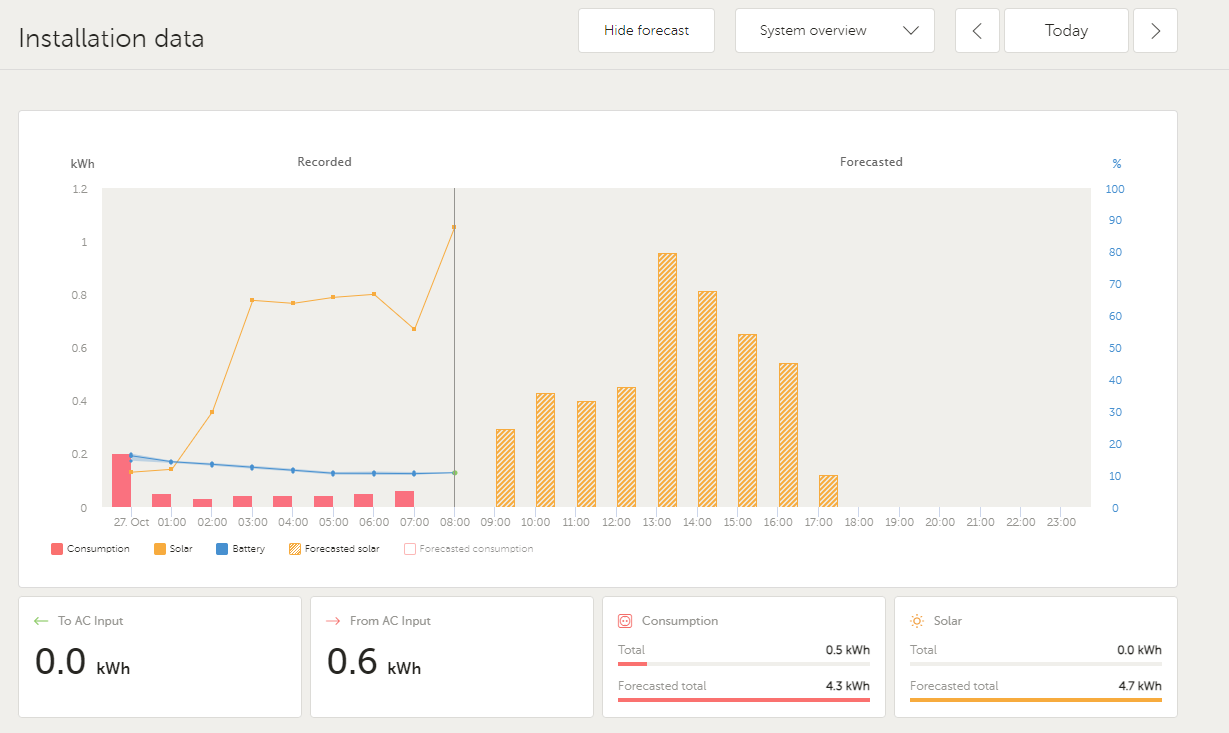
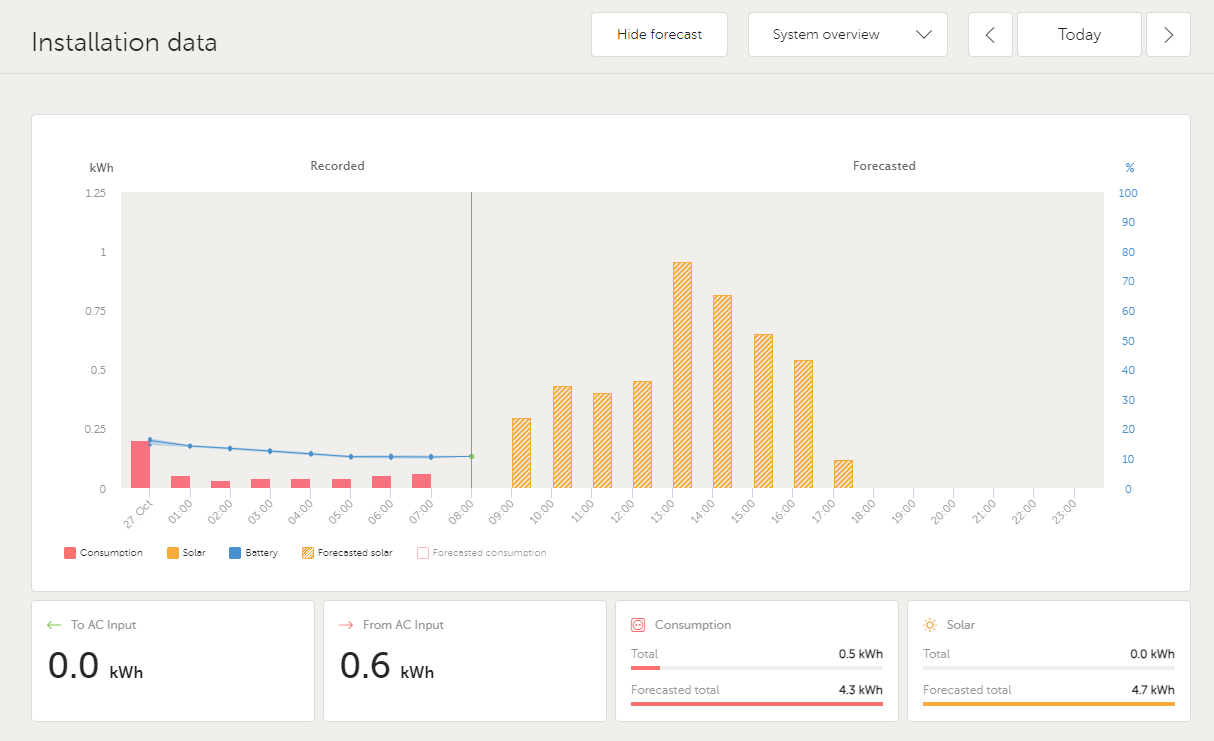
not sure if instable is the rigth word; but depending on how you land on the installation data graph you may see different results (some of them beeing clearly incorrect)

above, the page is loaded new on the Chrome browser, windows 10. Tried full reload too (ctrl+F5) and the page consistently load that way.
the thing is - it shows recorded sun at nigth. the production forecast is surprisingly accurate (we love it quite a lot), the forcasted consumption is too recent to judge. But the historical data is clearly off the mark.
interrestingly, if you go to the day before and back to today using the arrows in the right corner of the screenshot (on the VRM site, of course) the inconsistency disapears.

there was one week of lost Internet beginning of the month and the VRM portal started to show this behavior around this time - but I can't tell 100% it's linked.
Also, since this time, starting the VRM on the Iphone app often shows an error message "incorrect data" something (exact message I forgot) - but everything after that shows properly. Wanted to add a screenshot of the phone app but of course the moment you prepare a report it's no longer showing ...
