New to VRM and establishing some monitoring.
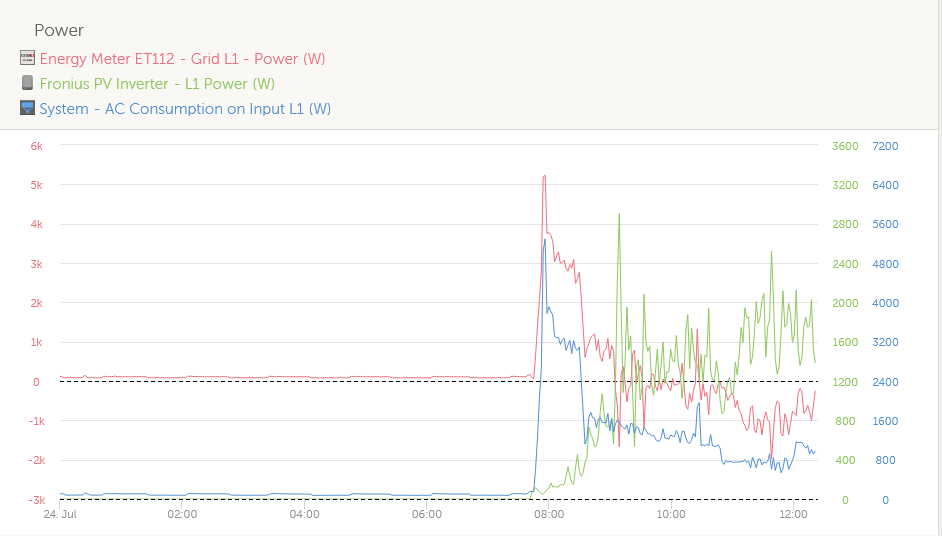
Set up the following in Advanced - Widget tool:

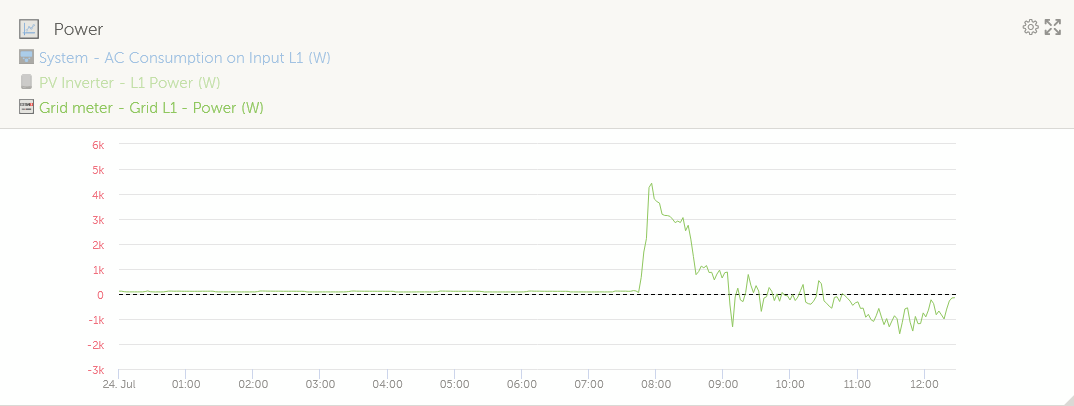
When saved it appears as follows in Advanced:

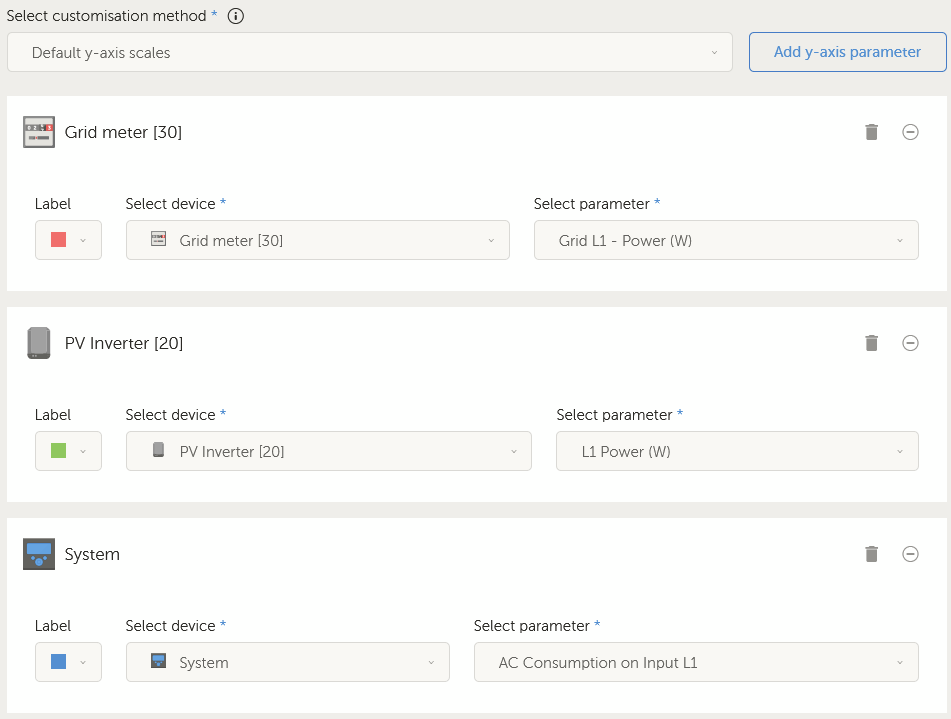
This is how it has been configured:

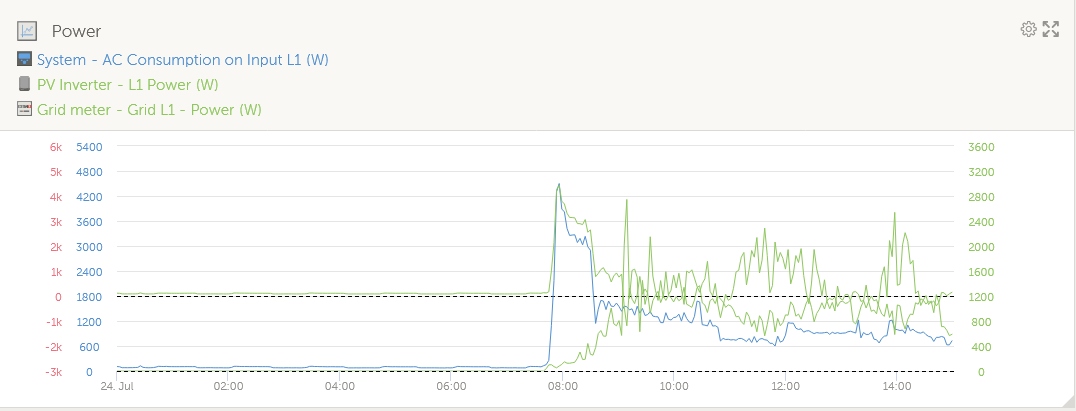
Not only have names and colours of the y values changed, two have disappeared but there is space for their axis to appear!?
Am I doing something wrong or is there a limit to number of values that can be displayed?

