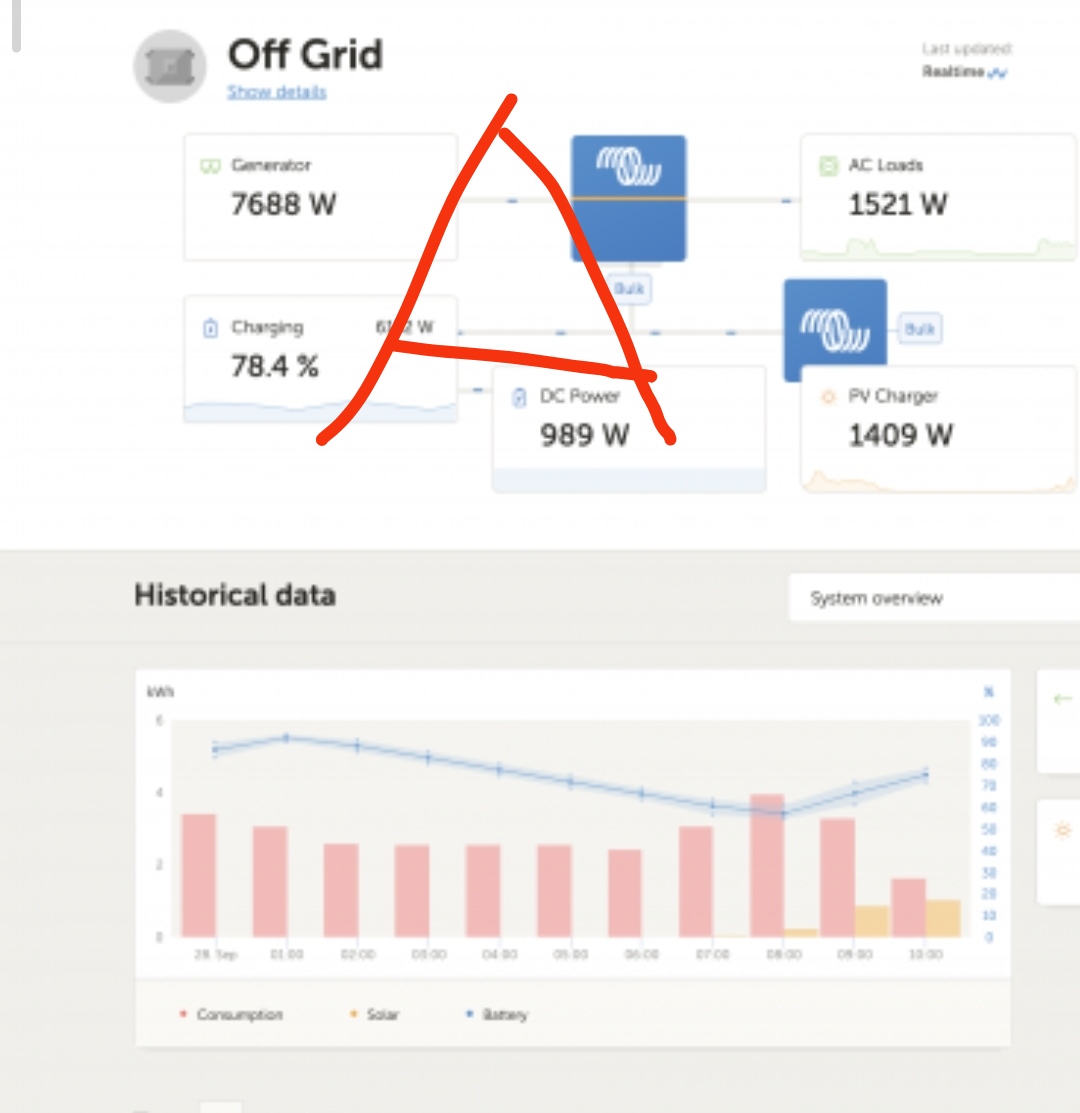
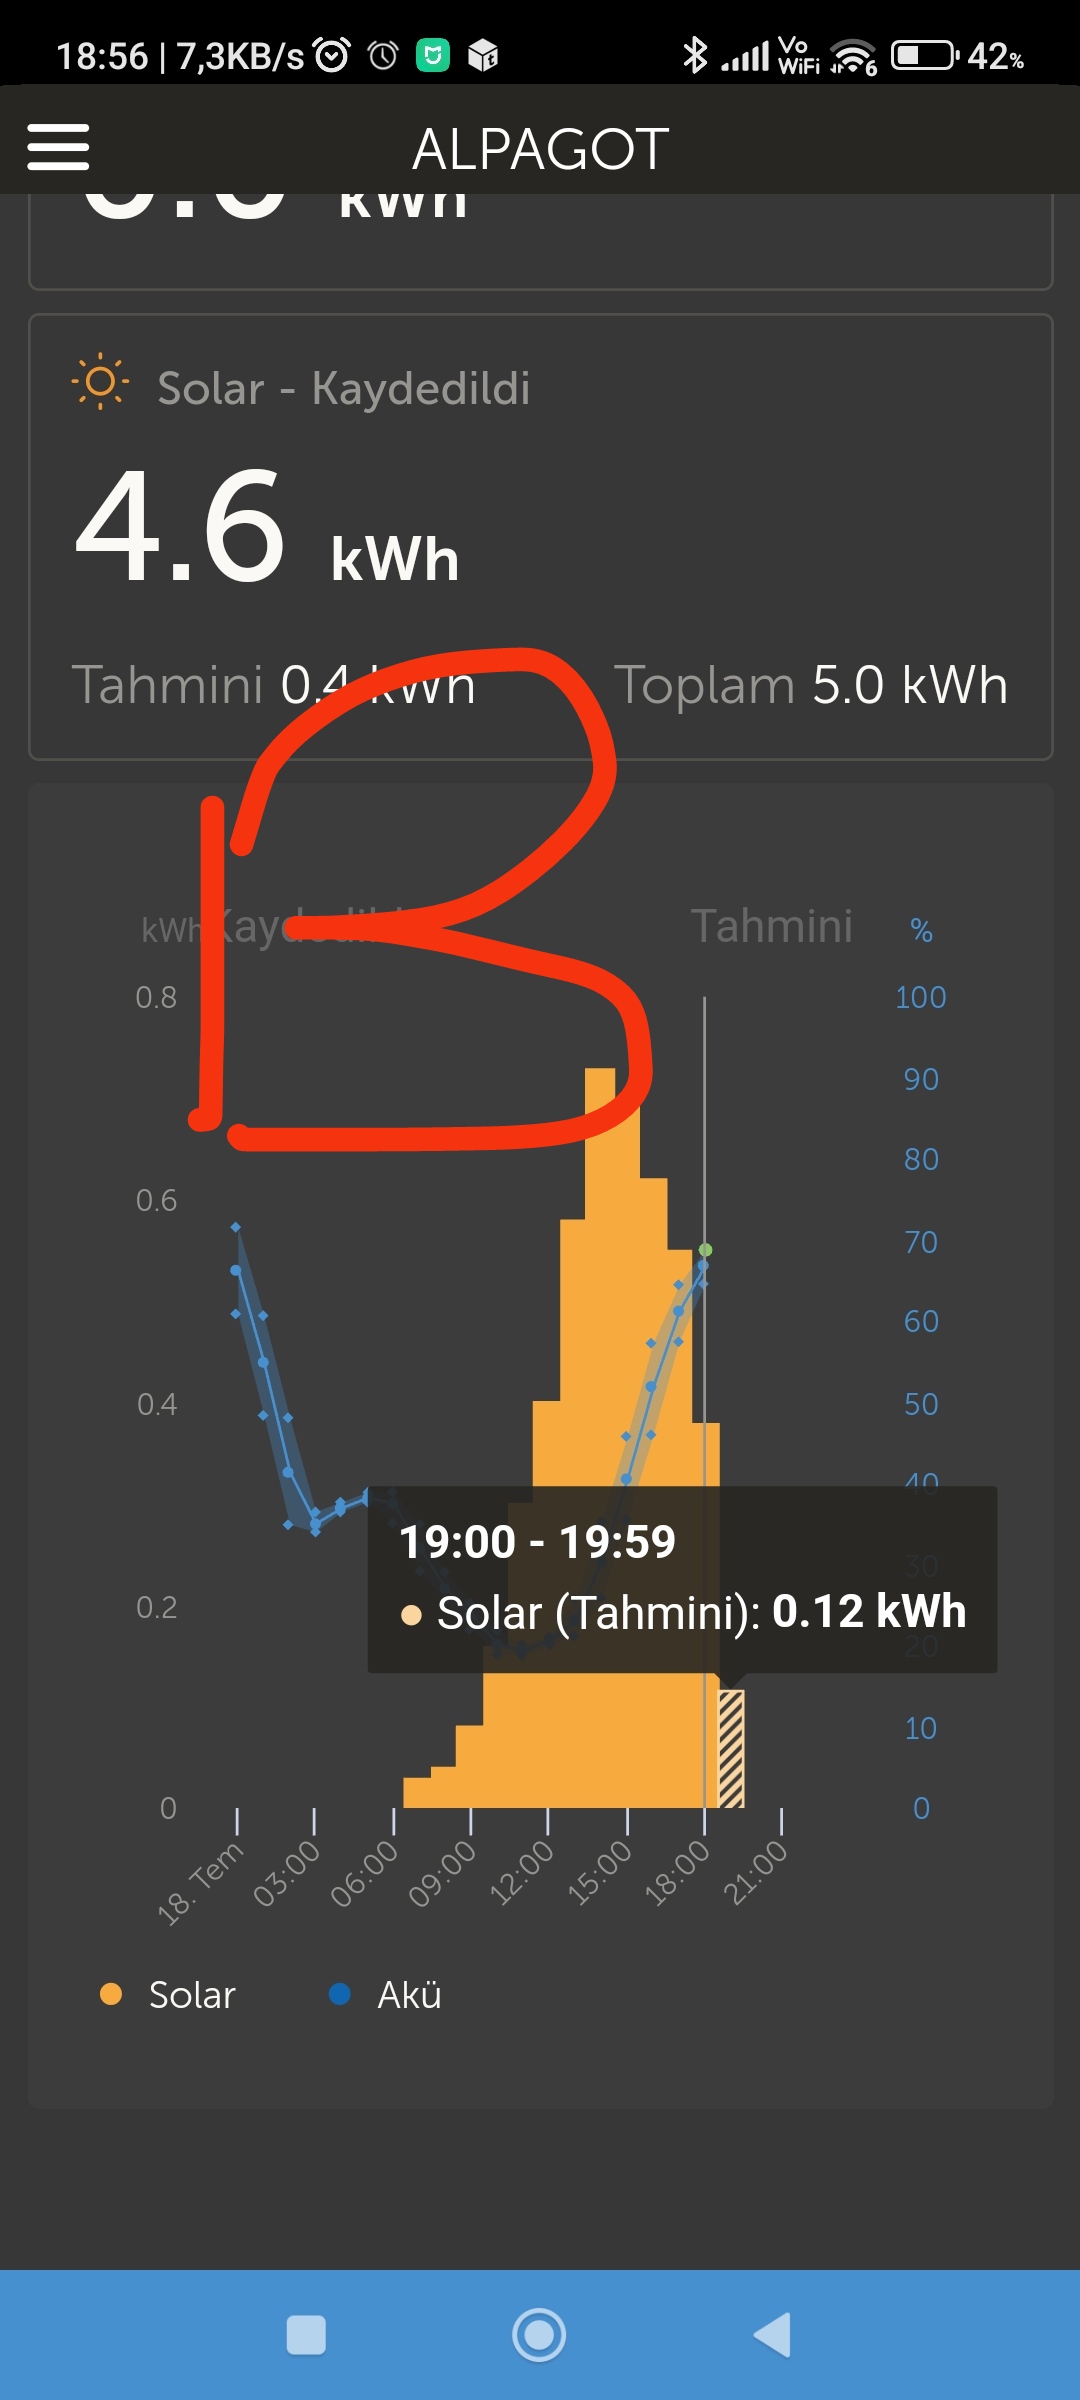
 In Victron VRM Dashboard, my graphic only shows solar and battery as in figure B. Consumption is also shown in figure A. I want to see this graph, how do I do it.
- Home
- Anonymous
- Sign in
- Create
- Spaces
- Grafana
- Node-Red
- Unsupported topics
- Questions & Answers
- Modifications
- Communauté francophone
- Deutschsprachiger Bereich
- Preguntas en Español
- Explore
- Topics
- Questions
- Ideas
- Articles
- Badges
question
I can't see the graph in figure A in VRM.
A diagram of another user's front panel in Vrm, I put it as an example. I also want to see /solar/battery/ and consomption in a single graph like in this system. There is no consomption in the my graph.
It would help if you posted actual shots of the problem, instead of shots from another system.
There's a show/hide forecast button on the screen. Clicking this switches from on graph to the other.
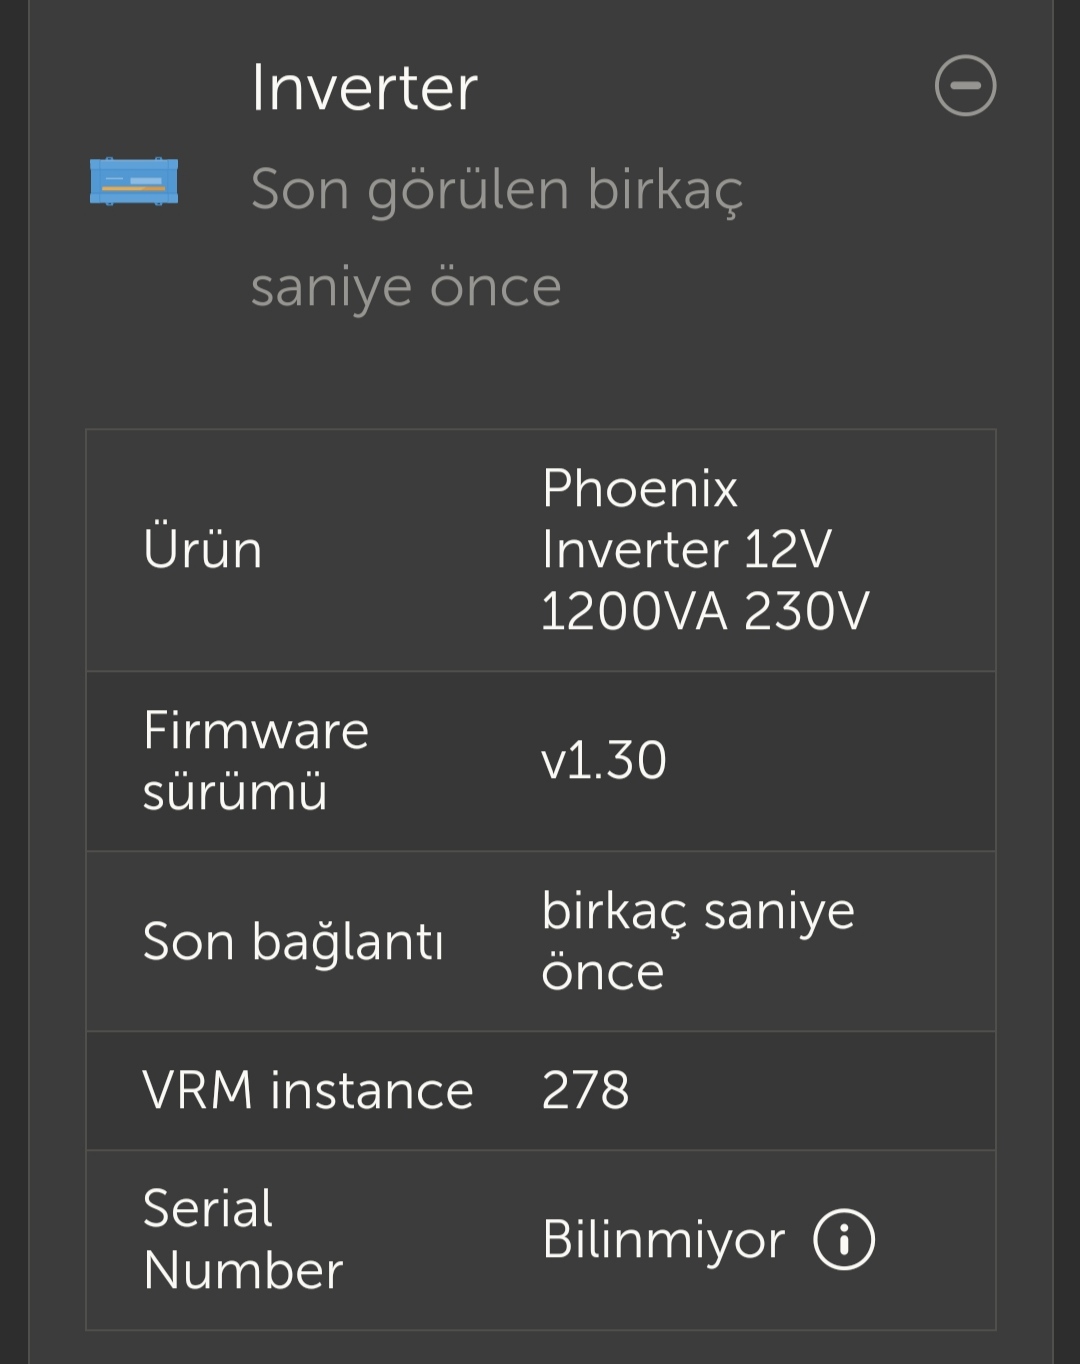
I have a phonex 12/1200 invertör and connected to the Cerbo Gx Via ve direct connection.
It is showing no data for the inverter beyond loads.
Can you confirm the age and specific model number of this inverter? When last was it updated, do you know its firmware version?
Related Resources
Additional resources still need to be added for this topic
question details
34 People are following this question.

