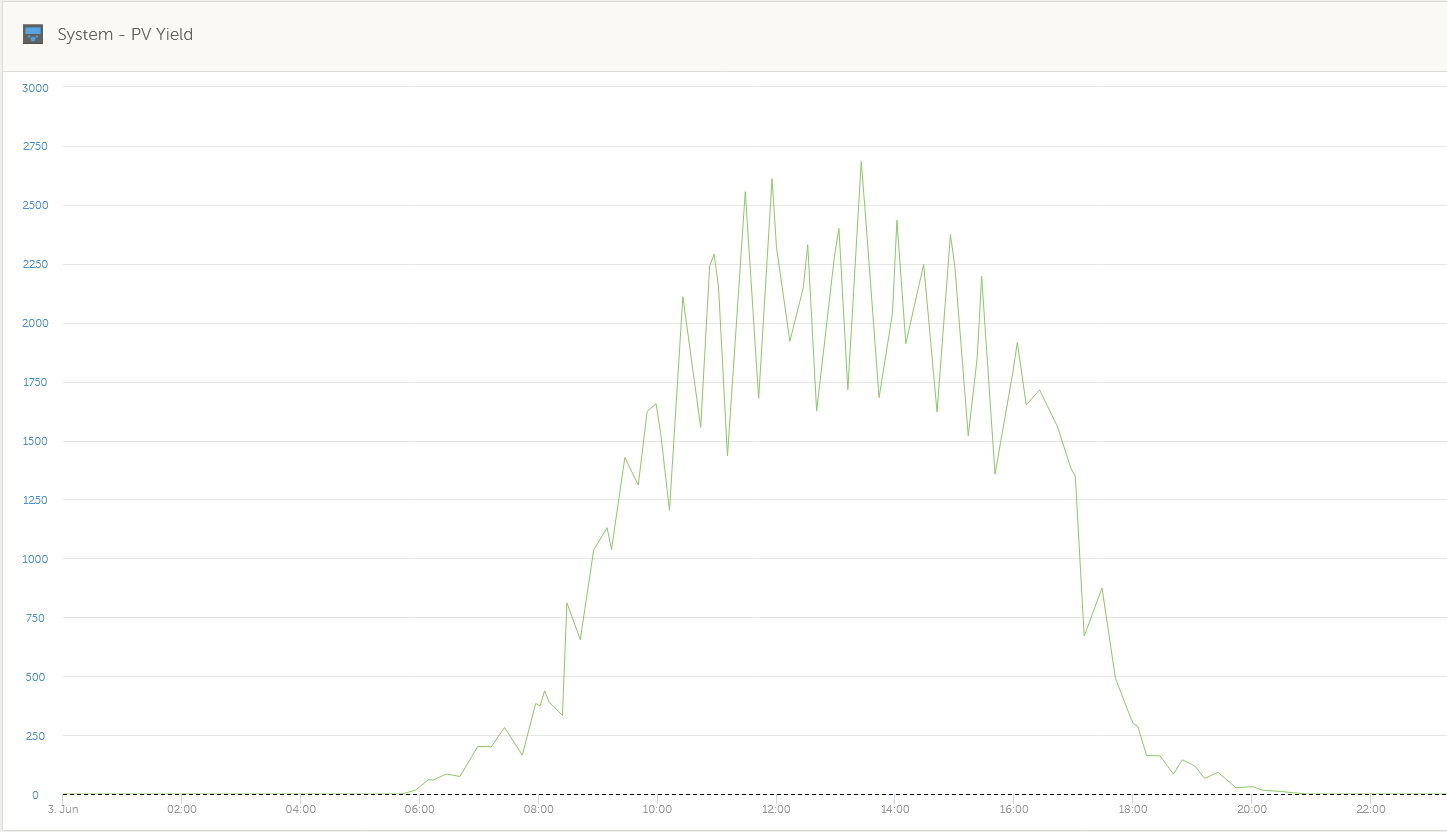
Hello, being a newbie to the subject and the PV solar power as well, I would like an explaination to the following graph. It shows PV YIELDS (in Watts) during a sunny day with absolute clear sky. What I don't understand are those drops (see-saw pattern) in the graph. I'm using MultiPlus-II 48/3000/35-32 system with SmartSolar MPPT VE.Can 150/85 rev2 charger.
Thank you for any hints or explanations.

