Hello All
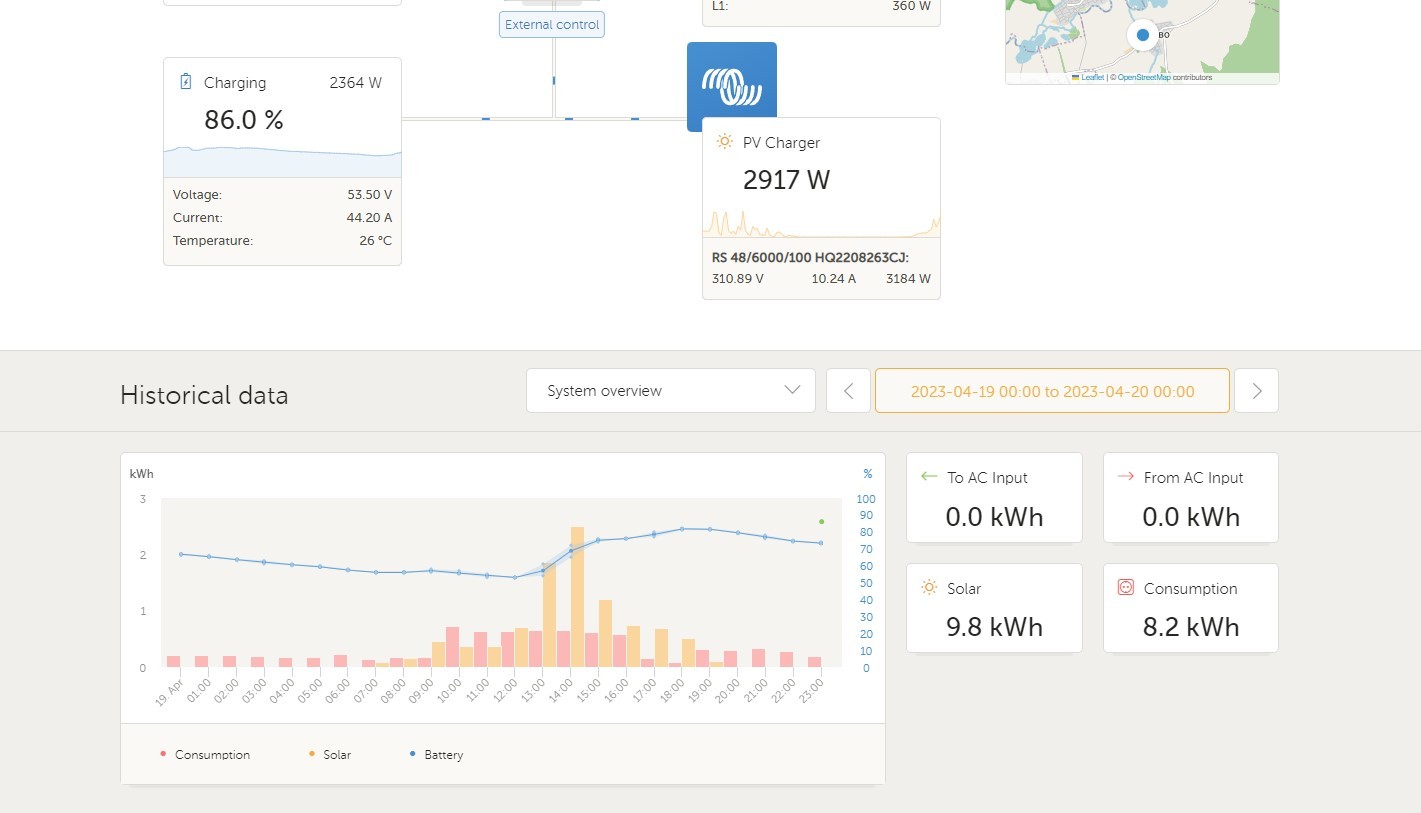
After updating whit the latest version my historical data visualization was changed.

Now it shows me only SoC and PV production.
Before it shows me also the consumption, and I like the graphics more also.

I know it sounds like a rookie question, but I try a lot to bring back the old stive of visualization without susses.
Thanks in advance for your help.
Kiril
