Hello,
an EV Charging station was added to an ESS system, WiFi/Modbus-coupled with the CCGX, it works in all modes and can be configured via the CCGX.
In the VRM portal dashboard of the system now there is visible a new box "EV Ladestation" showing the connection state and a small blue graph representing the energy charged to the car (range 24 h?).
What I am missing is a display of the long term historical data of the EVC. Means: values in the big graph (system overview/consumption/ etc.) just for the EVC.
There is also no extra box for the EV charging data in the "Erweitert" view windows page as for all the other devices of the ESS.
How I get such a long term visualization of the EVC charging energy data over time, e.g. over a month/year? Is it therefor necessary to additionally configure something for the EV Charger in the CCGX or VRM portal?
I hope, there is no extra counter necessary in the power lines to the EVC (as it has its own sensors).
Kind regards

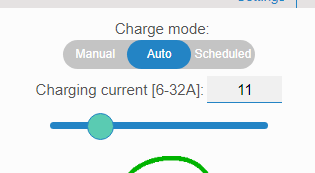
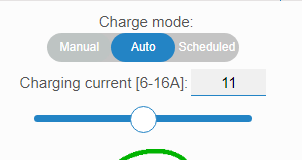
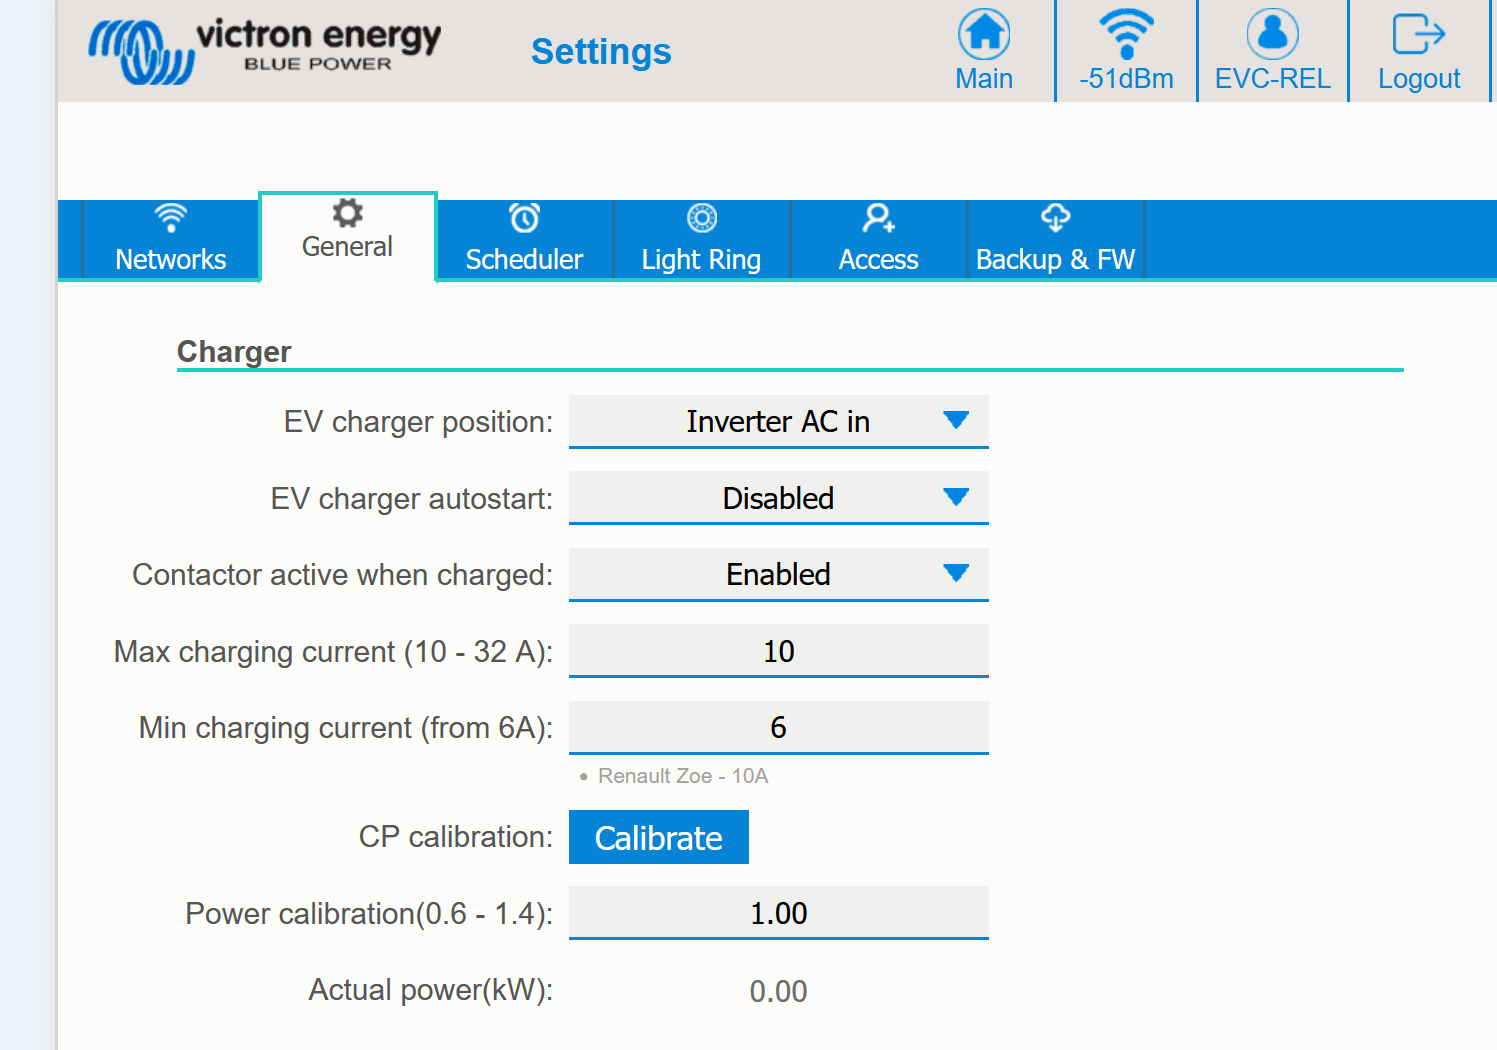
 If you reduce the max current to a lower value, the slider will work from 6, to the new value, let's say 16 A:
