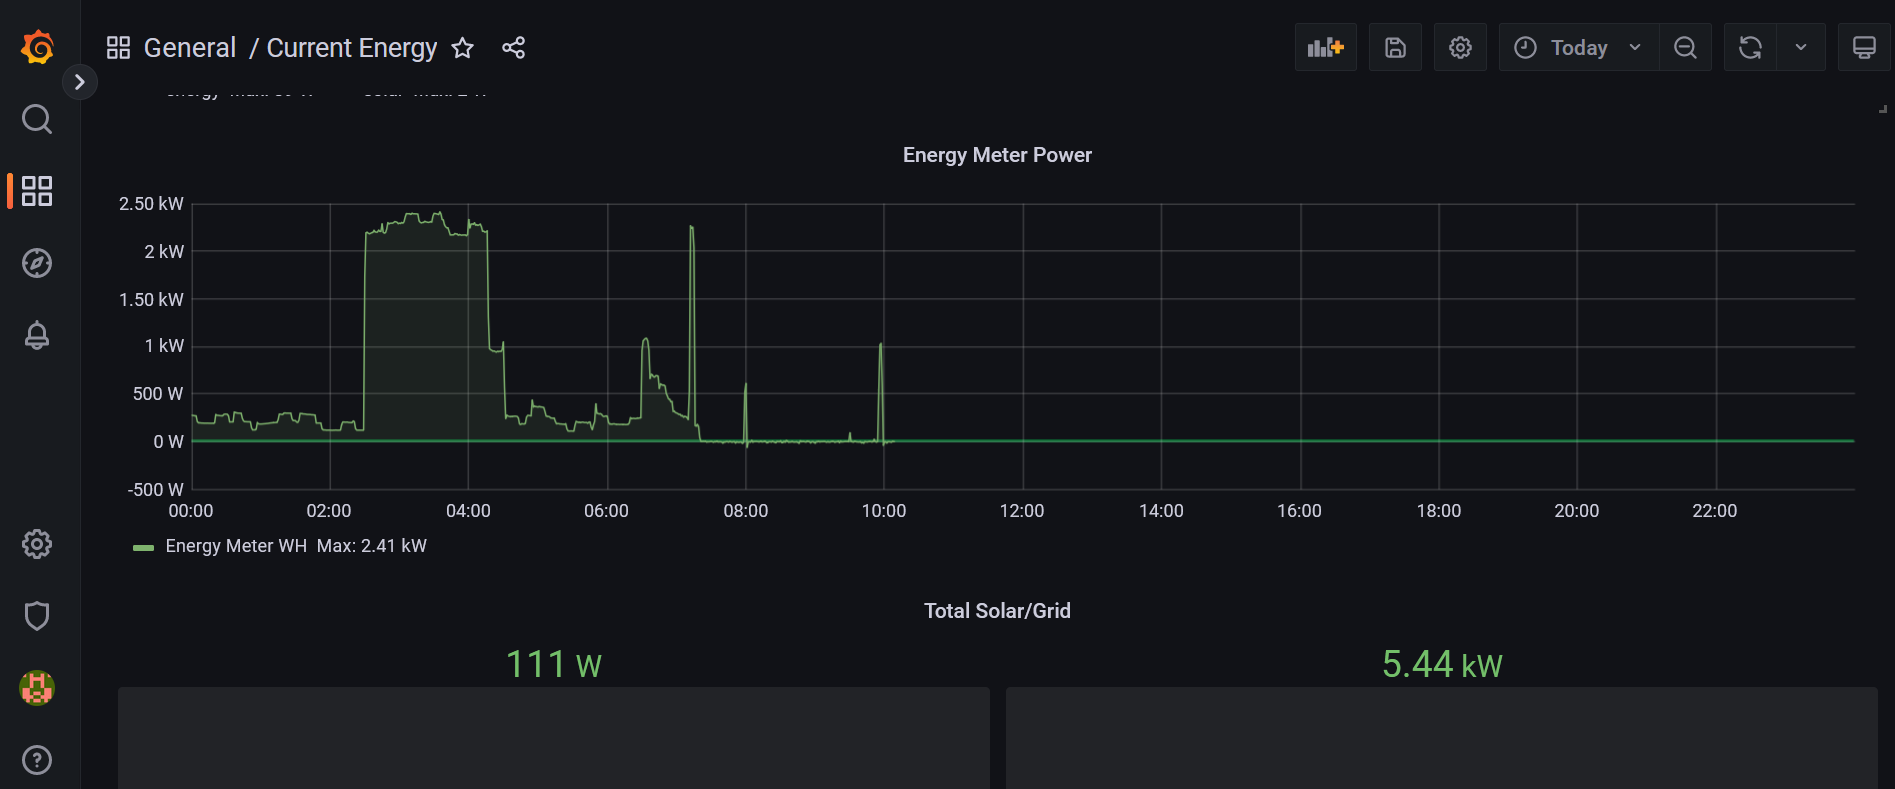
I would like to connect the data that is feeding into the data visualization chart so that I can us my own datavis tools to view the data and combine it with other metrics of my own, such as when I purchase gas for my generator, how long that gas lasts over time... that kind of thing as compared to the energy useage so that I can have a more accurate annual record of my energy uses and costs in the same place. I can work with any kind of data feed in my datavis system. I just need to know how to access the data my system is sending.
Can anyone advise as to how I can do that?

