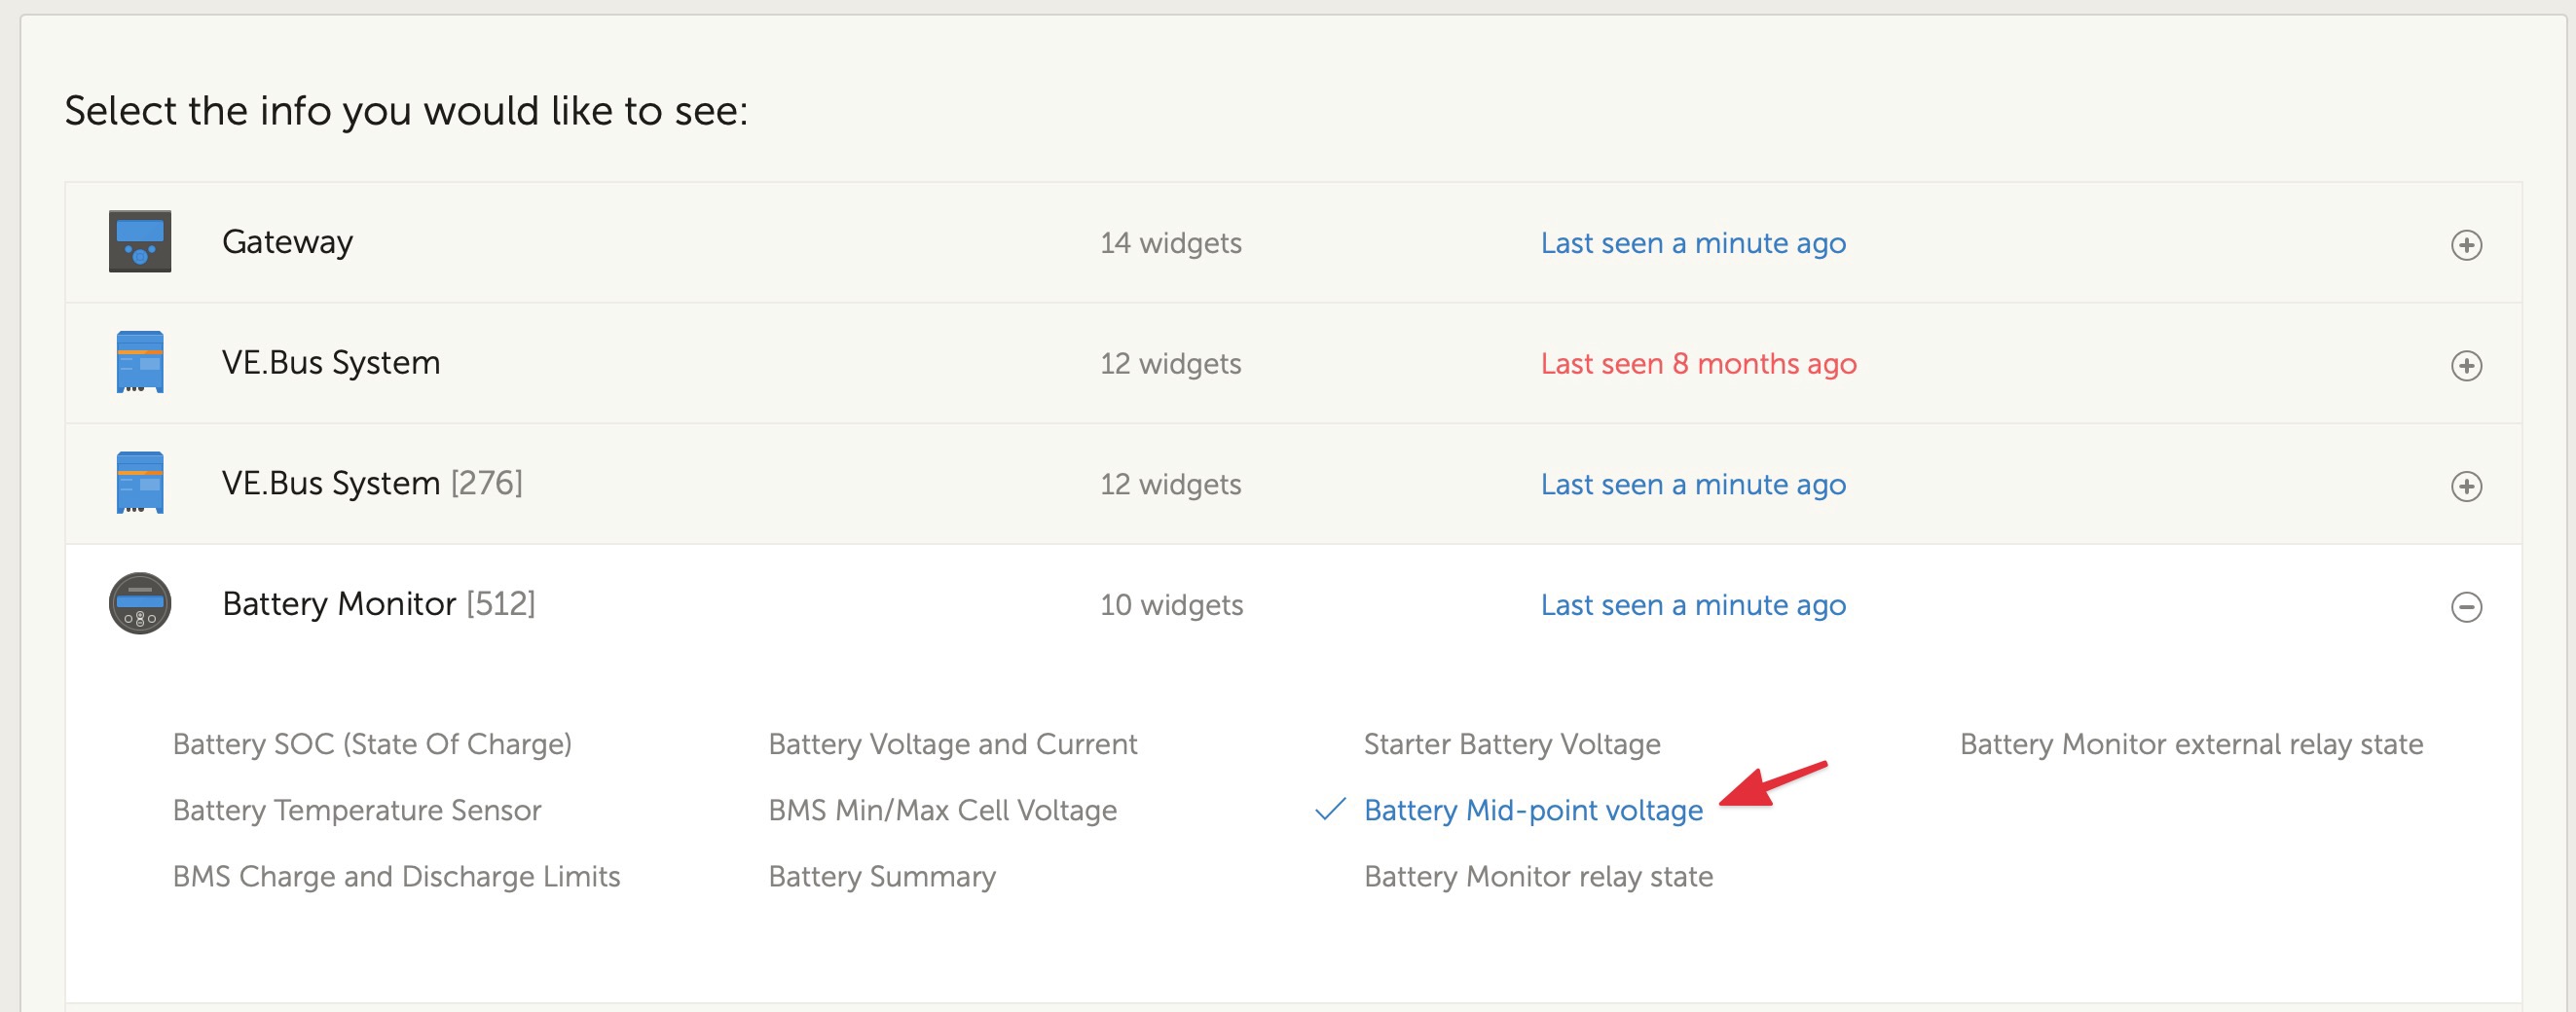
I'd love to see my mid point over time. I've got a situation where it seems to flip high and low, would be nice to see that data graphed out.
- Home
- Anonymous
- Sign in
- Create
- Spaces
- Grafana
- Node-Red
- Unsupported topics
- Questions & Answers
- Modifications
- Communauté francophone
- Deutschsprachiger Bereich
- Preguntas en Español
- Explore
- Topics
- Questions
- Ideas
- Articles
- Badges
question
1 Answer
Hi @neoneddy,
This is now available,
You can enable the mid-point voltage graph in the advanced section of VRM.

midpoint.jpg
(183.4 KiB)
Related Resources
The feature requests topic tag can help Victron R&D find feature suggestions for products.
There are many factors that go into the Victron product roadmap, and feedback from end-users can help.
question details
6 People are following this question.
