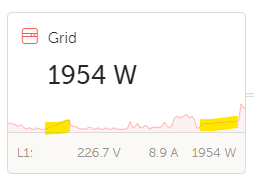
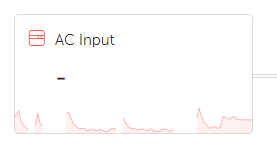
The over screen on the VRM page seems to interpolate between points, and this conceals a grid outage on the grid tile.
The highlighted portions each had grid outages in excess of 2 hours, but you can't really see this at a glance. When hovering the mouse over, there is no data between the start and the end of the outage, and it just snaps to either side giving you a clue that there was an outage.
I suggest the trend line drops to zero when this happens.

 Thanks!